
A product can be available without being used, and it can be used without producing the economics an investor imagined. Abbott’s new colorectal-cancer screening option makes those distinctions worth tracking. The useful research question is how an additional route through the screening process changes completed commercial activity, rather than how impressive the launch headline sounds.
This October 3 Saturday evening edition builds a completion funnel for ABT. Equities are closed. The chart below was captured anew tonight and ends with the completed October 2 daily candle. It provides a price-response framework for the next open session, not a live weekend quote or proof that one announcement caused a particular candle.
Macro: Access is a process, not just a product category
Healthcare demand reaches a company through several steps. A potential customer must become an appropriate user, an order must become a completed service, and the provider must collect payment under the relevant arrangement. A broad need can remain large while conversion between those steps stays uneven. Investors therefore need to examine the route from the clinical setting to commercial activity.
For diagnostics, that route includes practical coordination. An additional way to complete a test might reach someone who did not finish a previous approach. It might also replace an existing test rather than add a new completed screening. Those outcomes have different implications for the provider’s portfolio. A bigger menu and a bigger addressable population are starting conditions; neither is a measurement of incremental revenue.
The macro lens here is the execution of healthcare access. I am not assigning a new economy-wide growth rate to screening or assuming all diagnostic businesses benefit equally. The question is narrower: can a product option and the support around it help a company turn potential demand into completed activity with sensible economics?
Fundamental: Separate the product’s owner from its commercial route
Abbott announced the U.S. commercial launch of SimpleScreen CRC on September 30. The company describes it as an FDA-approved blood-based test for average-risk adults age 45 and older, developed and manufactured by Freenome and exclusively commercialized by Abbott. It joins Cologuard Plus in Abbott’s portfolio. Abbott’s release positions the blood option for eligible people who decline or do not complete preferred screening methods; it does not describe the approaches as interchangeable for every person.
Those roles matter to the investor’s model. Development, manufacturing and commercialization can belong to different parties. A commercial channel does not automatically carry the entire selling price into the distributor’s profit. This release does not provide enough transaction economics to estimate Abbott’s profit per test. I would leave that line blank until a company disclosure supplies the relevant terms or financial contribution.
The announced launch is an achieved availability milestone. A future volume ramp is a separate proposition. My inference is that an additional route could help the portfolio serve previously uncompleted demand. That inference requires evidence of actual completion and financial contribution. It should not be promoted into an established sales trend simply because the product is now commercially available.
The funnel: Count the transitions before multiplying a market size
Start a research worksheet with four columns: appropriate orders, completed tests, paid commercial activity and resulting economics. Keep the population definition consistent across the columns. If an order is cancelled, delayed or never completed, counting it as a completed test would overstate use. If a test displaces another portfolio offering, counting every completion as incremental would overstate expansion.
As a purely hypothetical example, imagine 1,000 appropriate orders, with 600 completed tests and 400 still unfinished. If completion rises to 750 with the same order count, the improvement is 150 completed tests. That is a 25% increase in completions, even though orders did not grow. The example is arithmetic, not an estimate of Abbott’s experience or a forecast for SimpleScreen.
Now imagine orders rise to 1,250 while completions stay at 600. The top of the funnel grew 25%, but completed activity did not. A headline about stronger interest could coexist with no improvement at the next step. Without matched counts and consistent periods, an investor could mistake a wider opening for more throughput.
The last column remains necessary even if throughput improves. Support, collection arrangements and the commercial agreement can affect the economics. No unit price, margin or revenue run rate is being inferred here. A transparent model should display the missing inputs rather than conceal them behind a large population estimate.
The checkpoint: October 21 can update the evidence
Abbott separately announced that third-quarter 2026 results will be released Wednesday, October 21, before the market opens, followed by an earnings webcast at 8 a.m. CT. That is the next dated financial checkpoint used in this article. A September 30 launch falls near the quarter’s end, so an investor should not assume that the next quarterly total will reveal a mature run rate for this new option.
At that checkpoint, listen for management’s description of availability, early use, the commercial model and any quantified contribution. A launch update and a portfolio revenue figure answer different questions. If product-specific details remain undisclosed, the uncertainty remains; a favorable aggregate alone would not fill the missing funnel columns.
Technical: The stock has lost the $100 area
The genuine daily TradingView chart is NYSE-listed Abbott on the Cboe One feed, observed as BATS:ABT. Friday’s completed candle opened at $97.25, reached $97.59, traded as low as $95.06 and closed at $97.50. The established 55-day EMA reads $103.35. RSI(14), the sole lower panel, reads 29.69. These are feed-specific historical observations, not executable weekend prices.
The June-to-October framing shows the summer rise followed by a retreat through the $100 round-number area. Price is below the EMA, and the right side of the chart has weaker momentum than the August advance. An RSI reading below 30 can describe a stretched decline; it does not establish a bottom or remove the need for price confirmation.
The constructive case first needs a future daily close back above $100, followed by a pullback that holds that area. The displayed $100.33 swing reference provides nearby context, while the EMA at $103.35 and the $104.54 swing-high reference sit higher. A first reclaim would improve local behavior, but the wider recovery still needs acceptance through that overhead structure. The EMA changes with new candles.
The base case is a pause around Friday’s $95.06–$97.59 range without recovering $100. That could slow the decline while leaving the larger technical problem unresolved. The bearish case is a daily break below $95.06 followed by failure to reclaim it. I would then reassess the next visible structure using the newly completed bars, rather than invent a precise downside target from tonight’s static image.
Risk: Commercial proof and trade confirmation must arrive separately
A proposed $100 reclaim is invalidated if the stock fails back below that area and subsequently closes beneath Friday’s $95.06 low. That is a condition for the local price scenario, not a verdict on screening demand. The commercial inference weakens if later disclosures show little incremental completion or economics that do not support the assumed benefit. A rising chart cannot substitute for those disclosures.
Before considering any entry in an open session, use actual prices, liquidity and spreads. The October 21 event can produce a gap through a planned exit; options add time-decay and volatility risks. This article is an educational framework with no position, execution, realized return or guaranteed result claimed. Tonight’s task is to define the missing evidence and the conditions that would change the read.
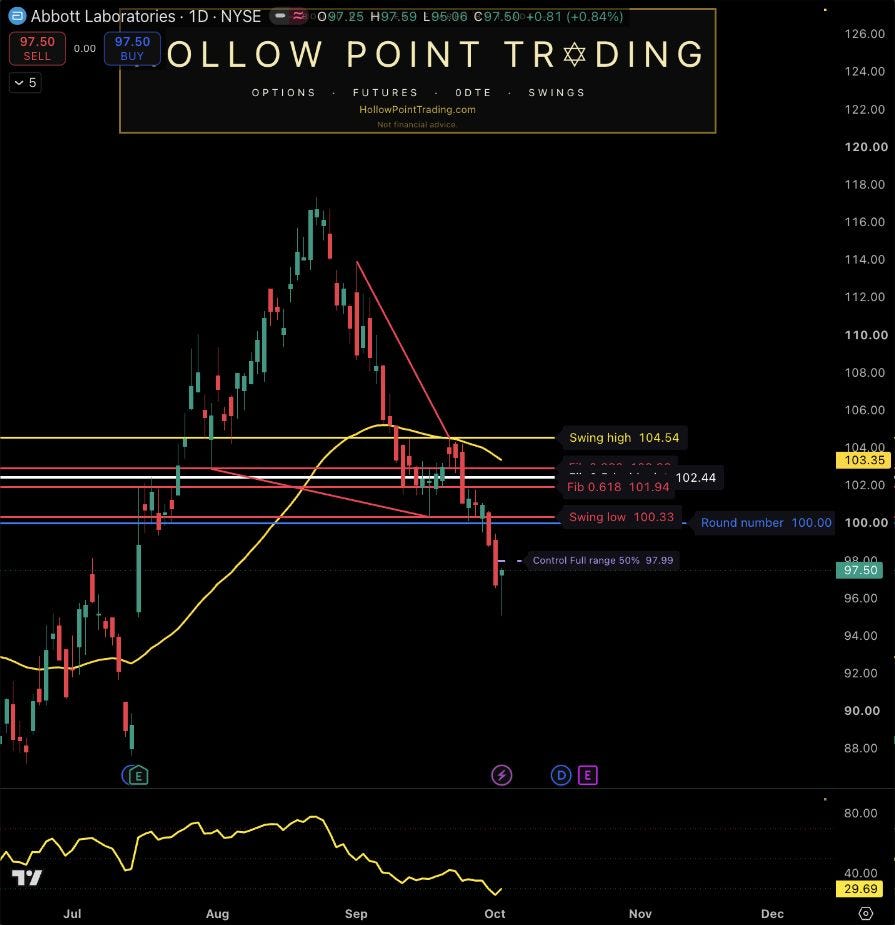
Source: TradingView, requested NYSE:ABT, observed BATS:ABT / NYSE by Cboe One, daily (1D). Captured October 3, 2026 at approximately 7:39 p.m. CT. Saturday equity market closed; latest completed candle October 2. Established EMA(55) $103.35; RSI(14) 29.69 is the only lower panel. June–October historical frame. $100 is a round-number reference; other displayed levels are historical observations. Static feed-specific image does not establish causation, live weekend pricing or executable trading terms.
Sources and discussion
Abbott’s September 30 SimpleScreen CRC launch release — product roles and stated screening scope
Abbott’s September 30 earnings announcement — October 21 results and 8 a.m. CT webcast
TradingView — newly captured publisher-owned ABT daily chart
Discussion: Which disclosed transition in Abbott’s screening completion funnel would most change your commercial outlook, and what evidence would you require before treating a $100 reclaim as durable?