Where might price stick?
Large positioning concentrations can act like decision zones. I mark them before the session, then watch how price actually behaves when it arrives.
 Member Login →
OPTIONS POSITIONING · LIVE MARKET MAP
Voltick maps the market’s largest options-positioning levels across SPX, SPY, QQQ and hundreds of additional tickers. The result is a live map designed to show where dealer hedging may create friction, acceleration, or a change in market character.
THE POINT IS ORIENTATION
Options positioning does not dictate a market’s future. It can, however, describe the conditions surrounding it. When hedging pressure concentrates around certain strikes, those zones can become useful reference points for understanding why price pauses, churns, or moves more freely.
Voltick turns that positioning into a named, repeatable map: the largest concentration, upper and lower walls, and the gamma flip—the line where the character of dealer hedging can change. Rather than a scatter of unexplained levels, the map gives every major area a role.
ONE MAP · THREE QUESTIONS
Large positioning concentrations can act like decision zones. I mark them before the session, then watch how price actually behaves when it arrives.
The gamma flip gives the map a regime boundary: above and below it, hedging dynamics can be meaningfully different.
0DTE and all-expiration positioning are different questions. The expiry grid helps keep today’s pressure distinct from the broader structure.
A SMALL VOCABULARY, USED CONSISTENTLY
Voltick’s naming convention matters because it turns a dense options surface into a concise discussion before, during and after the session.
The largest concentration in view—the level that deserves to be named, not buried in a table.
An upper positioning reference. I treat it as an area to observe, never a guaranteed ceiling.
The regime line. A sustained move through it is a reason to reassess the market’s operating conditions.
A lower positioning reference. It can be important context—not an automatic buy signal.
PUBLIC VOLTICK INTERFACE
Voltick’s public site describes its flow tape as showing qualifying options prints with details such as premium, strike, expiry, size, volume and open interest. The flow view sits alongside the broader map rather than acting as a disconnected list of unusual activity.
Visit Voltick to explore the live tools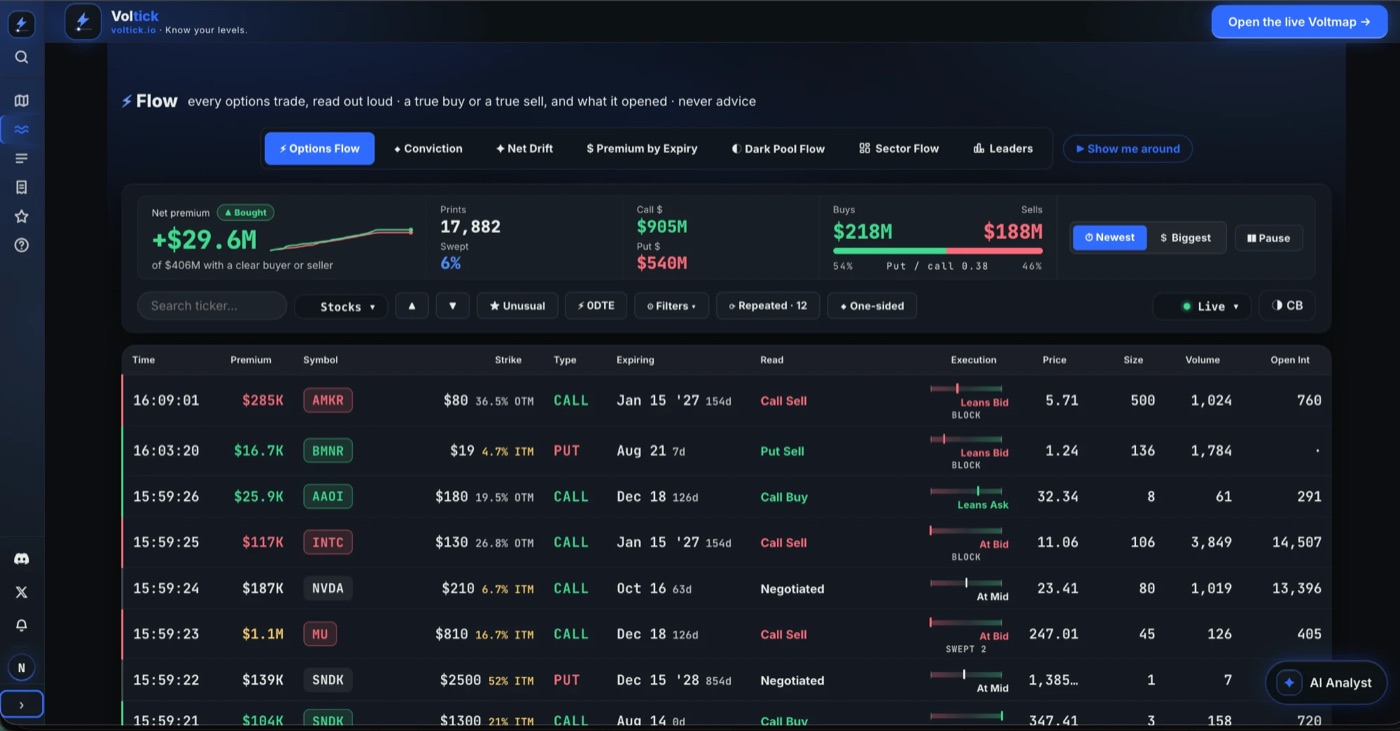
MORE THAN ONE SCREEN
Voltick publicly describes these tools as reading the same positioning picture from different angles: the map, live tape, chart and replay, scanning, alerts and AI-assisted explanation.
A positioning surface that places strikes beside expirations, then marks the largest areas of interest.
A tape for looking at meaningful options activity alongside the broader positioning map.
A way to return to the session and study how a planned map met actual price.
A faster way to locate boards pressing a notable level instead of hunting through a long watchlist.
A monitoring layer for when price approaches the areas that deserve a fresh look.
A research companion intended to make a complex map easier to interrogate—not to replace judgment.
PREP → OBSERVE → REVIEW
Voltick’s public approach includes an evening scorecard: its named levels are timestamped and sealed before the session outcome is known, then graded after the close with the misses still visible. That establishes a record that can be studied without rewriting history.
Voltick reads listed options positioning across strikes and expirations, then reduces it to a small set of named areas.
Live flow and price action can be viewed alongside the pre-session map, giving users a way to track what supports or weakens the original structure.
The gamma flip marks the transition point in Voltick’s framework: conditions on either side can call for a different read of the board.
Voltick timestamps and seals its named levels before the outcome, then publishes the after-close grade with the misses retained.
IMPORTANT CONTEXT
Gamma levels, flow, walls and flips are model-dependent market-context tools. They are not promises of direction, individual entries, price targets, stops, or personalized financial advice.
Voltick describes its product as decision-support intelligence. Its tools are designed to help users study positioning and price behavior, while the final judgment and risk decisions stay with the user.
Read Voltick’s FAQStart with the map. Watch what price does. Keep the record.
Explore Voltick