
CME Group’s October 8 international-volume release adds a geographic dimension to its record third quarter. Activity reported from outside the United States grew faster than consolidated activity. That is useful evidence of where participation expanded, but it leaves two different questions open: how concentrated that activity remains and how effectively the additional contracts convert into financial performance.
Hollow Point Trading research · October 9, 2026, after the U.S. regular cash close. Official releases were reviewed during preparation around 17:00 America/Chicago. The fresh genuine daily chart was exported at 17:03 CT. Third-quarter activity is a completed operating period; the June-quarter financial figures below are a historical baseline. Neither is a new earnings announcement today.
Macro — geographic reach changes the questions, not the direction of risk
An exchange can serve customers hedging different underlying exposures across time zones. Interest-rate uncertainty, currency translation, commodity procurement and equity-risk management can create reasons to transact. A higher contract count alone does not reveal whether customers became more optimistic, more defensive or more leveraged. Every transaction has counterparties, and trading activity is distinct from a directional vote on the stock market.
The international release reports Q3 non-U.S. average daily volume of 9.0 million contracts, up 22% year over year, against global ADV of 29.4 million, up 16%. Europe, the Middle East and Africa supplied 6.5 million, up 20%; Asia-Pacific supplied 2.1 million, up 28%. Canada and Latin America were much smaller at 194,000 and 188,000 respectively. These are contract counts assigned by reported trading location, not unique clients, customer assets or dollar risk transferred.
Using the rounded figures, non-U.S. activity was about 30.6% of global ADV, while EMEA supplied about 72.2% of the international total. Those calculations describe composition. They do not establish the share of revenue or profit generated abroad. Asia-Pacific’s faster percentage growth also begins from a smaller base. A large region growing more slowly can contribute more additional contracts than a smaller region with a faster percentage headline.
Geographic diversification may expand the opportunity to serve different hedging needs, but the data do not prove independence among regions. Global shocks can affect several markets at once. The next useful comparison is whether the activity mix remains broad through quieter periods as well as busy ones. One strong quarter cannot identify the permanence of a new participation pattern or show which macro event caused it.
Fundamental — the regional denominator and the revenue denominator differ
International energy volume rose 40%, agricultural volume 28% and equity-index volume 24%. That identifies areas of faster activity expansion without providing their exact contribution to earnings. Product families differ in contract size and transaction economics. Counting a smaller contract alongside a larger one is valid for an ADV series, but it does not make their notional exposure or fee revenue interchangeable.
The separate October 2 operating release reported September ADV of 31.8 million, up 22%, versus the Q3 average of 29.4 million. September’s international ADV was 9.7 million, up 25%. A strong final month can coexist with a different quarter-wide average. Compare like periods before describing an acceleration, and do not multiply a monthly daily average by the number of calendar days to invent quarterly transactions.
The June-quarter financial baseline reported $1.7 billion of revenue, $1.4 billion of clearing and transaction fees and $238 million of market-data revenue. Average revenue per contract was $0.678, compared with $0.690 a year earlier, while Q2 ADV was 29.8 million. These dated figures demonstrate why activity and monetization deserve separate columns; they are not a forecast of the third quarter.
Several mechanisms can affect the bridge. Product mix changes which fee schedules apply. Member status, trading venue, incentives and tiered pricing can alter realized economics. Market-data revenue follows another set of commercial relationships. Costs and investment then sit between revenue and earnings. More contracts can be constructive for the business while the percentage change in revenue differs substantially from the percentage change in activity.
The original research test is therefore geographic durability plus economic conversion. A constructive interpretation would gain support if later comparable disclosures show international participation holding a larger role and financial results demonstrate healthy monetization. A cautious interpretation would gain weight if the expansion concentrates in a few products or regions while realized economics deteriorate. Neither outcome can be inferred from the international growth headline alone.
EMEA concentration also matters when interpreting diversification. The current split shows meaningful reach beyond the United States, yet one broad region supplies most of the international contracts. A future release showing faster growth elsewhere would change the mix only to the extent that the smaller base becomes material. Follow the level, the growth rate and the denominator together rather than selecting whichever number sounds strongest.
Technical — Friday’s recovery is above the average, below a larger prior peak
The genuine CME daily export shows regular-session open $278.38, high $281.52, low $277.00 and close $280.56, up $4.12 or 1.49%. TradingView identifies the Nasdaq listing through its Cboe One feed, observed BATS:CME. The established 55 EMA is $269.48 and RSI(14) is 62.35 in the sole lower panel. The latest candle, legend and price scale agree. This is static post-close evidence rather than an executable after-hours quote.
The close sits $11.08 above the captured average, roughly 4.11% of that average. RSI is above its midpoint. Together those observations support a local recovery description. The wider chart still contains earlier peaks above the current price, so a rebound above the average does not establish a new all-time breakout. The volume release and the candle are separate observations; no causal claim about Friday’s move is made.
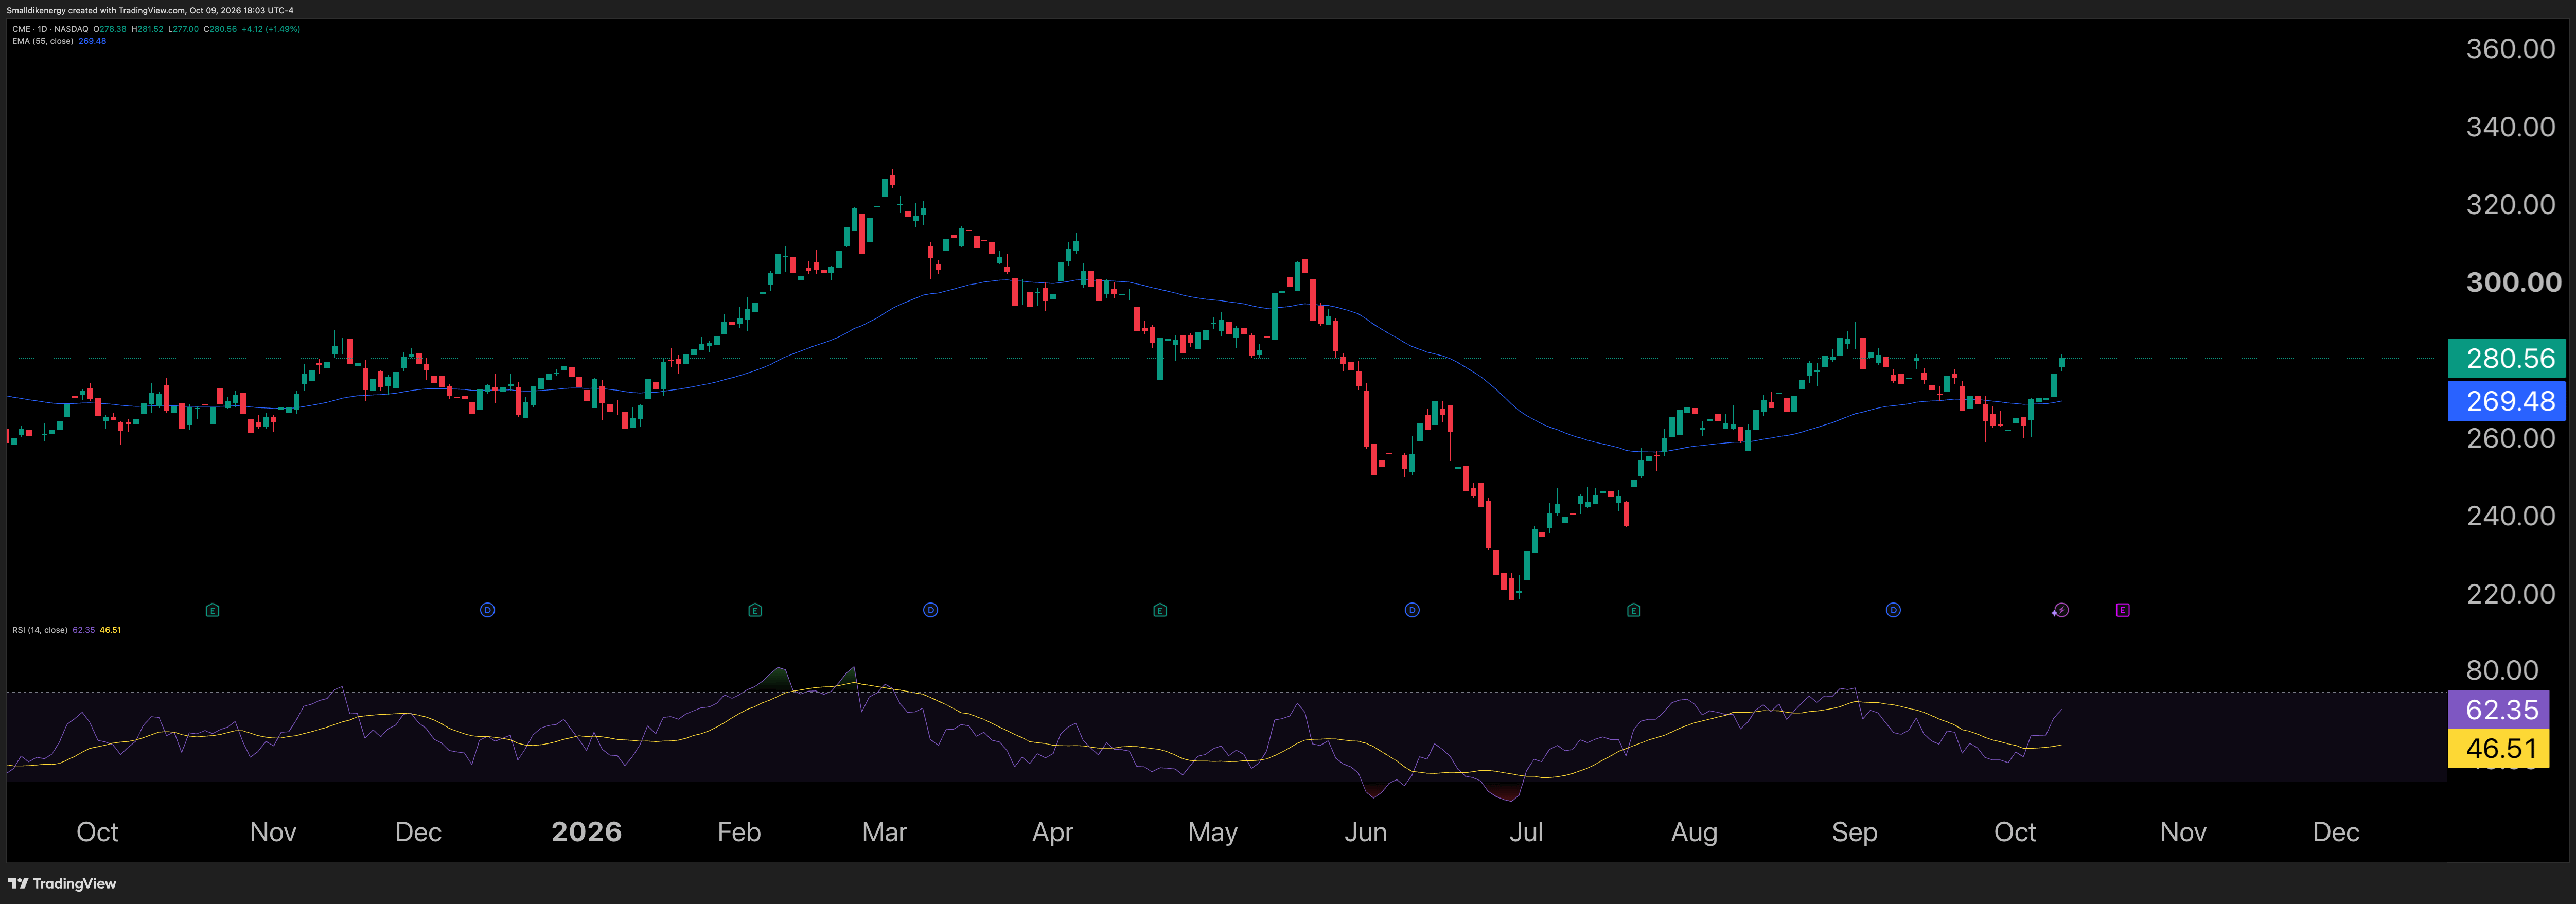
Genuine native TradingView CME 1D export · Nasdaq listing / observed BATS:CME Cboe One feed · October 9, 2026 at 17:03 America/Chicago. Regular-session O/H/L/C $278.38/$281.52/$277.00/$280.56; 55 EMA $269.48; RSI(14) 62.35 in the sole lower panel. Candle legend and price scale agree. Static post-close evidence, not an executable quote, revenue forecast or guaranteed outcome. Chart source: https://www.tradingview.com/chart/E48lP6dQ/
The continuation branch requires a completed daily move above $281.52 and subsequent evidence that a pullback can hold or reclaim that boundary. Acceptance back inside Friday’s range would weaken the breakout reading. A range branch keeps $277.00–$281.52 as the boundaries of this captured candle, without promoting them to independently proved multiweek support and resistance. The next completed bar supplies evidence; a brief intraday excursion supplies less.
The failure branch becomes more relevant if price loses $277.00 and cannot reclaim the range. A sustained recovery back inside it would challenge that interpretation. The captured $269.48 EMA is a farther, changing reference, not a promised destination or guaranteed support. These conditions organize what would change the view. They do not specify an order, position size or probability of profit.
Risk and the next evidence
The next financial report needs to reconcile transaction activity, realized pricing, market-data revenue and expenses. The next comparable operating release needs the regional bases as well as growth percentages. Competition, regulation, system resilience and technology investment can affect the business independently of contract counts. This framework sets disclosure tests without inventing a reporting date, earnings result or customer behavior.
Educational research only; no personalized investment advice, holding, order or fill is asserted. Financial results can differ from an operating-volume narrative, and price can gap through a static reference. A favorable chart does not prove a durable business change, while stronger geographic participation does not guarantee a favorable stock return. Update each claim with the evidence that actually addresses it.
Primary sources
CME · October 8 international Q3 volume and regional breakdown
CME · October 2 September and Q3 activity
CME · July 22 Q2 financial results and revenue per contract
CME · Q2 earnings commentary and pricing-mix mechanisms
Which would change your CME interpretation first: a less concentrated international activity mix, stronger realized contract economics, or sustained daily price acceptance above Friday’s high—and what evidence would invalidate it?