
Macro: volatility brings hedgers to the exchange, but contract count is only a first measure
U.S. regular equity trading is open for this 11:00 a.m. CT edition. Treasury yields, equity-index swings, energy prices and currency moves can all increase the need to transfer risk. CME Group operates the marketplace where many of those futures and options trade. Its October 2 activity release supplies a fresh catalyst: September average daily volume reached a record 31.8 million contracts, up 22% from a year earlier, and third-quarter ADV reached a record 29.4 million, up 16%. Those are completed trading-activity measurements, not the company’s yet-to-be-reported third-quarter revenue or profit.
The distinction matters because a single micro equity contract is not economically interchangeable with a Treasury option or an energy future. An exchange can gain volume while its blended fee per contract shifts with product mix, membership, venue and incentives. That is a better research question than assuming 16% more Q3 contracts mechanically means 16% more earnings. CME has scheduled its third-quarter results for October 21 before the open, with a release expected at 6:00 a.m. CT and a call at 7:30 a.m. CT. Until then, the revenue conversion is an inference to test, not a result to announce.
Fundamental: separate rate-risk demand from the fee it earns
The September release says interest-rate ADV rose 22% to 16.2 million contracts. Within it, U.S. Treasury futures and options ADV rose 42% to 9.5 million; ten-year Treasury Note futures averaged 2.6 million contracts, up 51%. Equity-index ADV rose 16% to 8.1 million, with Micro E-mini Nasdaq-100 futures up 73% to 2.4 million. Energy ADV rose 37% to 3.1 million. These categories show broad risk-management use, but the percentages have different bases. Their product counts should not be added to the exchange-wide ADV as though they were new customers or revenue dollars.
CME’s latest reported earnings quarter, the three months ended June 30, provides a revenue bridge. It reported $1.7 billion in revenue, $1.4 billion in clearing and transaction fees, and $238 million in market-data revenue. Q2 ADV was 29.8 million contracts, while the reported average rate per contract was $0.678. That blended rate was higher than Q1 2026’s $0.652 but lower than Q2 2025’s $0.690. Q2 revenue and rates are actual historical results; applying the $0.678 rate to September or all of Q3 would be an illustrative calculation, not CME’s reported Q3 result. Trading days, product weights and pricing can differ.
One encouraging second-quarter source of revenue was market data, up 20% to a record $238 million. It is not a per-contract clearing fee, so a proper October comparison should keep that line separate. The company also reported roughly $95 billion in daily margin efficiencies for customers during Q2. That is a capital-savings estimate for users of its clearing network, not CME’s own cash balance or quarterly sales. The teaching point is to follow a three-step bridge: contract volume, realized average rate, and revenue outside transaction fees. A constructive October report would convert record Q3 activity into stronger fee dollars without an offsetting mix deterioration, while maintaining data revenue. A weaker case would show a lower blended rate or cost growth consuming the volume benefit. Neither case has been reported yet.
Technical: an intraday rebound still needs a completed close above the middle band
The dedicated TradingView daily chart captured at about 11:04 a.m. CT displays an unfinished October 5 bar: a $264.67 open, $267.94 high, $260.35 low and about $267.05 indicated last value on its Cboe One/BATS feed. That last value is a snapshot, not a closing price or guaranteed fill. The established 55-day EMA sits near $268.58, above the indicated price. RSI, the only lower panel, is near 46.87. The stock is recovering from the $258.87 marked swing-low area, but the average and sub-50 momentum reading have not confirmed a repaired intermediate trend.
The nearest drawn references are $266.08, the $268.30 midpoint, and $270.53. A constructive setup needs the developing bar to finish above $268.30 and the 55 EMA, then hold that zone on a later daily retest; a move through $270.53 and eventually the $277.74 older swing high would be separate tests. The base case is rotation between roughly $258.87 and $270.53 while traders await the October 21 fee-rate evidence. A completed close below $258.87 that fails to recover it would invalidate the immediate repair thesis. A bearish continuation view would weaken if repeated closes clear the EMA and $270.53. A momentary intraday print cannot satisfy any completed-close condition. Earnings and macro headlines can gap through every drawn level, so risk size and exit planning must account for slippage. This is an educational scenario map, not a claim of an HPT position or a price target.
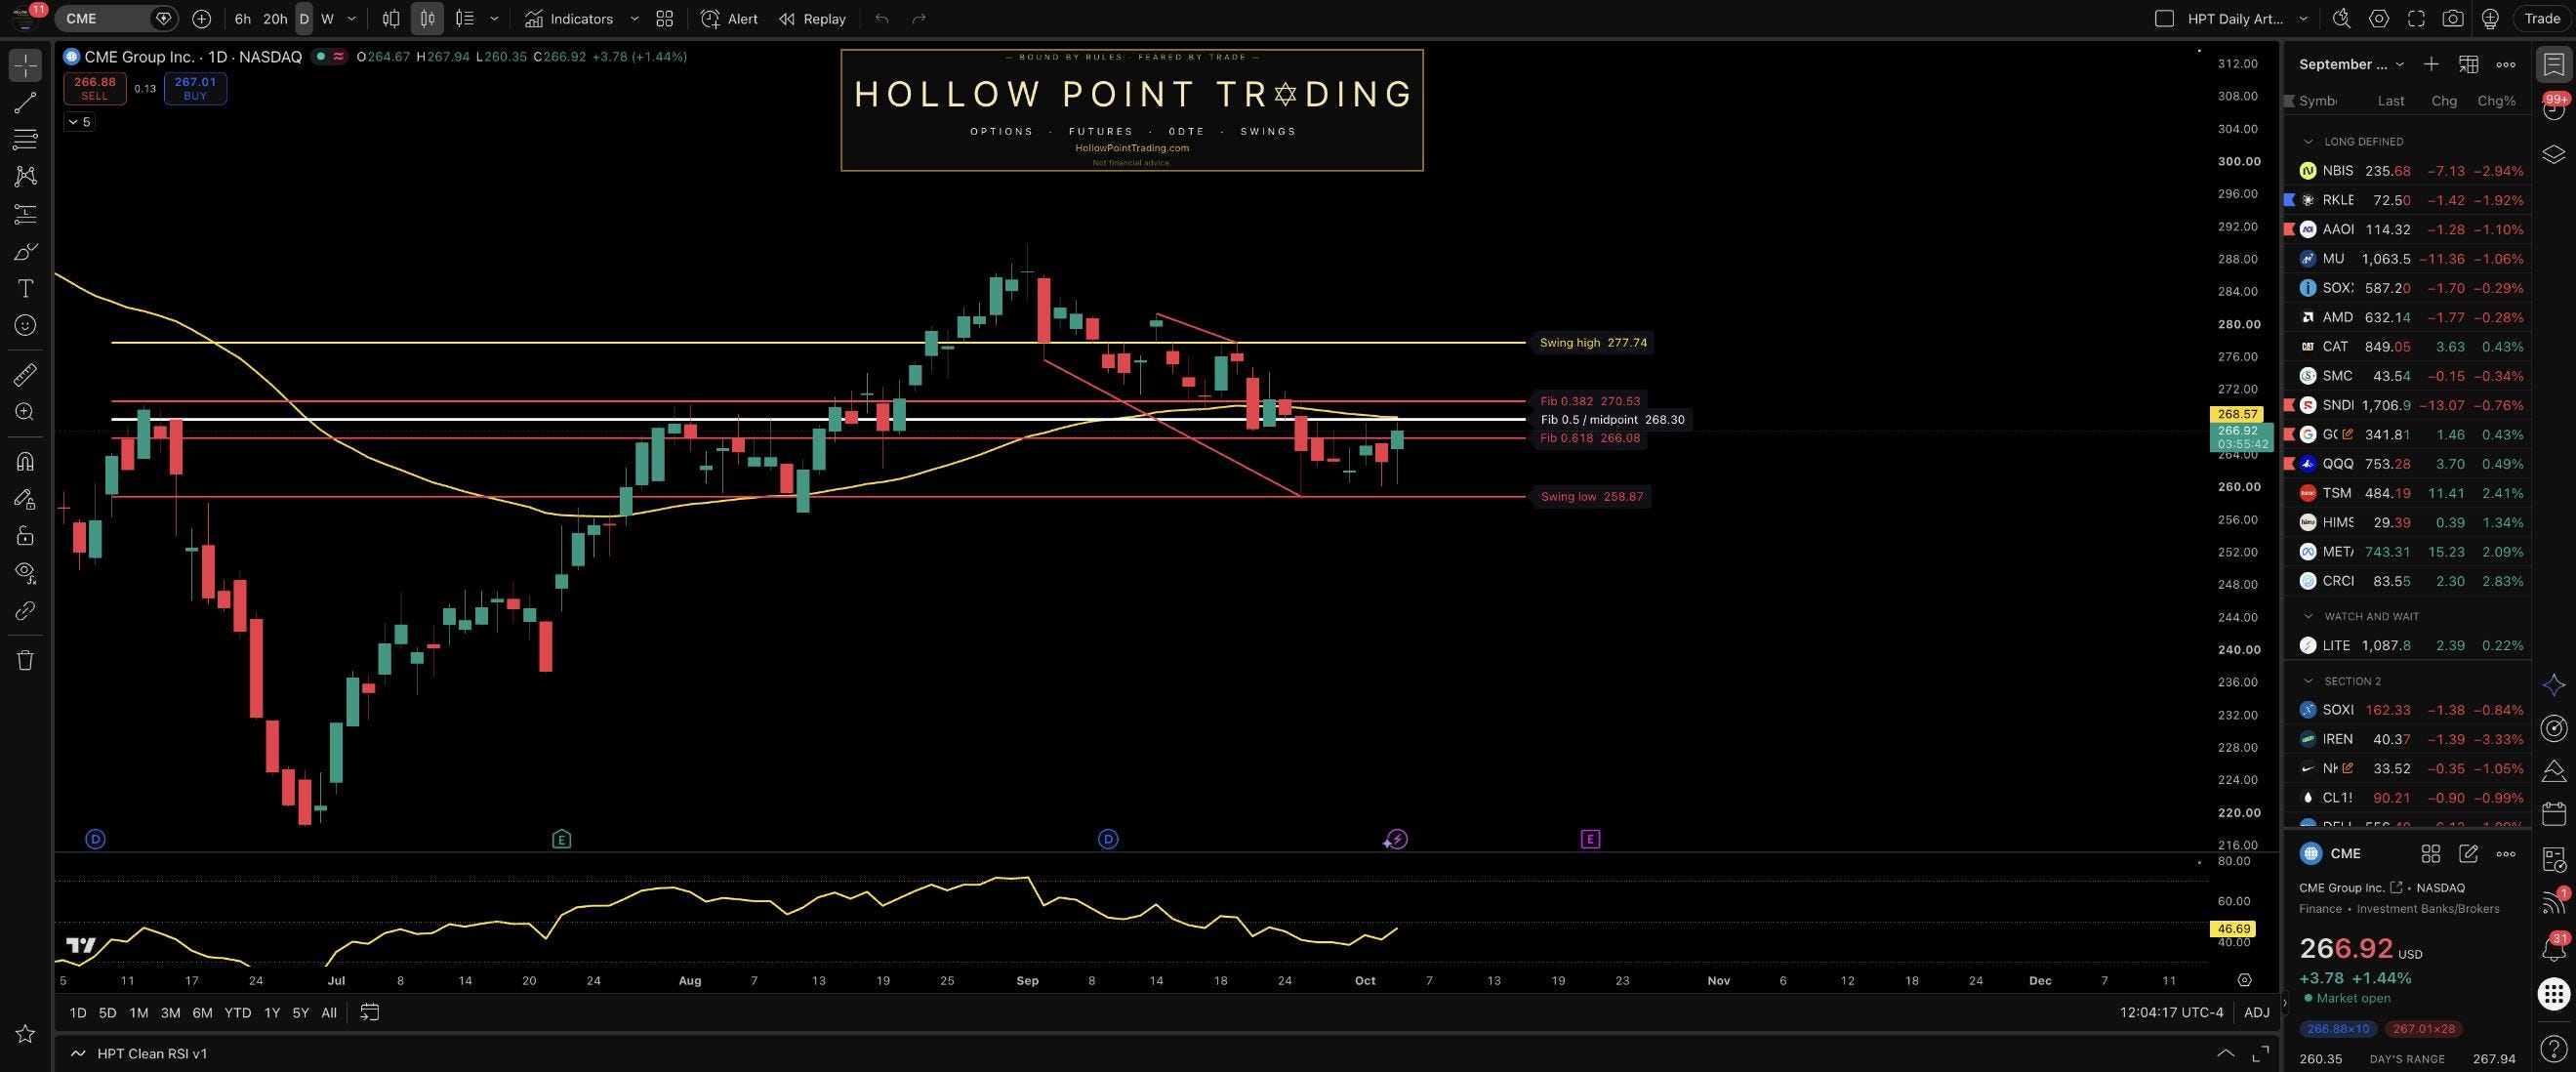
Source: TradingView NASDAQ:CME, dedicated HPT publisher tab; requested NASDAQ:CME, observed NASDAQ display with BATS:CME/Cboe One chart feed; 1-day timeframe; captured October 5, 2026 at about 11:04 a.m. CT. October 5 candle is unfinished. 55 EMA near $268.58 and RSI near 46.87 are visual readings; drawn levels and indicated price are static, feed-specific observations, not a future close, guaranteed execution or HPT trade.
Sources: CME September and Q3 volume release, October 2 · CME Q2 2026 earnings release · CME Q3 earnings schedule.
Educational research only. Futures, options and equities involve substantial risk. Historical volume and a static chart cannot predict a result or execution price; this is not personalized investment advice.
When CME reports on October 21, what mix of realized rate per contract, transaction-fee revenue and market-data growth would persuade you that record volume converted into durable economics, and which completed daily close would invalidate your chart case?