
A signed commitment has a schedule. A quarterly sale has a reporting period. Confusing those two clocks can turn a real business indicator into an exaggerated growth claim. Cisco’s remaining performance obligations offer a concrete way to practice keeping them separate.
This is Hollow Point Trading’s October 3, 2026, 1 p.m. Central edition, prepared after its scheduled slot. Saturday U.S. equity markets are closed. The fresh chart records the completed October 2 daily candle; it supplies no live weekend quote.
Macro: deployment budgets meet recognition schedules
Enterprise technology spending does not arrive in one uniform transaction. A customer can authorize a project, arrange a contract, receive equipment and consume services at different times. A provider’s disclosure can therefore contain both business already recognized and obligations that will be fulfilled later.
The economic mechanism worth examining is timing. Financing costs can influence a customer’s willingness to commit resources. Operational priorities can influence deployment speed. The provider must then deliver under the arrangement before the corresponding revenue can be recognized. These are analytical relationships, not evidence that a particular customer delayed a project this week.
A contracted pool can provide visibility into future activity, but visibility is not the same as immediate acceleration. Investors valuing that pool need to consider its duration, the work necessary to satisfy it and the profitability of that work. A longer schedule may make future revenue more visible while contributing less to the next quarter than an impatient interpretation assumes.
This framework leaves room for both optimism and caution. A company can have substantial commitments and still face questions about execution, mix and margins. Price can also anticipate an improvement before reported sales confirm it. The chart below cannot identify which expectation motivated Friday’s buyers, and this article does not assign that candle to an unverified macro headline.
Fundamental: deferred revenue sits inside RPO
Cisco’s fiscal 2026 Form 10-K reports $46.734 billion of remaining performance obligations at July 25: $29.781 billion of deferred revenue plus $16.953 billion of unbilled contract revenue. The latter covers noncancelable arrangements with work still owed and revenue not recognized, primarily subscriptions. Adding deferred revenue to the RPO total again would count the same component twice.
The filing expects approximately 49% of that pool to become revenue within twelve months, 39% in years one through three and 12% later. Those are management’s timing expectations at the reporting date. They are not quarterly realized sales, a cash balance or a promise that the whole pool will appear in next year’s income statement.
The teaching point: inventory of obligations versus flow of sales
Use a waiting-room analogy carefully. RPO describes work that has been committed but remains to be performed. Revenue describes activity recognized during a particular period. A waiting room can grow because more work enters, because work takes longer to complete, or through a combination. Its size alone does not establish how fast recognized sales are growing.
Imagine a fictional supplier with a pool of 100 contract units. It expects to recognize 40 in the next year and 60 later. A reader treating the full 100 as next-year sales would compress several years into one. A reader adding a deferred component already included in that 100 would also inflate the pool. These invented units illustrate the error; they are not estimates of Cisco’s future results.
A useful research worksheet therefore separates the reporting date, the aggregate obligation, its component categories and its expected conversion horizon. It leaves a different row for revenue actually recognized in each subsequent period. The worksheet does not force a forecast from one subtotal. It gives the reader a way to test how new evidence changes the original expectations.
Duration also affects comparisons. Two companies with equally large pools may have different conversion schedules and contract economics. Comparing their totals without examining those schedules can hide the distinction between near-term activity and a much longer stream. Even within one company, shifts in contract mix can change the meaning of an aggregate comparison.
The FY2027 outlook is the next conversion test
Cisco’s August 12 earnings release gives first-quarter fiscal 2027 revenue guidance of $18.0 billion to $18.2 billion and full-year guidance of $72.2 billion to $73.4 billion. These are outlook ranges, not achieved results. The catalyst for this review is the transition from the July contract snapshot into the company’s new fiscal-year guidance.
As subsequent disclosures arrive, compare the new revenue evidence and updated contract timing with the earlier outlook. Keep changes in the pool beside management’s explanation rather than inferring conversion from the stock price. This article does not invent a future earnings date or assume a first-quarter outcome.
Technical: a local reclaim is visible; the older peak remains overhead
The October 2 daily candle on the fresh Cisco chart opened at $109.83, reached $112.23, traded down to $109.00 and closed at $112.20. The captured feed shows a close-to-close gain of $3.44, or 3.16%. The established 55 EMA is $110.64. RSI(14), the only lower panel, reads 57.23.
The chart frames June through early October, with particular attention to September’s local base. The selected swing references are $111.50 above that base and $104.51 below it. Friday closed above the selected swing high and above the moving average. That is a local reclaim; the August candles near $124 remain visibly higher. Clearing the smaller reference does not establish a completed recovery of the entire summer decline.
RSI back above 50 is consistent with improving recent momentum on this timeframe. It cannot tell us how quickly contracts will convert, nor does it make a new entry attractive at any price. The small distance between Friday’s close and high creates one immediate test, while a return into the prior base would create a different one.
Next-session cases: acceptance, pause and rejection
Acceptance: holding above $111.50 and subsequently clearing $112.23 with a sustained retest would strengthen the local reclaim. A brief wick above Friday’s high that returns underneath would weaken that specific breakout claim. The older August peak is context, not an automatic next target.
Pause: trading around $111.50 and the updated 55 EMA would put the reclaimed boundary under examination. The current $110.64 average changes as new daily bars arrive. A sideways pause can preserve a recovery, but that outcome must be observed rather than assumed from the contract pool.
Rejection: losing $109.00 and failing to reclaim it would invalidate a near-term thesis built around Friday’s low holding. The chart’s $108.83, $108.01 and $107.18 retracement lines then offer lower observation references. A sustained break beneath $104.51 would challenge the selected September base itself. These marks depend on the chosen swing anchors and are not guaranteed support.
Risk: contract visibility does not settle execution
Reopening gaps can cross a planned price boundary before an orderly retest develops. Earnings can change expectations about delivery and profitability. Options add spread, volatility and time-decay exposures that this daily chart does not measure. No executed position, realized performance or prescribed position size is asserted.
The discipline is to let the business disclosure answer the duration question and let fresh price evidence answer the setup question. A large contract pool and a strong daily candle can coexist without proving one another. This is educational research, with scenarios that remain conditional on new evidence.
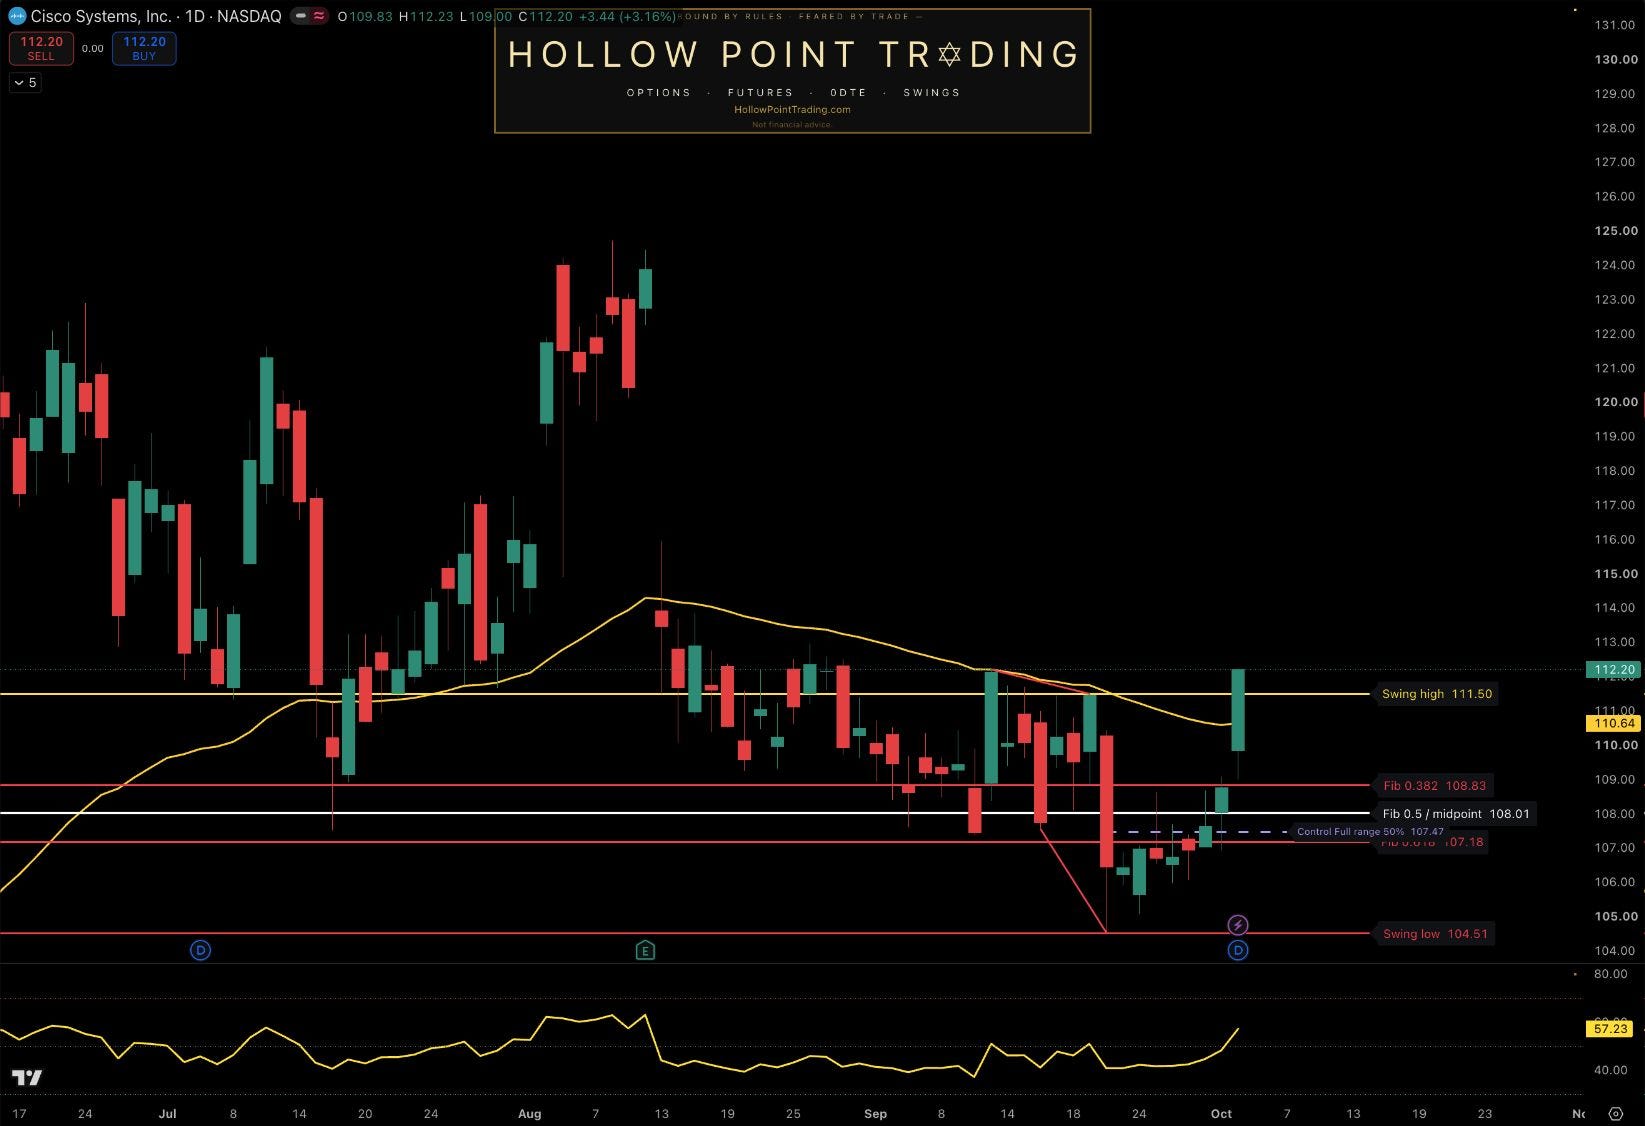
Source: genuine TradingView publisher-owned chart; requested NASDAQ:CSCO, observed BATS:CSCO / NASDAQ by Cboe One, daily (1D). Captured October 3, 2026 at approximately 1:08 p.m. America/Chicago. Saturday equities closed; completed October 2 candle. Established 55 EMA $110.64; RSI(14) 57.23 is the sole lower panel. Direct chart-region screenshot with physical capture bounds verified. Static historical, feed-specific image; selected anchors and later bars change levels and indicators. No live weekend price or guaranteed execution.
Sources and evidence limits
Cisco fiscal 2026 Form 10-K — Note 7 contract timing
Cisco fiscal 2026 earnings release and FY2027 guidance — August 12
Contract balances are historical reported amounts. Recognition timing and revenue outlook are management expectations. The fictional waiting-room exercise is a teaching illustration; next-session price scenarios are inference. No fiscal 2027 result is assumed.
Discussion: What conversion evidence would make Cisco’s contract pool more convincing to you, and which price failure would overturn the local $111.50 reclaim?