
Friday’s market offers an uncomfortable combination: broad equity indexes are higher and option-implied volatility is lower, while a fresh consumer survey points to weaker current conditions and slightly higher inflation expectations. The useful question is whether price relief can broaden and hold while the spending backdrop remains unsettled. One favorable risk gauge cannot answer every economic question.
Hollow Point Trading research · October 9, 2026, regular U.S. cash session. The delayed equity board was checked at about 13:29 America/Chicago; the rates and continuous-commodity overview around 13:27. The genuine daily volatility chart was exported at 13:29:43. These are asynchronous intraday observations, not settlement prices or an event study of the survey release.
Macro — broad gains leave a mixed participation test
The selected delayed equity board showed the S&P 500 at 7,811.54, up 0.59%; the Nasdaq-100 at 30,876.06, up 0.49%; and the Dow industrials at 51,674.50, up 0.86%. The S&P 400 midcap index was up 0.69%. That establishes a positive direction across several groups at the observation time, without establishing the eventual close or the number of advancing stocks.
The completion index gained 0.87%, and gold-and-silver miners gained 3.09%. Semiconductors fell 0.49% and housing fell 1.11%. These index returns are participation proxies, not exchange breadth counts. The semiconductor and housing declines matter because a positive broad index can conceal groups that have not joined the move. Miner strength also combines commodity exposure with business and equity risks; it is not a direct measure of physical gold buying.
The market overview displayed a two-year yield of 4.797% and a ten-year yield of 5.248%, an arithmetic spread of 45.1 basis points. Continuous WTI futures showed $91.74 per barrel, up 0.27%, and continuous gold futures showed $4,221.9 per ounce, up 1.56%. Displayed yields are not the official end-of-day Treasury par curve, and continuous contracts can roll. Different feeds and timestamps prevent treating the board as one simultaneous executable portfolio.
The inference is restrained: relief in the broad equity and volatility readings coexists with uneven sector returns and higher commodity references. The survey supplies a new economic concern to monitor, but these observations do not prove that the survey caused any quoted move. A causal claim would require a timed before-and-after comparison and controls for other information. This edition does not measure investor flows or identify who bought the advance.
Fundamental — the new survey and the volatility index ask different questions
The University of Michigan’s October preliminary results show sentiment at 46.3 versus September’s 48.1, current conditions at 44.7 versus 50.9, and expectations at 47.3 versus 46.3. Year-ahead inflation expectations rose to 4.7% from 4.6%; long-run expectations rose to 3.5% from 3.4%. The official page identifies October 23 at 10 a.m. Eastern as the next release. These are preliminary survey results, not realized inflation or a spending forecast.
HPT arithmetic puts the current-conditions decline at 6.2 index points, compared with a 1.8-point sentiment decline and a 1.0-point expectations increase. Each inflation-expectation change is 0.1 percentage point. That pattern deserves more attention than collapsing every survey component into one negative headline. Current assessments weakened much more than forward expectations, which actually improved on the index comparison. It is still possible for consumers to describe current pressure while expressing a different view of the future.
For businesses, the channel to investigate is the gap between customer willingness to spend, actual transaction volumes, selling prices and financing costs. A survey can suggest questions about that gap, but it cannot disclose a particular company’s sales or margin. The housing index’s weakness is consistent with a cautious spending and borrowing-cost discussion; consistency does not establish that surveyed households caused that sector’s decline. Future operating disclosures and observed spending remain separate evidence.
Cboe describes the volatility index as a measure of expected near-term S&P 500 volatility derived from option prices, with a 30-day horizon. It does not forecast whether stocks will rise or fall, and the index itself is not directly tradable. A decline therefore records a change in this option-implied risk measure, rather than a vote that the economy is healthy. The survey and the index also cover different populations, horizons and units.
This distinction is the core research point. There is no contradiction that must be forced away when option-implied volatility eases while inflation expectations edge higher. Prices may absorb one concern while responding to many others. To upgrade the relief case, look for broader participation and sustained price acceptance. To upgrade the economic concern into an operating conclusion, seek corroborating spending, financing and company evidence. Neither investigation is completed by the other measure’s direction.
Technical — the daily volatility structure remains below its average
The genuine TradingView CBOE_DLY:VIX daily candlestick export shows open 15.34, high 15.34, low 14.82 and captured latest value 14.83, down 0.58 points or 3.76%. The established 55 EMA is 15.91, with RSI(14) at 45.36 in the sole lower panel. The exported candle legend and right-hand scale agree. The October 9 bar is unfinished, and the feed is delayed; these references can change before the close.
The visible year-to-date structure includes much larger earlier volatility spikes, followed by repeated returns toward the mid-teens. The current capture sits below the daily average with momentum below the RSI midpoint. That supports a lower-volatility description at this time. It does not establish a floor, remove gap risk or make short-dated options cheap for every strike and expiry. An aggregate index cannot price an individual option trade.
Relief branch: sustained trade below the captured 14.82 low, accompanied by broader equity participation, would strengthen the easing-volatility reading. A return above that boundary challenges the immediate continuation premise. Because the captured value is close to the low, a single tick below it is weak confirmation; subsequent acceptance and comparable completed observations matter more than labeling an intraday touch a breakout.
Stress branch: a sustained reclaim of the captured 15.34 open and high would challenge the day’s relief. The dynamic average near the captured 15.91 is a farther test. Acceptance above both would supply stronger evidence of renewed volatility pressure, especially if equity participation deteriorates. Failure back inside the observed range would weaken that branch. These are conditional index references, not orders, guaranteed resistance or an instruction to trade a futures contract at the same number.
Unresolved branch: the index remains between 14.82 and 15.34 while sector returns stay mixed. That does not require an immediate directional trade. The next useful checkpoint is Friday’s completed daily evidence across the index and the broad market, followed by the October 23 survey update. Keep the statistical release clock, the delayed quote clock and the chosen trading instrument separate.
Risk and the next evidence test
A lower volatility index does not cap a portfolio’s loss. Futures, options and volatility-linked products have their own term structure, leverage, settlement and path risks; their returns need not match the spot index’s percentage change. Survey estimates can be revised. This is educational research, with no claimed position, fill, personalized allocation or guaranteed outcome. Any real decision requires current instrument-specific evidence and a defined risk plan.
The practical task is to ask what would change the interpretation. Broader equity gains and a held lower-volatility structure would strengthen relief. A failed equity advance and a sustained volatility reclaim would challenge it. A later survey or operating update can change the economic assessment independently. Keeping those tests explicit makes the cross-market comparison useful without turning a mixed snapshot into a confident causal story.
Sources and supporting evidence
University of Michigan Surveys of Consumers · October preliminary release and official logo, checked October 9
Cboe · official volatility index description and product distinctions
TradingView · U.S. delayed index board observed October 9 around 13:29 CT
TradingView · rates and continuous commodity overview checked around 13:27 CT
TradingView · genuine Cboe volatility daily chartThe first panel separates option-implied relief from consumer inflation expectations.
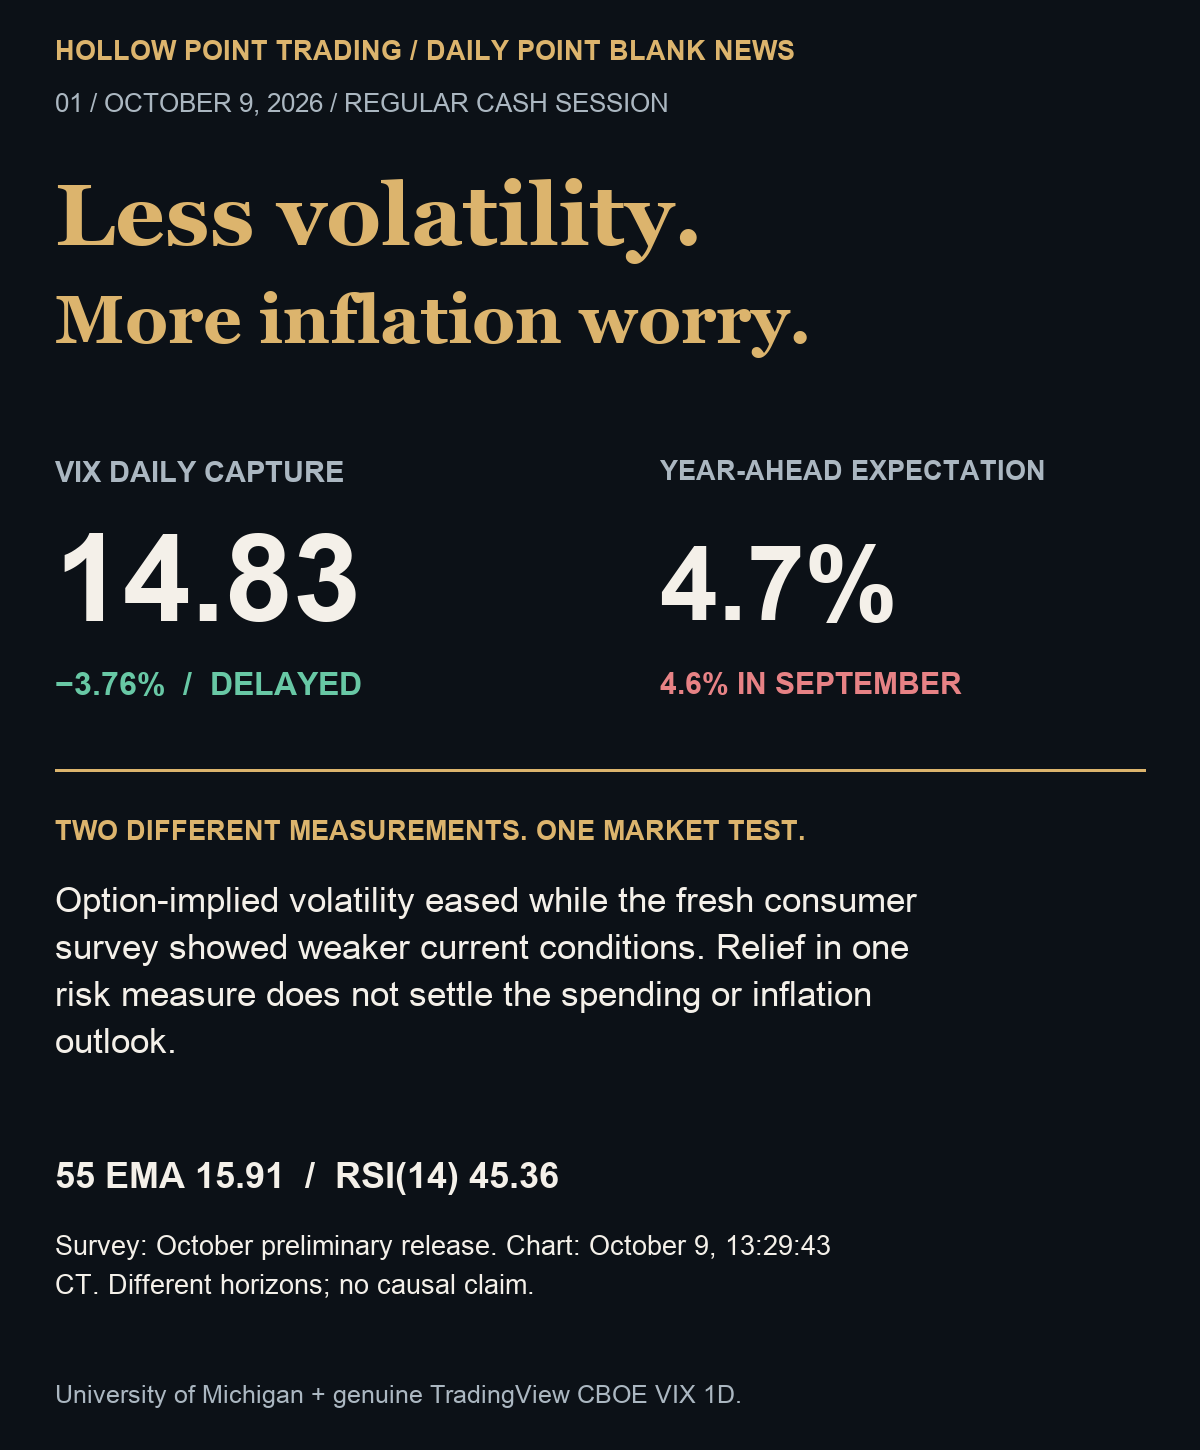
HPT original comparison panel. University of Michigan October 2026 preliminary year-ahead inflation expectation 4.7% versus September 4.6%; genuine TradingView CBOE_DLY:VIX 1D export October 9 at 13:29:43 America/Chicago, captured 14.83, down 3.76%. Different horizons and units; no causal or settlement claim.
The survey comparison and wider market board preserve the different units and observation clocks
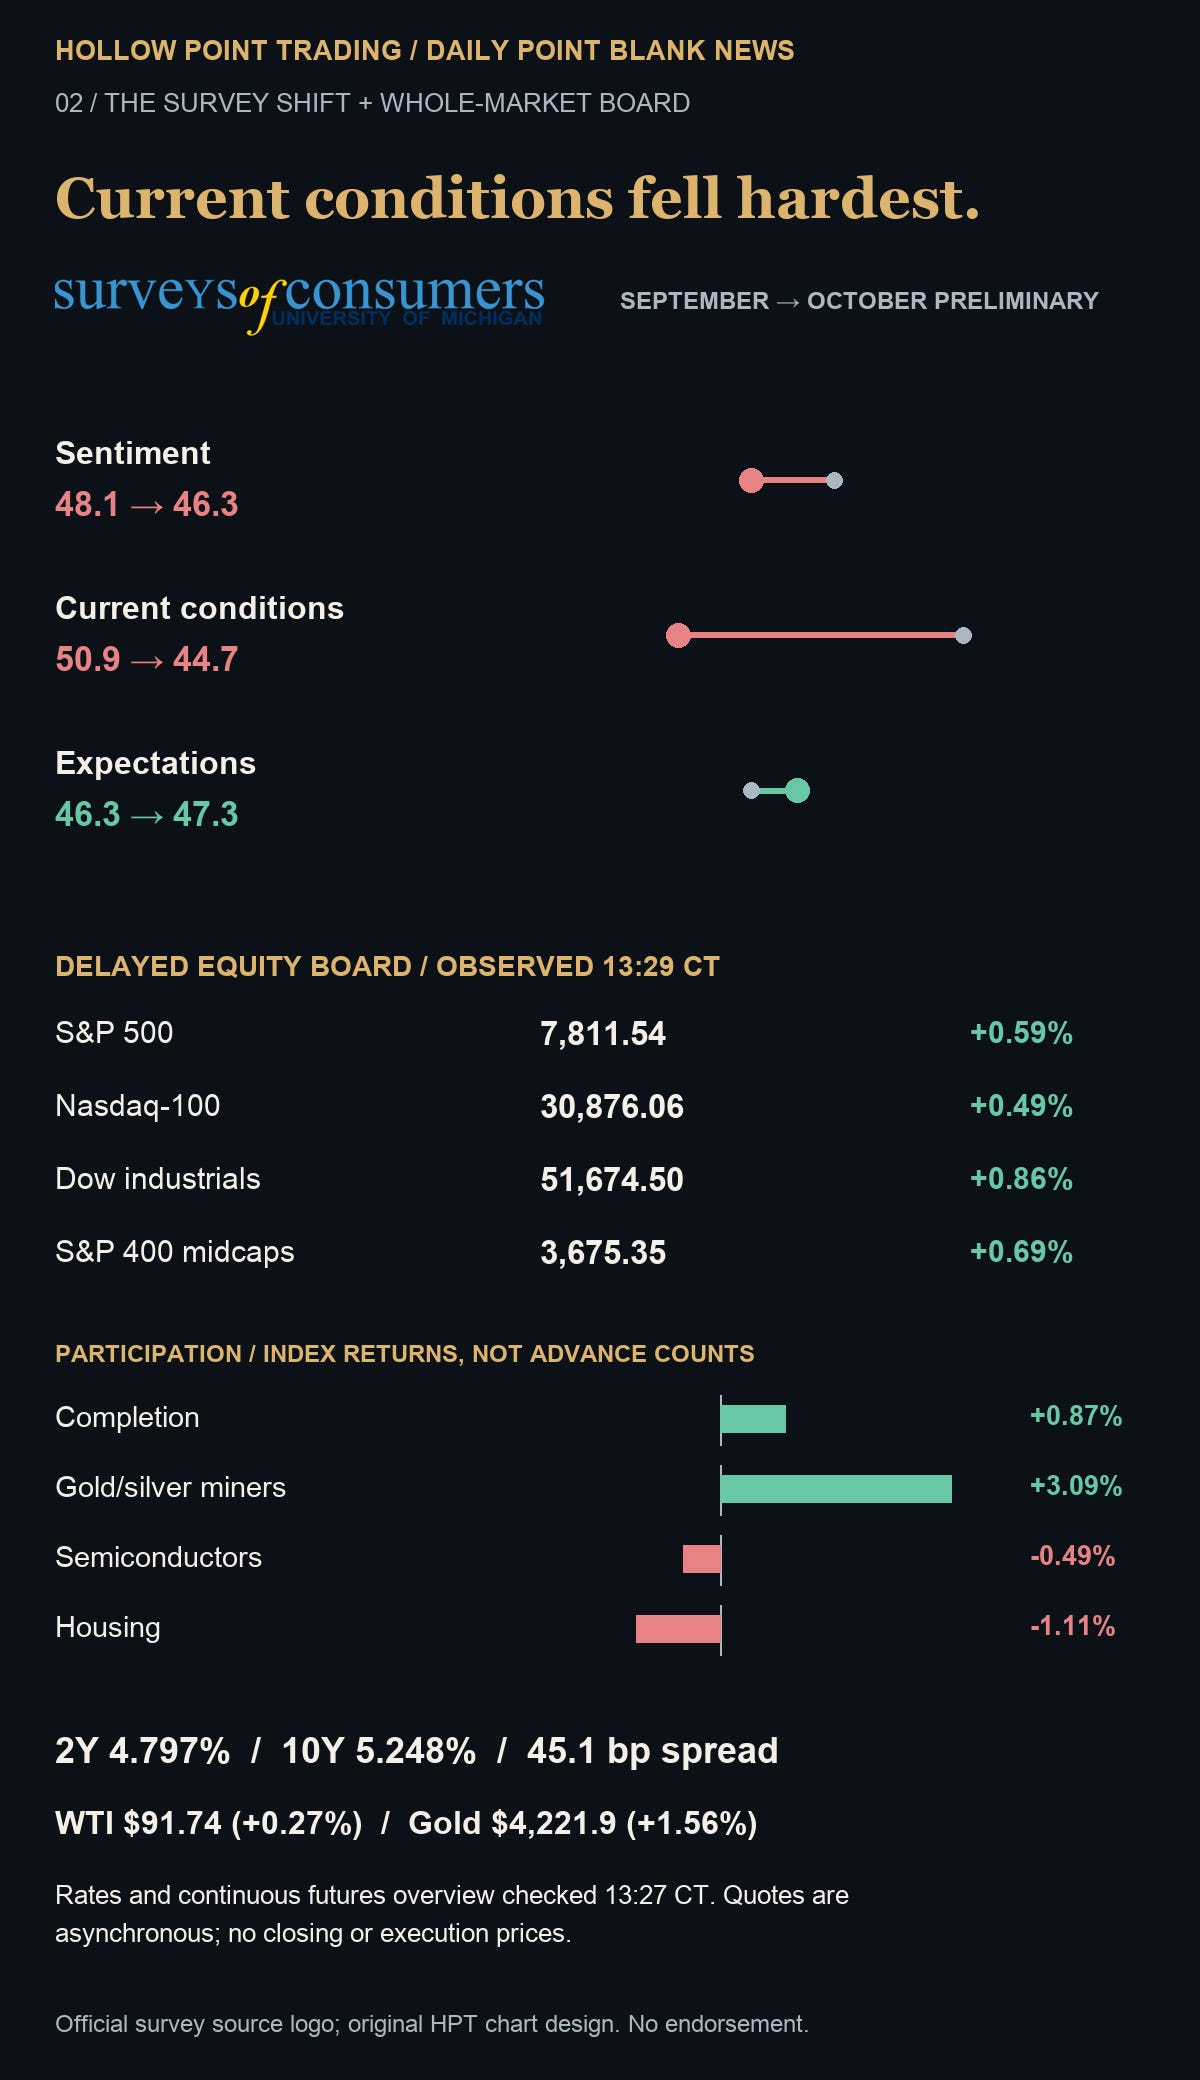
HPT original survey comparison and whole-market board with official University of Michigan Surveys of Consumers source logo, no endorsement. October preliminary survey versus September; TradingView delayed equity board observed October 9 about 13:29 and rates/continuous futures about 13:27 America/Chicago. Index returns are participation proxies, not advance counts; all observations are asynchronous.
The conditional map identifies what would support relief, leave it unresolved or challenge it
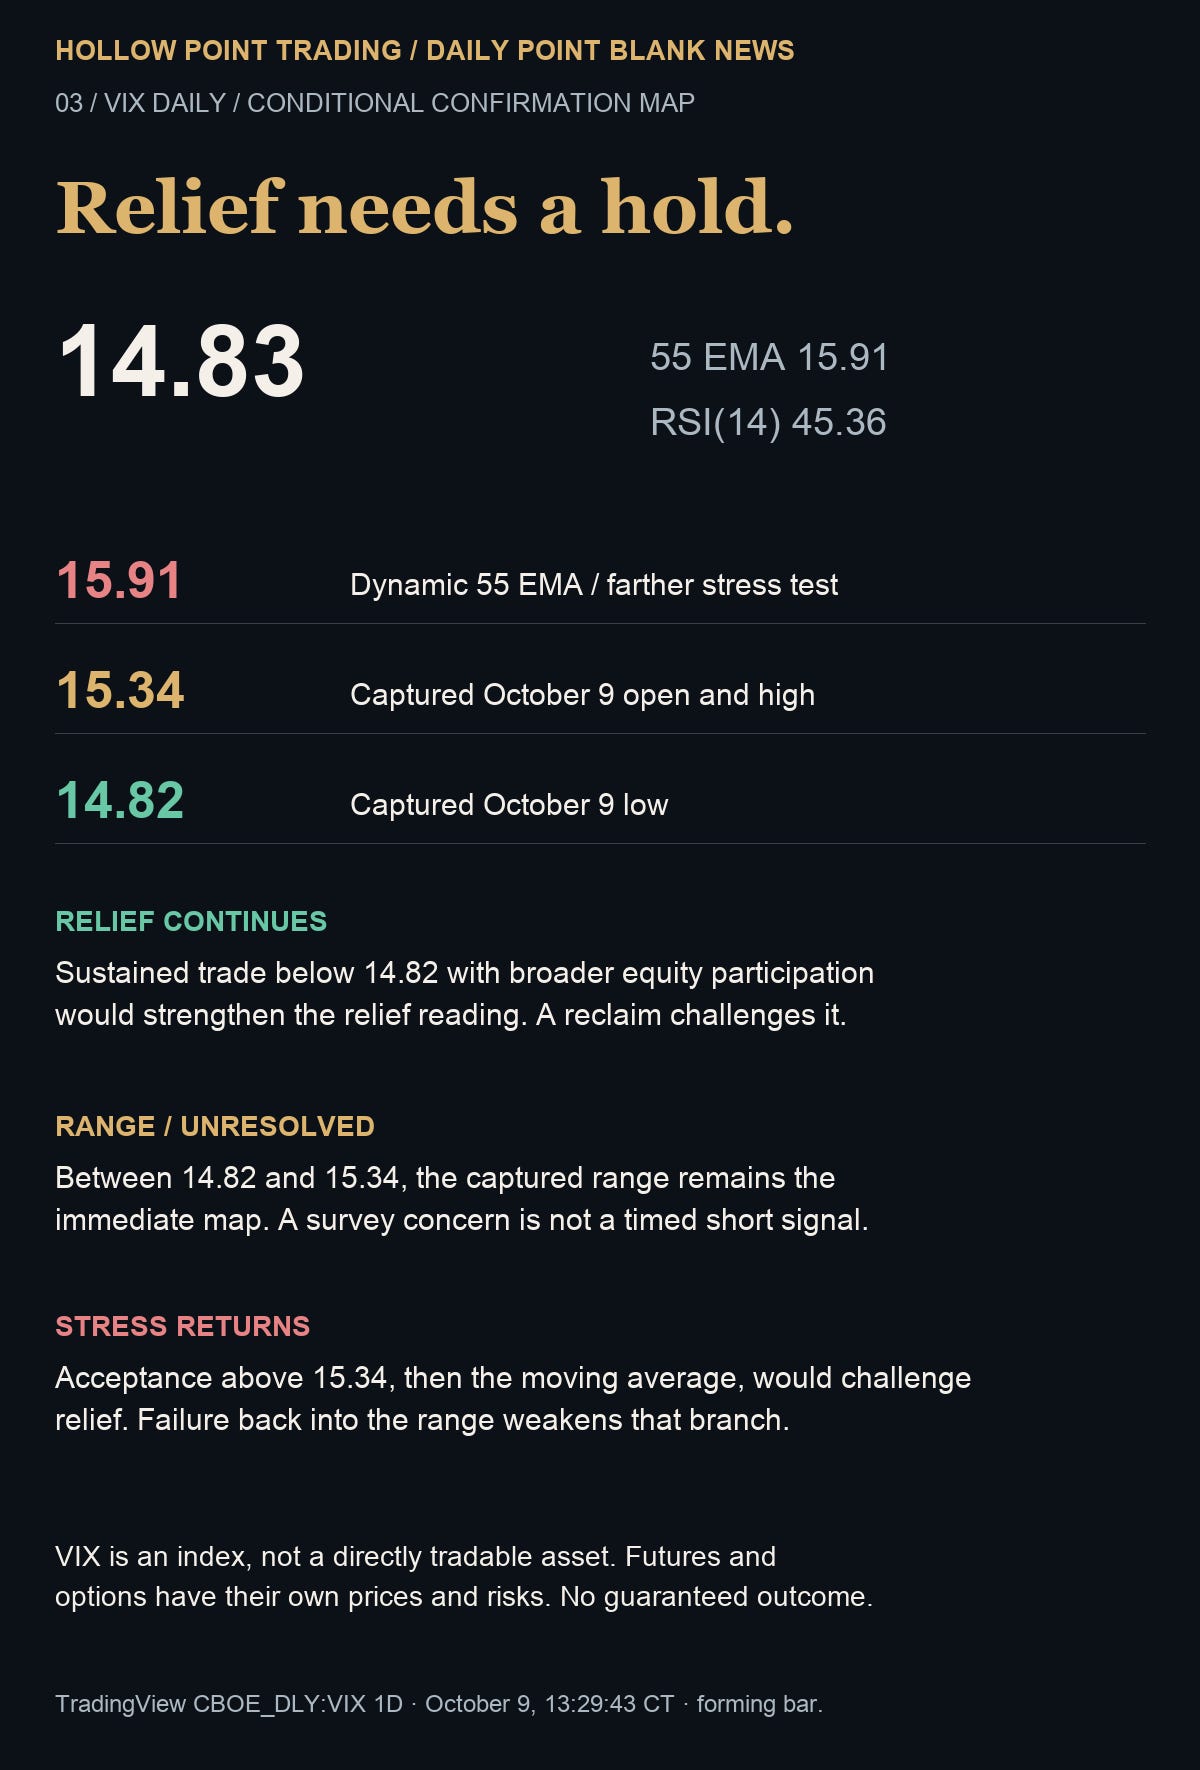
HPT original conditional VIX map. Genuine TradingView CBOE_DLY:VIX 1D capture October 9, 2026 at 13:29:43 America/Chicago: low14.82, open/high15.34, EMA55 15.91, RSI14 45.36. Forming delayed daily index bar; references are conditional and do not guarantee direction or an execution price.
The genuine daily chart shows the history, established average and momentum behind the scenario references
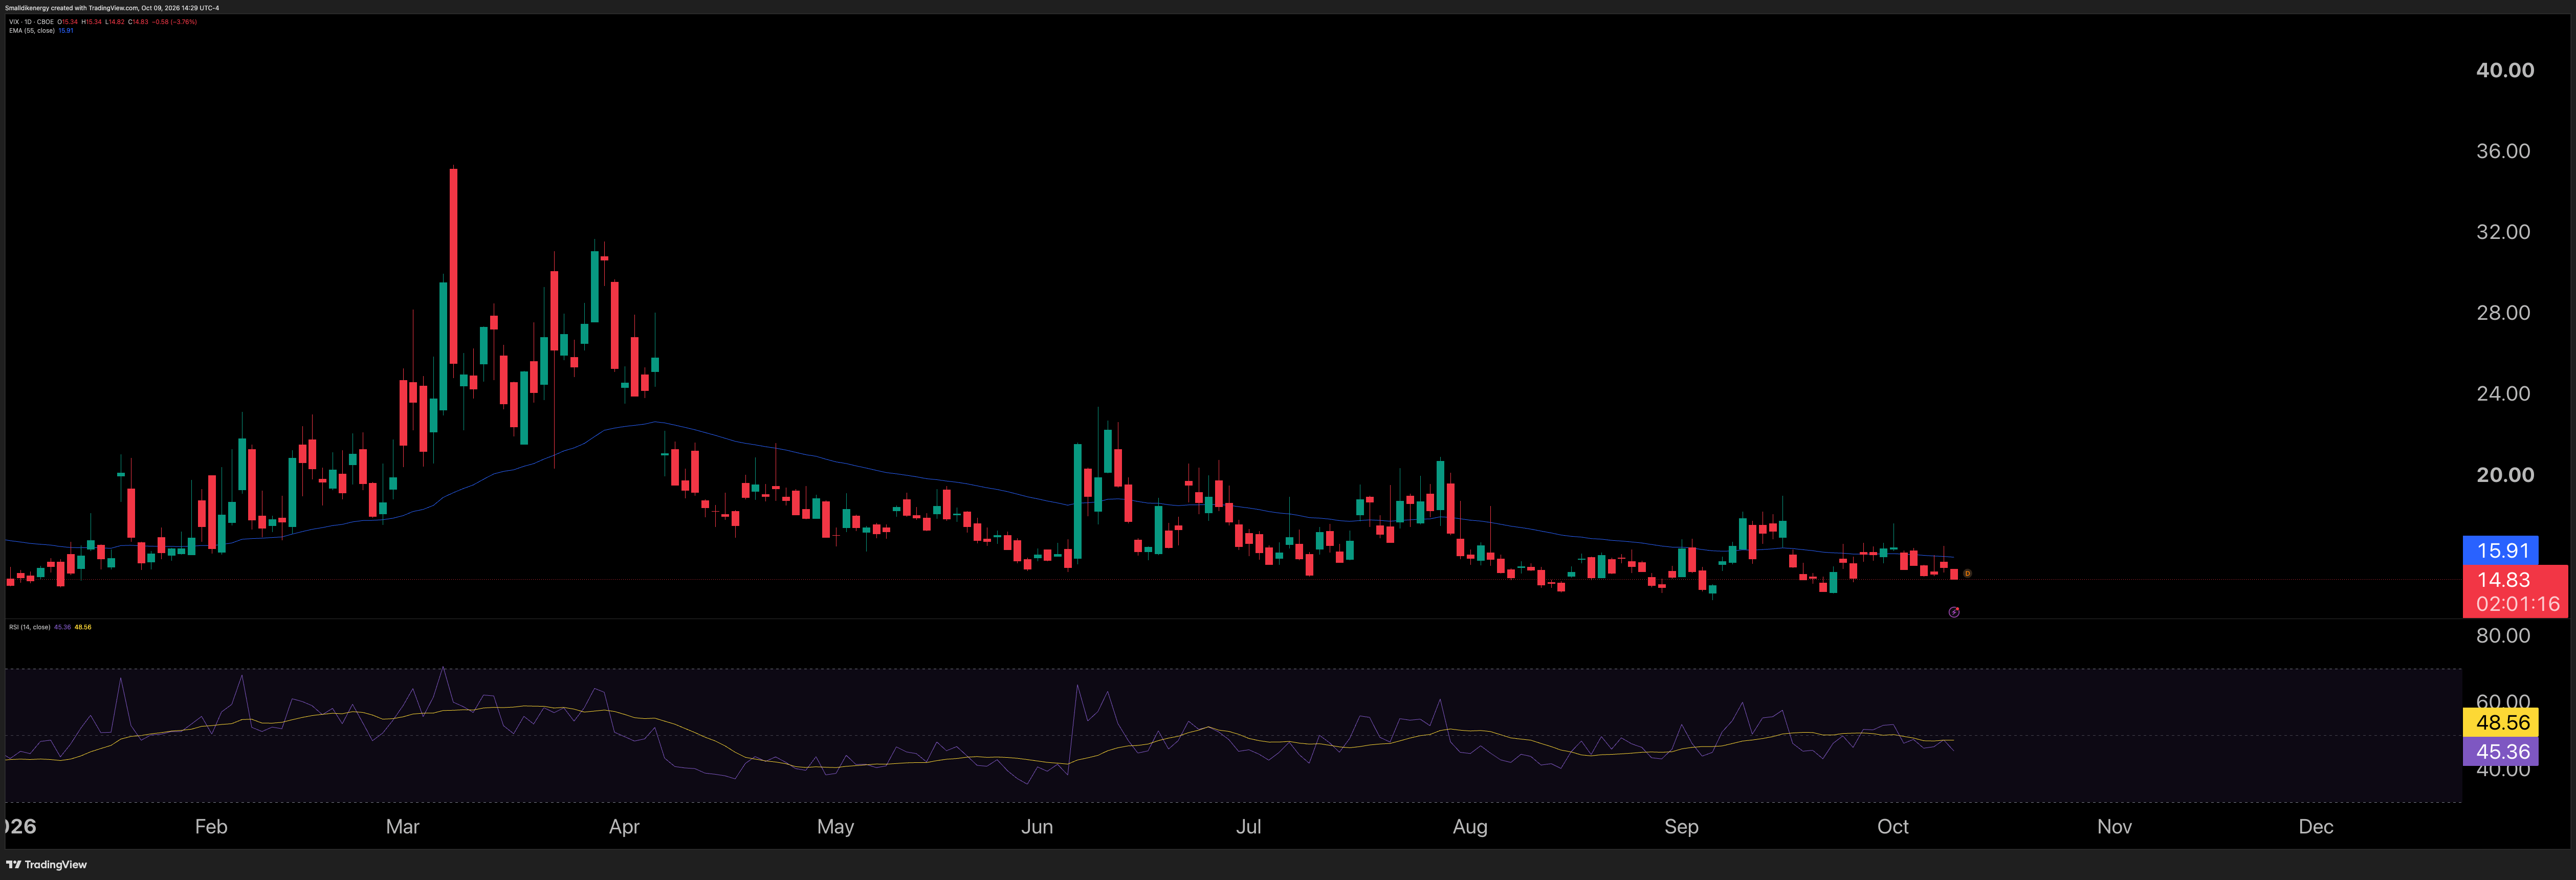
Genuine native TradingView CBOE_DLY:VIX 1D candlestick export October 9, 2026 at 13:29:43 America/Chicago. Delayed forming regular-session bar O15.34 H15.34 L14.82 latest14.83, EMA55 15.91, RSI14 45.36 in the sole lower panel. Candles, legend and scale agree. Spot index, not a directly tradable asset or completed daily close.
Which would change your interpretation first: broader equity participation, a sustained volatility reclaim, or corroborating consumer-spending evidence—and what would invalidate your view?