
Friday’s broad equity rebound and the Federal Reserve’s new household survey ask different questions. A rising market can lift asset values, but a higher balance sheet does not automatically finance the next purchase. Today’s 2025 Survey of Consumer Finances release supplies a reason to examine the distribution of financial capacity rather than convert a wealth headline into a spending forecast.
The household panel separates accumulated wealth from debt-payment strain.
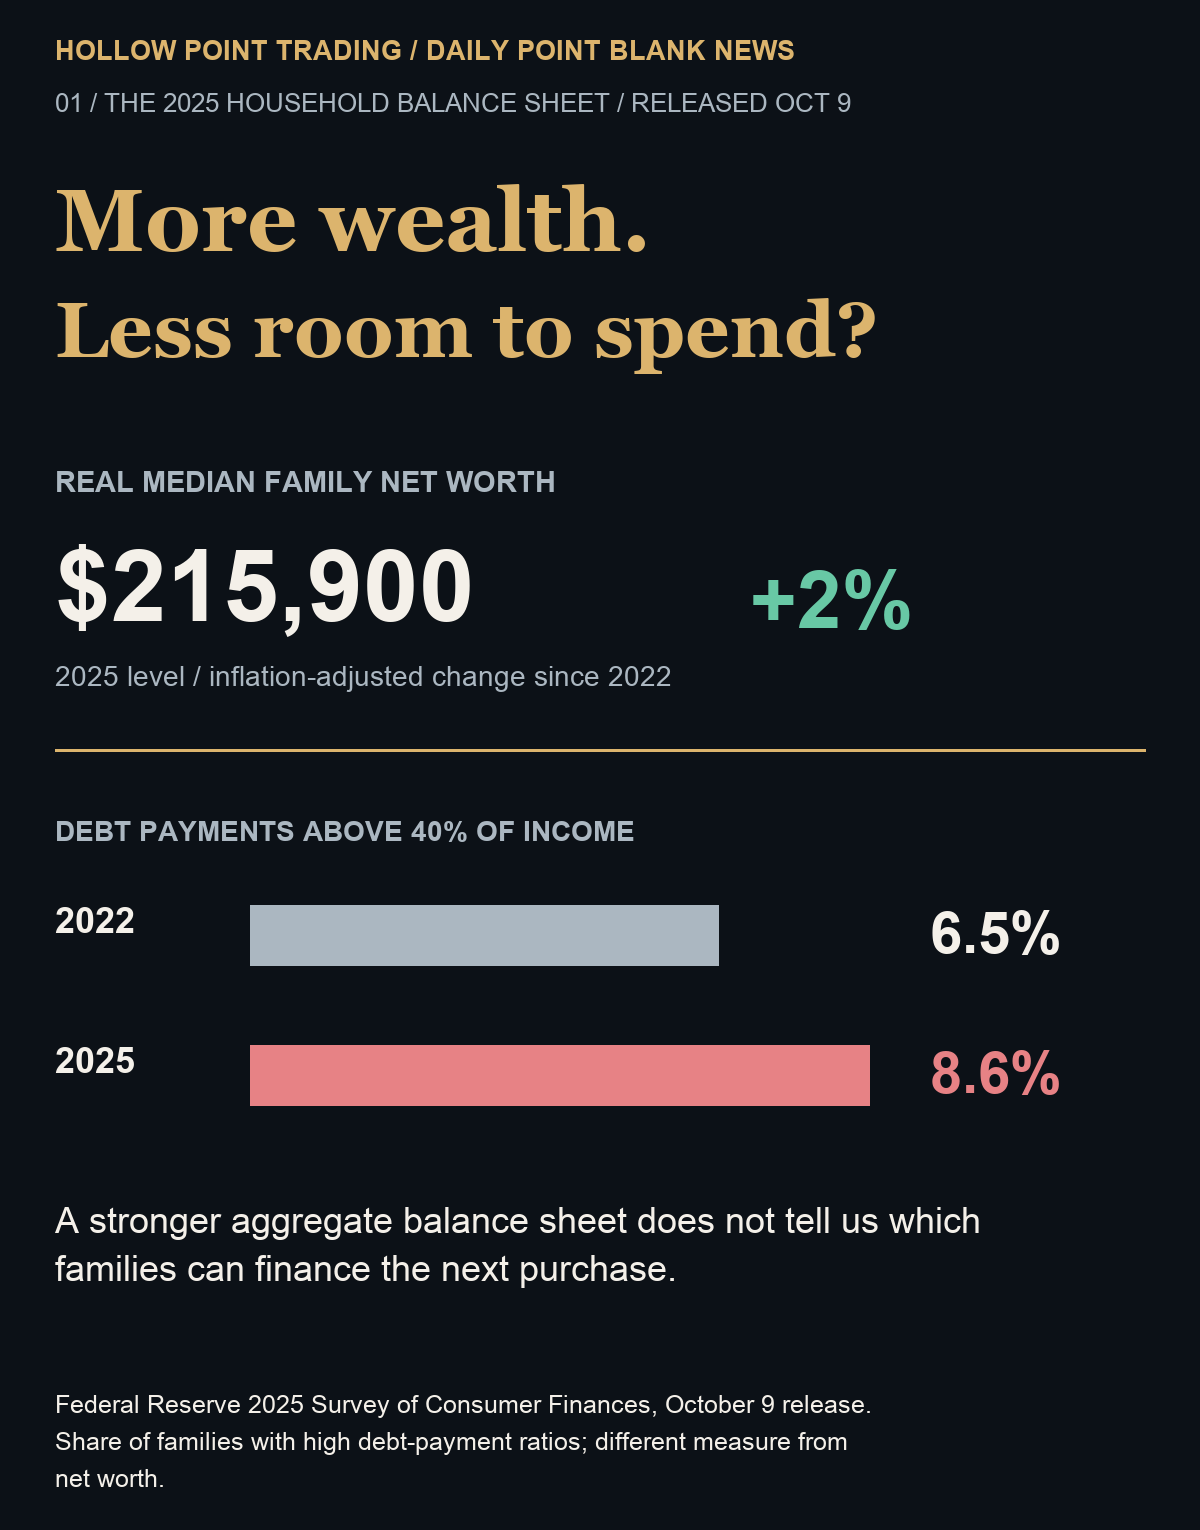
HPT original household comparison: Fed 2025 SCF, released October 9, 2026. Real median family net worth $215,900, +2% since 2022; share with debt payments above 40% of income 6.5% to 8.6%. Different measures, not a combined household-health score.
Hollow Point Trading research · October 9, 2026, after the U.S. regular cash close. The delayed equity board was observed around 15:12 America/Chicago and the rates/continuous-futures overview around 15:13. The genuine NYSE Composite daily chart was exported at 15:15:15. Its delayed feed still displayed Market open, so the captured bar is not represented as the final closing result. The household survey describes 2025, not today’s consumer transactions.
Macro — a broad rebound with uneven participation
The displayed board showed the S&P 500 at 7,811.51, up 0.59%; the Nasdaq-100 at 30,886.14, up 0.52%; the Dow industrials at 51,655.18, up 0.83%; and S&P 400 midcaps at 3,669.15, up 0.52%. The shared positive direction is evidence of a rebound across several major groups at that cutoff. It does not establish that every constituent rose, that buying was evenly distributed, or that a new durable trend began.
Semiconductors declined 0.43% and housing declined 1.08%, while utilities gained 0.57% and gold-and-silver miners gained 2.47%. These group returns are participation proxies, not exchange advance-decline counts or measured fund flows. The housing weakness is relevant to a discussion of financing conditions, but it cannot prove that the survey caused investors to sell that group. A contemporaneous return is not a causal explanation.
The cross-asset overview displayed a two-year Treasury yield of 4.791% and a ten-year yield of 5.246%, a calculated 45.5-basis-point spread. Continuous light-crude futures showed $91.44 per barrel, down 0.05%, and continuous gold futures $4,220.6 per ounce, up 1.53%. These asynchronous references are not official curve closes, settlements or executable prices. They frame financing and commodity conditions without identifying the forces behind each move.
The allocation bars and market board preserve their distinct populations, units and observation times.
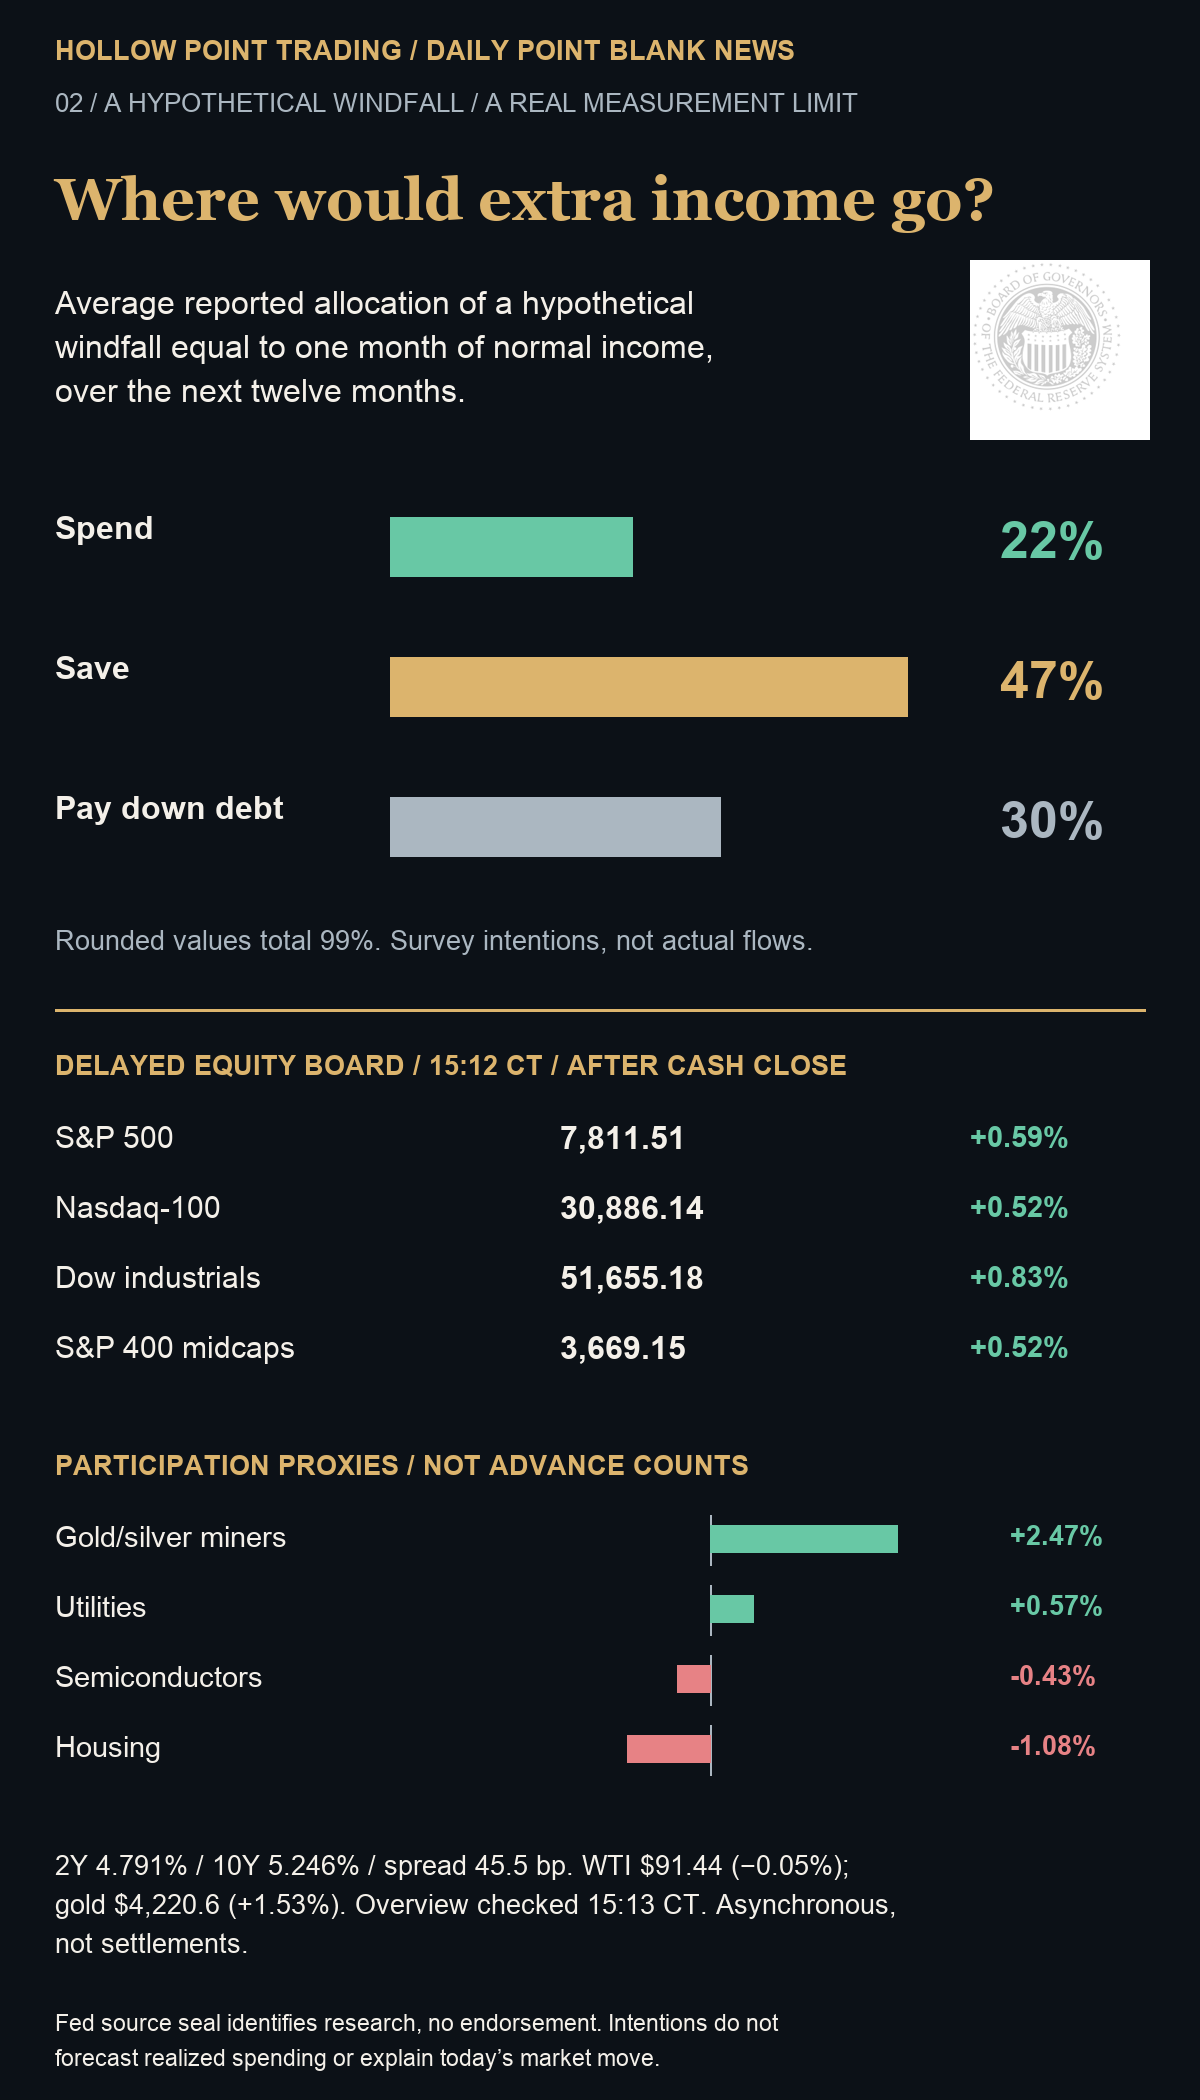
HPT original windfall-allocation and whole-market board. Fed staff October 9 note: hypothetical one-month-income windfall, 22% spend, 47% save, 30% debt repayment over twelve months; rounded total 99%, intentions not flows. Authentic Fed source seal, no endorsement. Delayed equity board 15:12 CT and rates/continuous-futures overview 15:13 CT, October 9; asynchronous after cash close, not final settlements.
Fundamental — wealth, liquidity and payment capacity differ
The Fed released the triennial 2025 Survey of Consumer Finances today at 10:00 a.m. Eastern. Real median family net worth rose 2% from 2022 to $215,900. Conditional median stock holdings increased 36% to $77,400, while stock-market participation slipped from 58% to 56%. The fraction of families whose debt payments exceeded 40% of income rose from 6.5% to 8.6%. These measures describe different populations and financial dimensions; they cannot be added into one household-health score.
Conditional holdings refer to families with those holdings. Their larger median does not imply that the typical family across the entire population owns that amount, or that gains were equally shared. Net worth also includes assets whose value cannot be spent without a sale, borrowing or another transaction. A family can have appreciated assets and still face a tight monthly budget. Conversely, a household with a smaller balance sheet may have stable cash flow. The survey aggregates do not identify either case in an individual reader.
A separate Fed staff note published today examines a new survey question about a hypothetical windfall equal to one month of normal income. Average reported allocations over the following twelve months were 22% to spending, 47% to saving and 30% to debt repayment. The rounded figures total 99%. They are stated intentions under a specific hypothetical question, not observed transactions, a universal response to stimulus, or a forecast of current retail sales.
That distinction matters for translating household evidence into business expectations. A dollar directed toward debt repayment may improve resilience without immediately becoming a merchant’s revenue. Saving can preserve future flexibility; it does not mean money will never be spent. Actual behavior depends on timing, employment, financing terms and the size and permanence of a change in income. The survey provides a research framework for those channels, not a mechanical multiplier to apply to Friday’s market gain.
For a consumer-facing business, the next evidence would be actual transaction volumes, pricing, customer mix and margin disclosures. Strong nominal revenue can coexist with weaker units, while a favorable household aggregate can conceal a different customer base. No individual company’s earnings, customer cohort or valuation is inferred here. The useful question is whether a future operating report corroborates the proposed channel from household capacity to demand.
There is also a clock problem. A survey describing 2025 and a price snapshot from October 2026 are neither synchronized observations nor an event study. Market prices incorporate expectations and many other inputs. The newly released information may alter a research thesis, but this edition does not estimate its price impact. A causal claim would need a clearly defined event window and evidence that competing explanations had been addressed.
The conditional level map requires sustained acceptance and explicit invalidation.
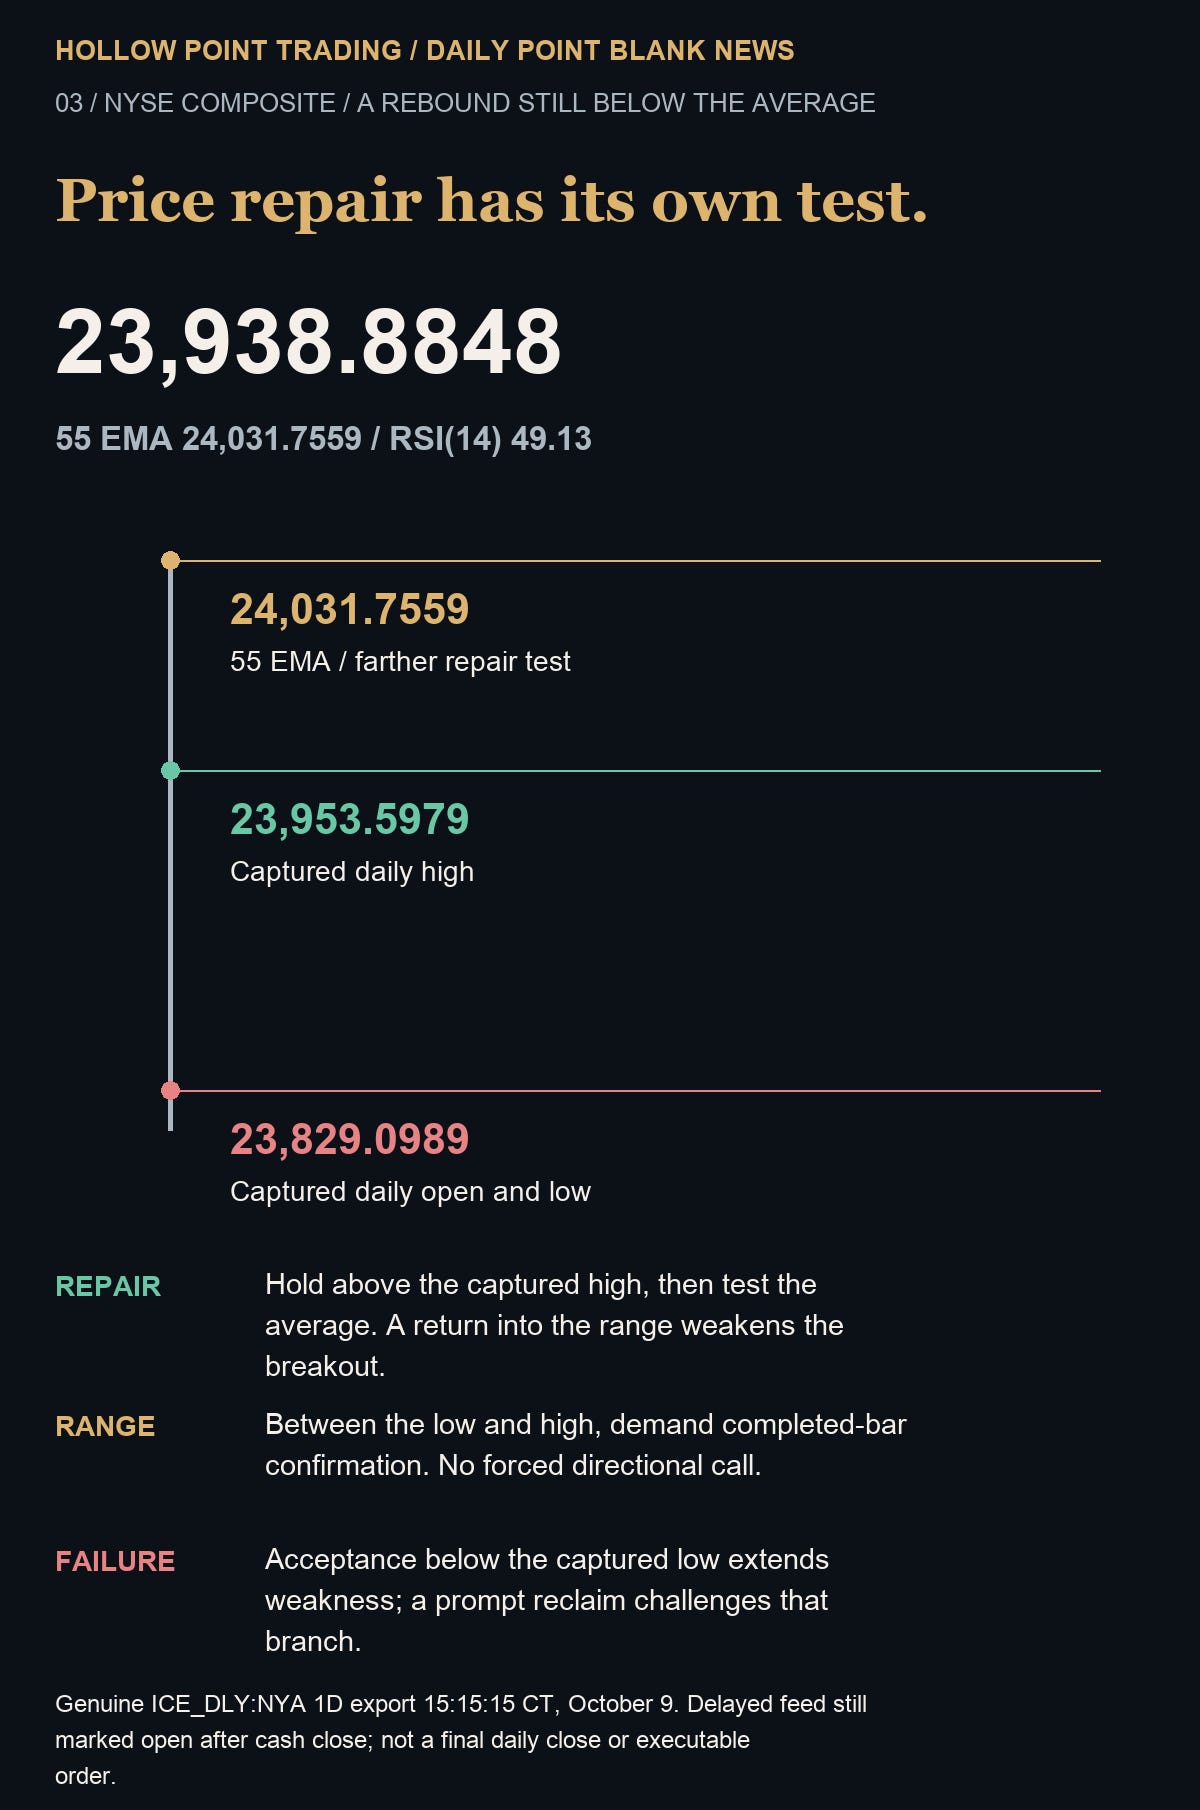
HPT original conditional NYSE Composite schematic, not a synthetic price chart. ICE_DLY:NYA 1D export October 9 at 15:15:15 CT: high23,953.5979, open/low23,829.0989, EMA55 24,031.7559, RSI14 49.13. Delayed feed still marked open after cash close; completed-bar confirmation required.
Technical — the NYSE Composite still has a repair threshold
The genuine TradingView ICE_DLY:NYA daily export shows open 23,829.0989, high 23,953.5979, low 23,829.0989 and captured latest value 23,938.8848, up 141.2860 points or 0.59%. The 55 EMA is 24,031.7559 and RSI(14) is 49.13 in the sole lower panel. The native PNG’s legend and price scale agree. Its delayed forming bar, captured after the cash close, is a reference observation rather than a certified final close.
The visible August-to-October structure shows a decline from higher levels and a rebound that remains below the daily average. Momentum is near but below the RSI midpoint. That supports a description of incomplete price repair. It does not mean the next bar must fall, and an average is a changing calculation rather than a guaranteed barrier. A rebound can continue before the longer structure improves.
Repair branch: sustained acceptance above the captured high of 23,953.5979 would improve the immediate case. A subsequent pullback that holds that area, with wider participation, would provide stronger confirmation than a brief touch. The 55 EMA near the captured 24,031.7559 is the farther repair test. A return into the captured range weakens the breakout premise; the average is not a promised target.
Failure branch: acceptance below the captured open and low of 23,829.0989 would extend the weakness reading. A prompt reclaim challenges that branch. Between the captured low and high, the range remains unresolved. Confirm with completed bars from the same feed and compare the next regular session rather than treating an asynchronous board quote as the same observation. Index values are not directly executable orders.
The genuine daily chart supplies the visible price history and momentum behind the level map.
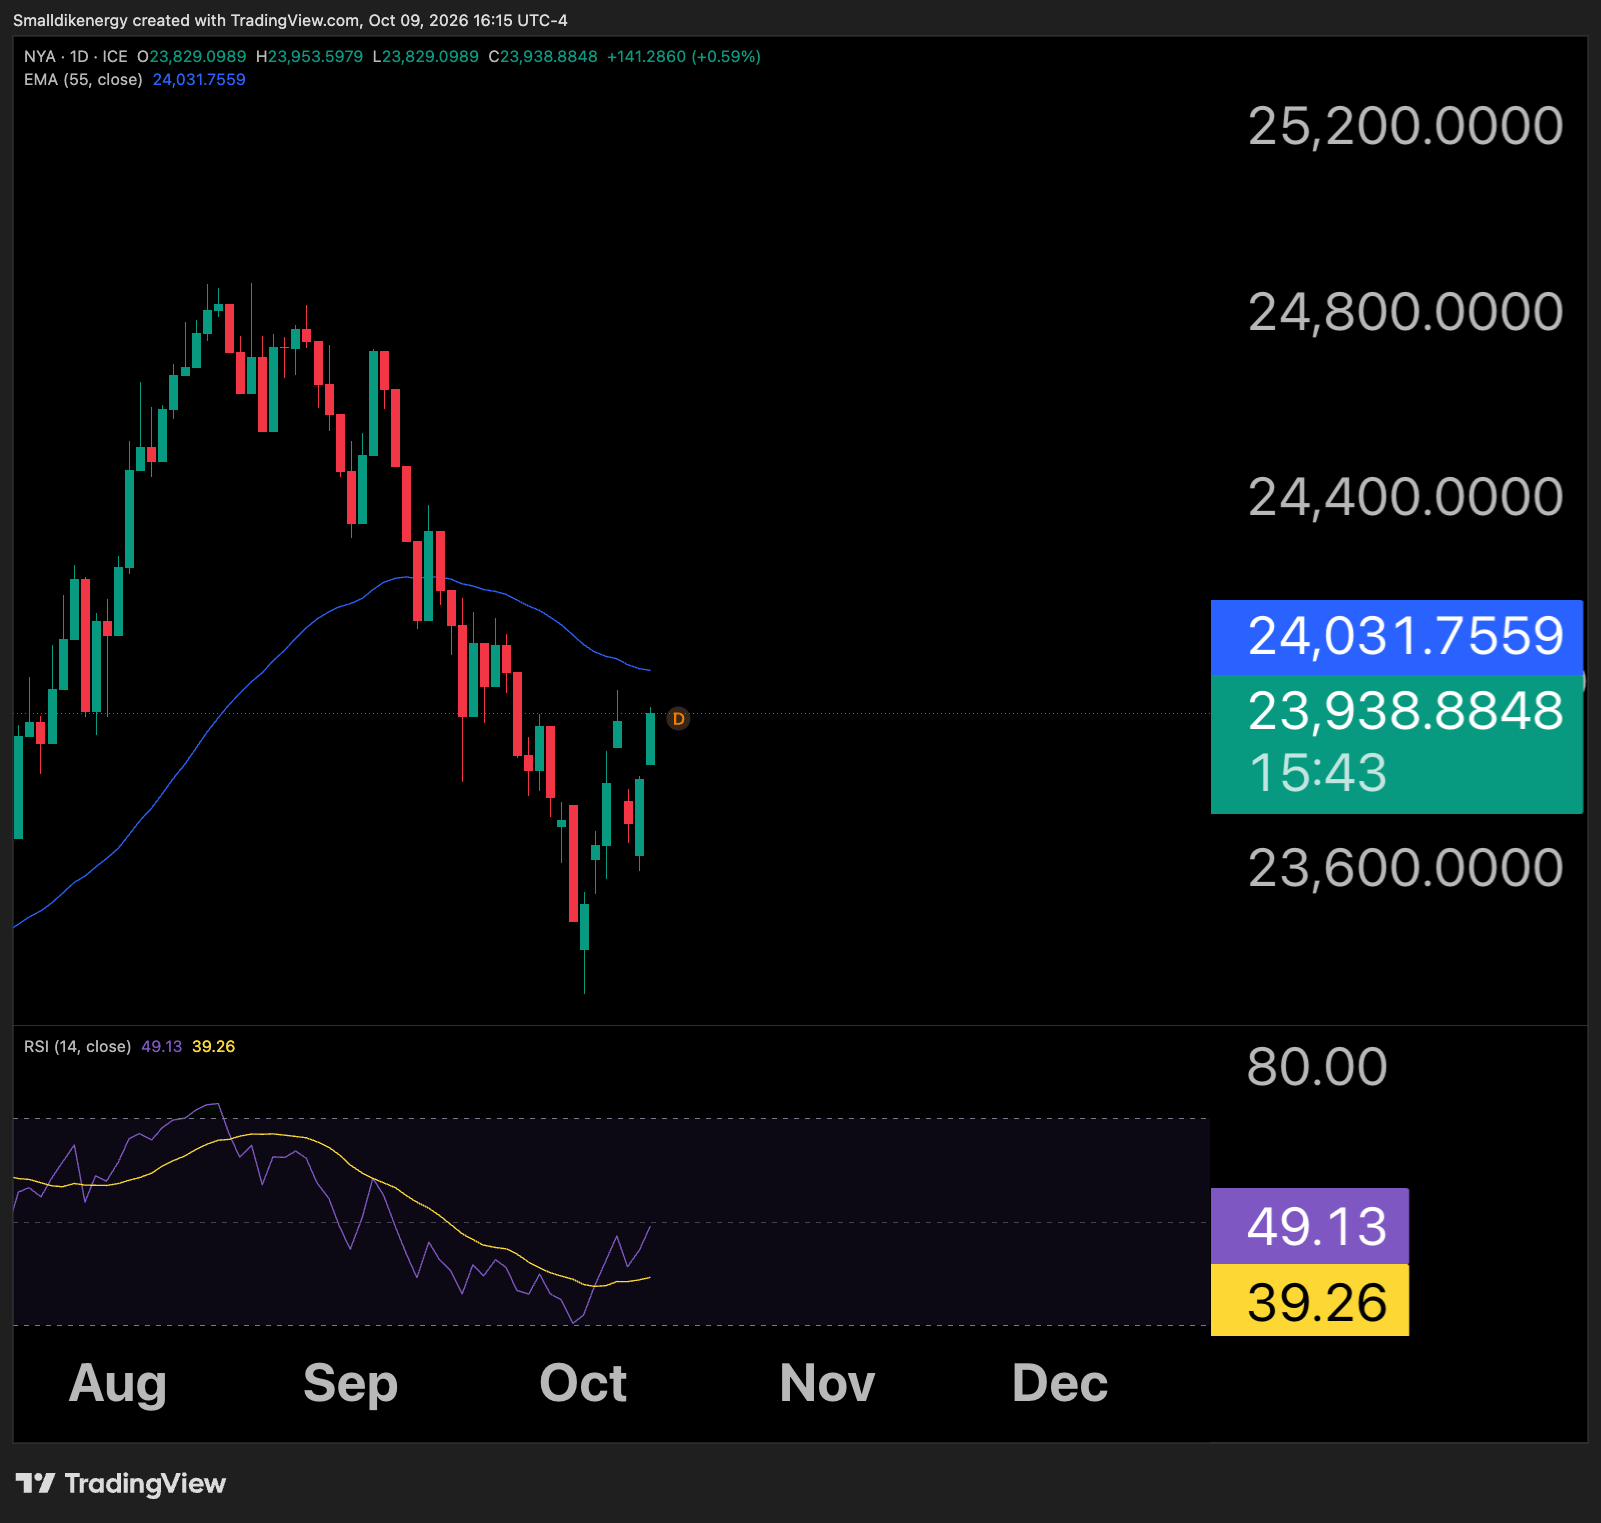
Genuine native TradingView ICE_DLY:NYA 1D export October 9, 2026 at 15:15:15 America/Chicago. O23,829.0989 H23,953.5979 L23,829.0989 captured23,938.8848; EMA55 24,031.7559 and sole RSI14 lower panel49.13. Candle legend and price scale agree. Delayed forming bar after cash close, not a final daily close or execution price.
Risk — require evidence for each link
The research chain has three separate tests: household balance sheets, realized consumer behavior and sustained price acceptance. A favorable reading on one does not prove the other two. The panels preserve those units and clocks so that later evidence can challenge the interpretation. This edition makes no position disclosure, measured-flow claim or guaranteed outcome prediction.
Educational research, not personalized financial advice. Survey estimates and market data can be revised or delayed. Funds and derivatives introduce their own pricing, basis, leverage and gap risks; an index cannot be traded directly. Losses can be substantial. Use current evidence and define invalidation for the actual instrument before any real decision.
Sources and supporting evidence
Federal Reserve · 2025 Survey of Consumer Finances release, October 9, 2026
Federal Reserve staff · household marginal propensity to consume, October 9, 2026
TradingView · delayed U.S. index board observed October 9 around 15:12 CT
TradingView · rates and continuous commodities checked around 15:13 CT
TradingView · NYSE Composite native chart reference