
Wholesale sales accelerated in the latest Census release, but Friday’s transportation index is not confirming the broad equity advance. That is a useful tension to investigate, rather than a contradiction to explain away. Dollar sales, physical shipments and the market value of transport businesses measure different things. Keeping those distinctions explicit prevents a strong economic headline from becoming an unsupported freight-volume forecast.
Hollow Point Trading research · October 9, 2026, regular U.S. cash session. The delayed equity board and cross-market overview were checked around 14:43 America/Chicago. The genuine transport daily chart was exported at 14:44:09. The statistical report covers August and was released yesterday, October 8. These are asynchronous observations, not closing prices or evidence that the release caused today’s move.
The first panel contrasts nominal wholesale growth with the incomplete transport-price repair.
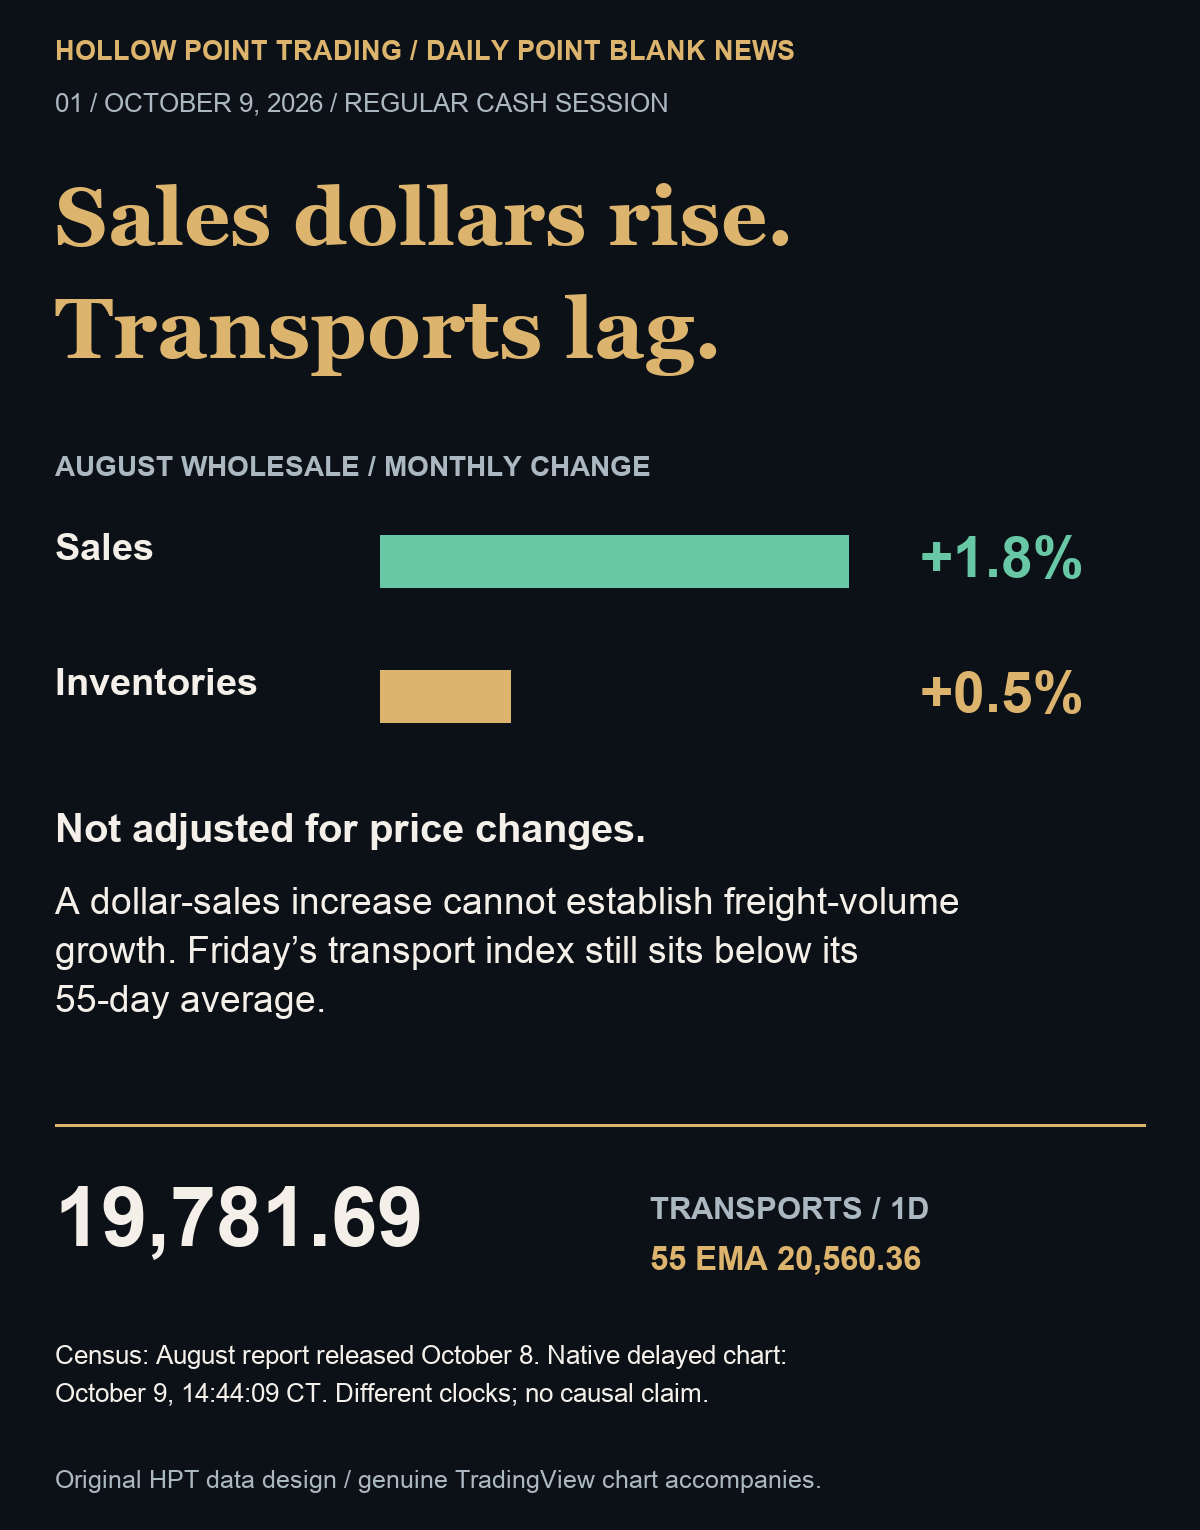
HPT original comparison: Census August 2026 wholesale sales +1.8% monthly versus inventories +0.5%, report released October 8; not price adjusted. Genuine TradingView DJ_DLY:DJT 1D export October 9 at 14:44:09 America/Chicago, captured 19,781.69 below EMA55 20,560.36. Different clocks and measures; no causal claim.
Macro — broad gains still leave a transport gap
The delayed board showed the S&P 500 at 7,811.22, up 0.59%; the Nasdaq-100 at 30,877.77, up 0.49%; the Dow industrials at 51,671.62, up 0.86%; and S&P 400 midcaps at 3,674.61, up 0.67%. Several major groups therefore shared a positive direction at the observation time. The industrial average’s strength does not imply that every economically sensitive group participated.
Transportation was down 0.29% on that board, while semiconductors fell 0.47% and housing fell 1.09%. Gold-and-silver miners gained 3.05% and utilities gained 0.66%. These index returns describe participation proxies, not exchange advance-decline counts. They show an uneven advance without measuring how many stocks rose or establishing investor flows. Transport lag matters as a potential challenge to broad economic confirmation; one intraday relative return cannot establish a recession or a durable trend.
The same overview displayed a two-year yield of 4.791% and a ten-year yield of 5.244%, a calculated 45.3-basis-point spread. Continuous light-crude futures showed $91.31 per barrel, down 0.20%, and continuous gold futures $4,221.9 per ounce, up 1.56%. These are displayed references, not the official closing Treasury curve or executable prices. Continuous contracts can roll, and the observations are not synchronized. A small oil decline does not by itself establish lower fuel expense for every carrier.
Fundamental — wholesale dollars are not freight units
Census’s October 8 Monthly Wholesale Trade Report puts August merchant-wholesaler sales at $817.5 billion, up 1.8% from revised July and 15.6% from revised August 2025. Inventories were $964.2 billion, up 0.5% monthly and 6.4% annually. The inventory-to-sales ratio was 1.18 versus 1.28 a year earlier. The estimates exclude manufacturers’ sales branches and offices and adjust for seasonality and trading days, but not price changes.
That last qualification changes the interpretation. Higher nominal sales can reflect some combination of more goods, higher prices and a different product mix. The release does not isolate those contributions in a freight-volume measure. The inventory-to-sales ratio can decline when the sales denominator rises faster than the inventory numerator. It does not prove that businesses deliberately liquidated physical stocks, that warehouses emptied, or that transportation companies gained pricing power.
HPT arithmetic shows a 1.3-percentage-point gap between monthly sales growth and inventory growth. The annual growth-rate gap is 9.2 percentage points, and the reported ratio fell 0.10. These comparisons describe the published aggregates; they are not estimates of tons, packages, miles or shipments. A dollar-based turnover measure is useful for assessing the relationship between inventory and sales, but its units must stay visible.
The channel from wholesalers to transportation earnings has several additional links. Goods need to move, but a carrier’s revenue depends on shipment mix, distance, contractual rates, capacity and timing. Its margins also depend on fuel, labor, utilization and other costs. A stronger sales-dollar aggregate therefore raises a research question about future operating disclosures rather than supplying the answer. No individual carrier’s results or holdings are inferred here.
The official wholesale data and current market board retain their distinct units and observation clocks.
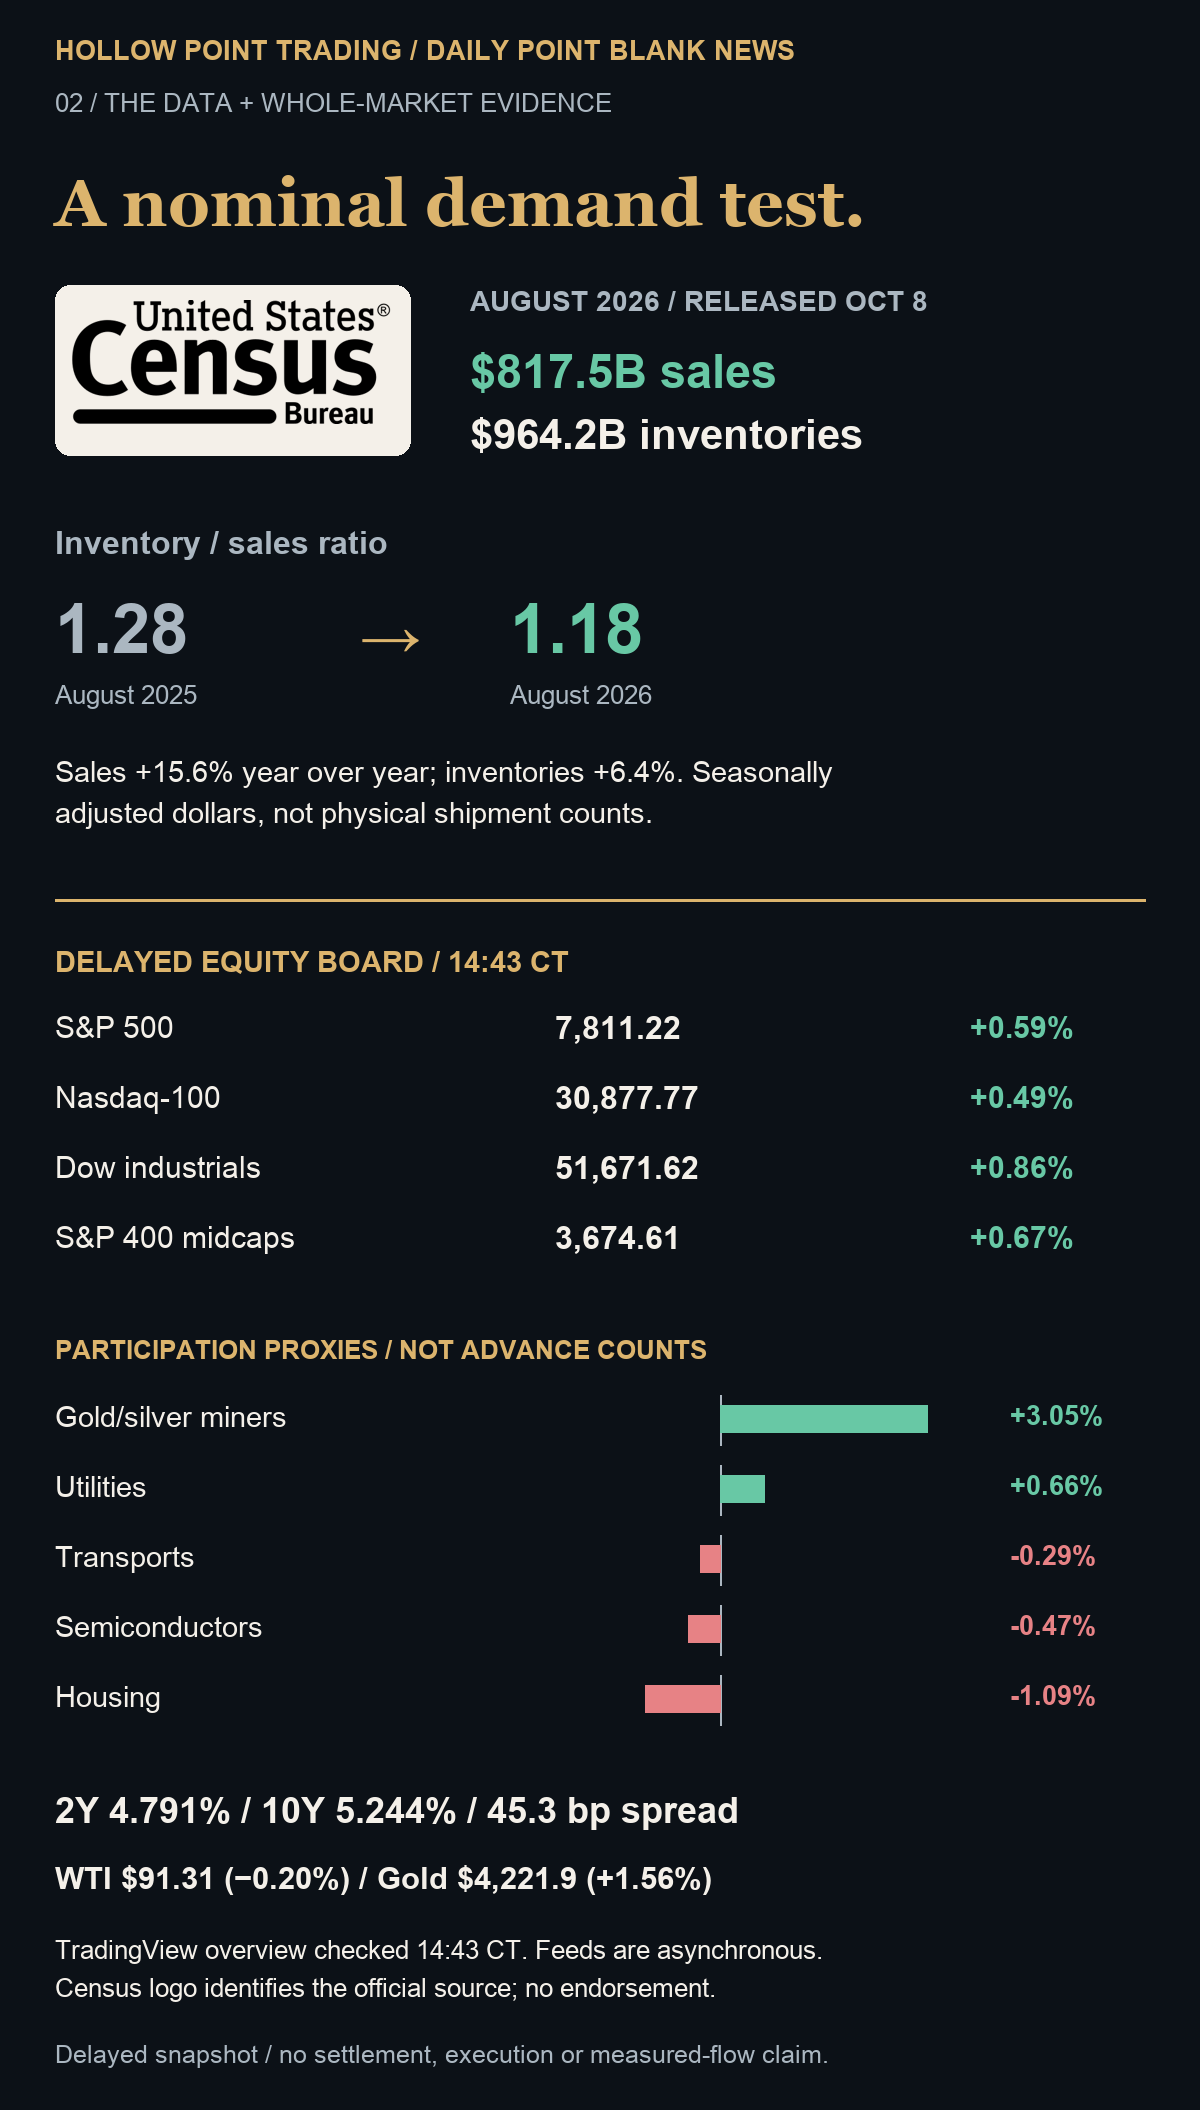
HPT original Census comparison and whole-market board with authentic U.S. Census Bureau source logo, no endorsement. August 2026 dollars and inventory/sales ratio; TradingView delayed equity and rates/continuous-futures overview observed October 9 around 14:43 America/Chicago. Index returns are participation proxies, not advance counts. Quotes are asynchronous and not settlement prices.
There is also a timing gap. August’s economic activity predates today’s October market price. Equity prices can respond to expectations and many other inputs, whereas the report describes an earlier period. The appropriate follow-up is to compare later shipment and operating evidence with the nominal-sales signal. Today’s transport weakness does not refute the August release, and the release does not invalidate today’s chart. The two require different confirmation tests.
Technical — a rebound beneath the daily average
The genuine TradingView DJ_DLY:DJT daily export shows open 19,795.40, high 19,861.87, low 19,704.46 and captured latest value 19,781.69, down 27.38 points or 0.14%. The 55 EMA is 20,560.36 and RSI(14) 42.63 in the sole lower panel. The PNG’s candle legend and price scale agree. Its delayed forming October 9 bar is a later observation than the broad board, which explains why their transport returns differ; neither is presented as a final daily close.
The visible July-to-October structure descends from materially higher levels, with the current rebound still below the declining daily average. Momentum remains below the RSI midpoint. That supports a description of incomplete trend repair. It does not establish that the next move must be lower, and an oversold rebound can travel meaningfully without becoming a sustained uptrend. The average is dynamic and will change with subsequent bars.
Repair branch: sustained acceptance above the captured 19,861.87 high would improve the immediate rebound case. A pullback that holds that area, alongside broader participation, would be stronger evidence than a single intraday touch. The 55 EMA near the captured 20,560.36 remains a farther trend-repair test, not a promised target. Falling back into the captured range would weaken the immediate breakout premise.
The conditional map identifies the immediate range and the farther average test.
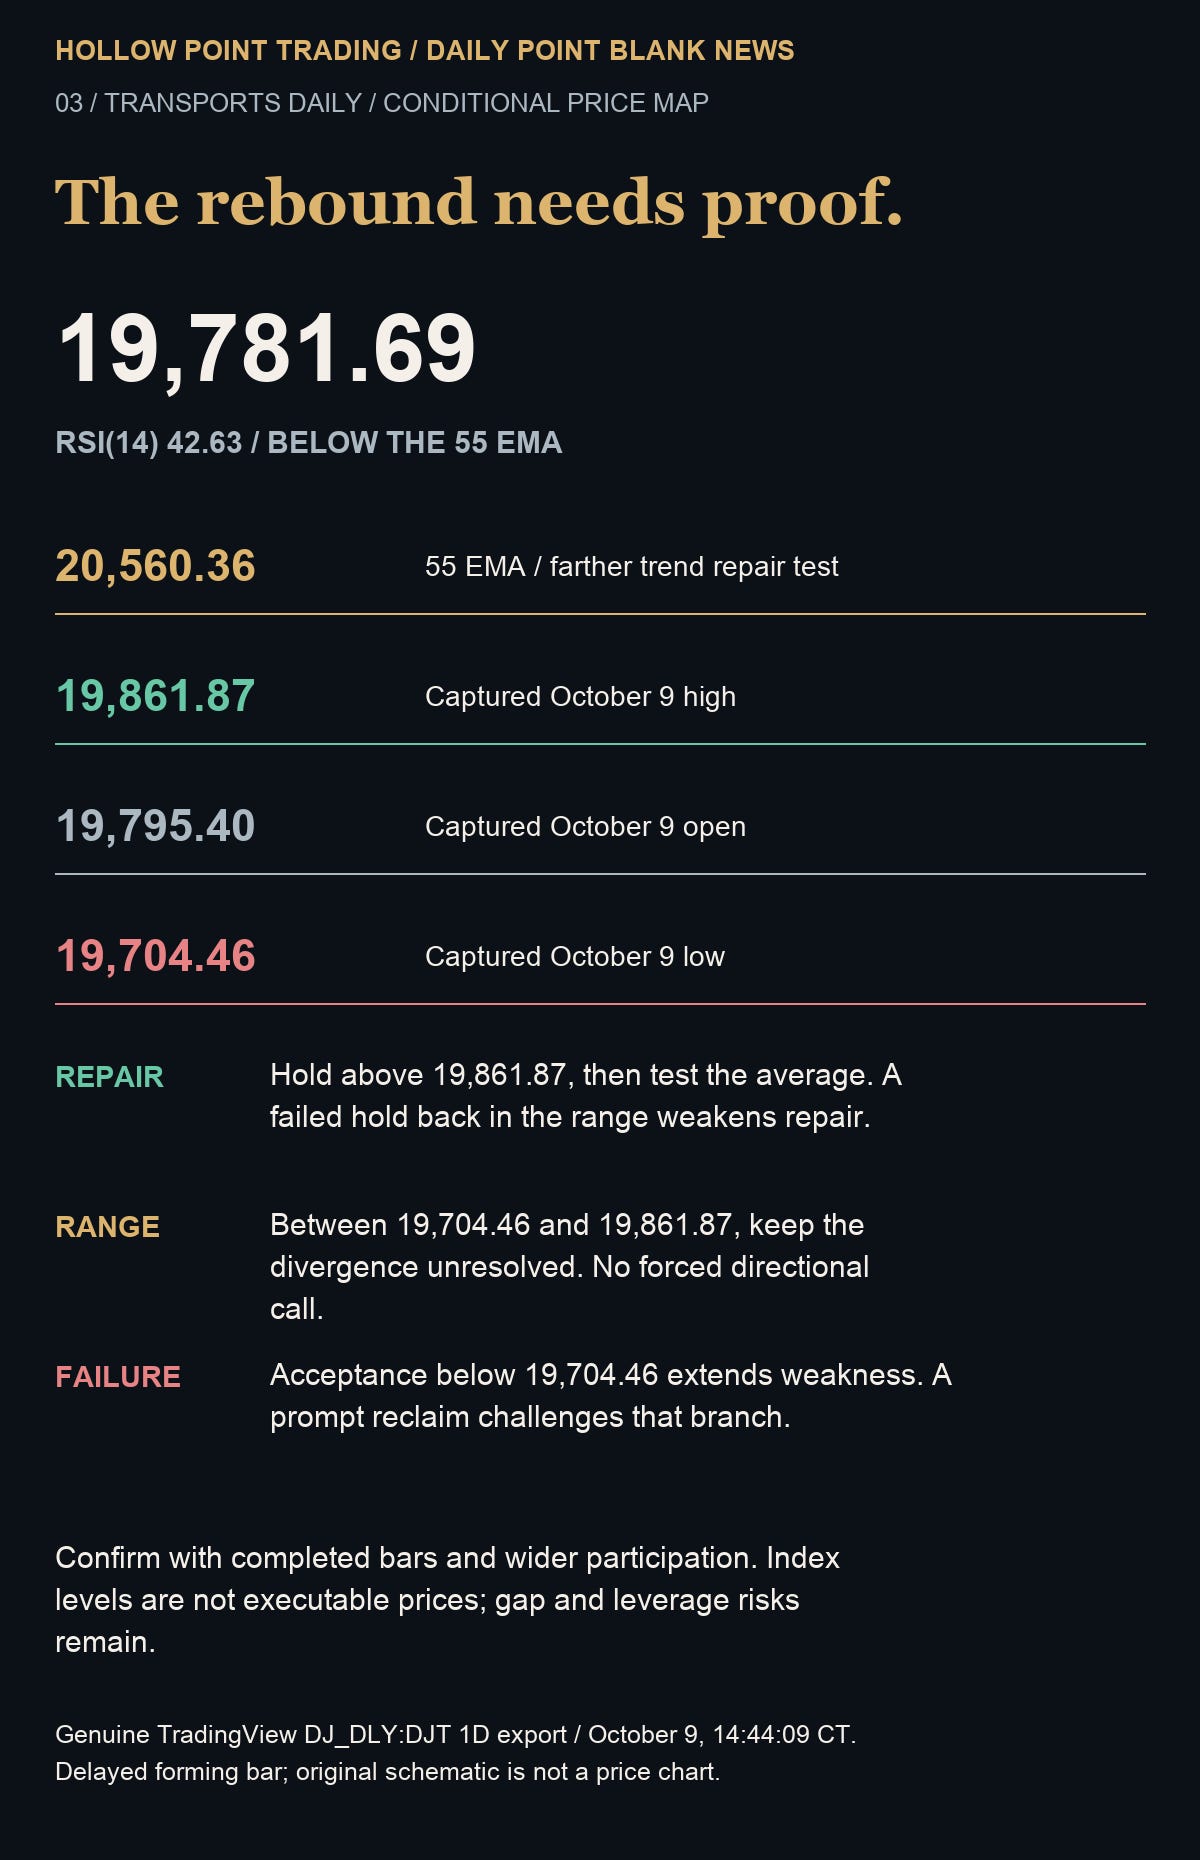
HPT original conditional transport-index schematic based on genuine TradingView DJ_DLY:DJT 1D export October 9 at 14:44:09 America/Chicago: low 19,704.46, open 19,795.40, high 19,861.87, EMA55 20,560.36, RSI14 42.63. Delayed forming bar; schematic is not a price chart, forecast or executable order.
The genuine daily chart supplies the visible history and momentum behind those conditional references.
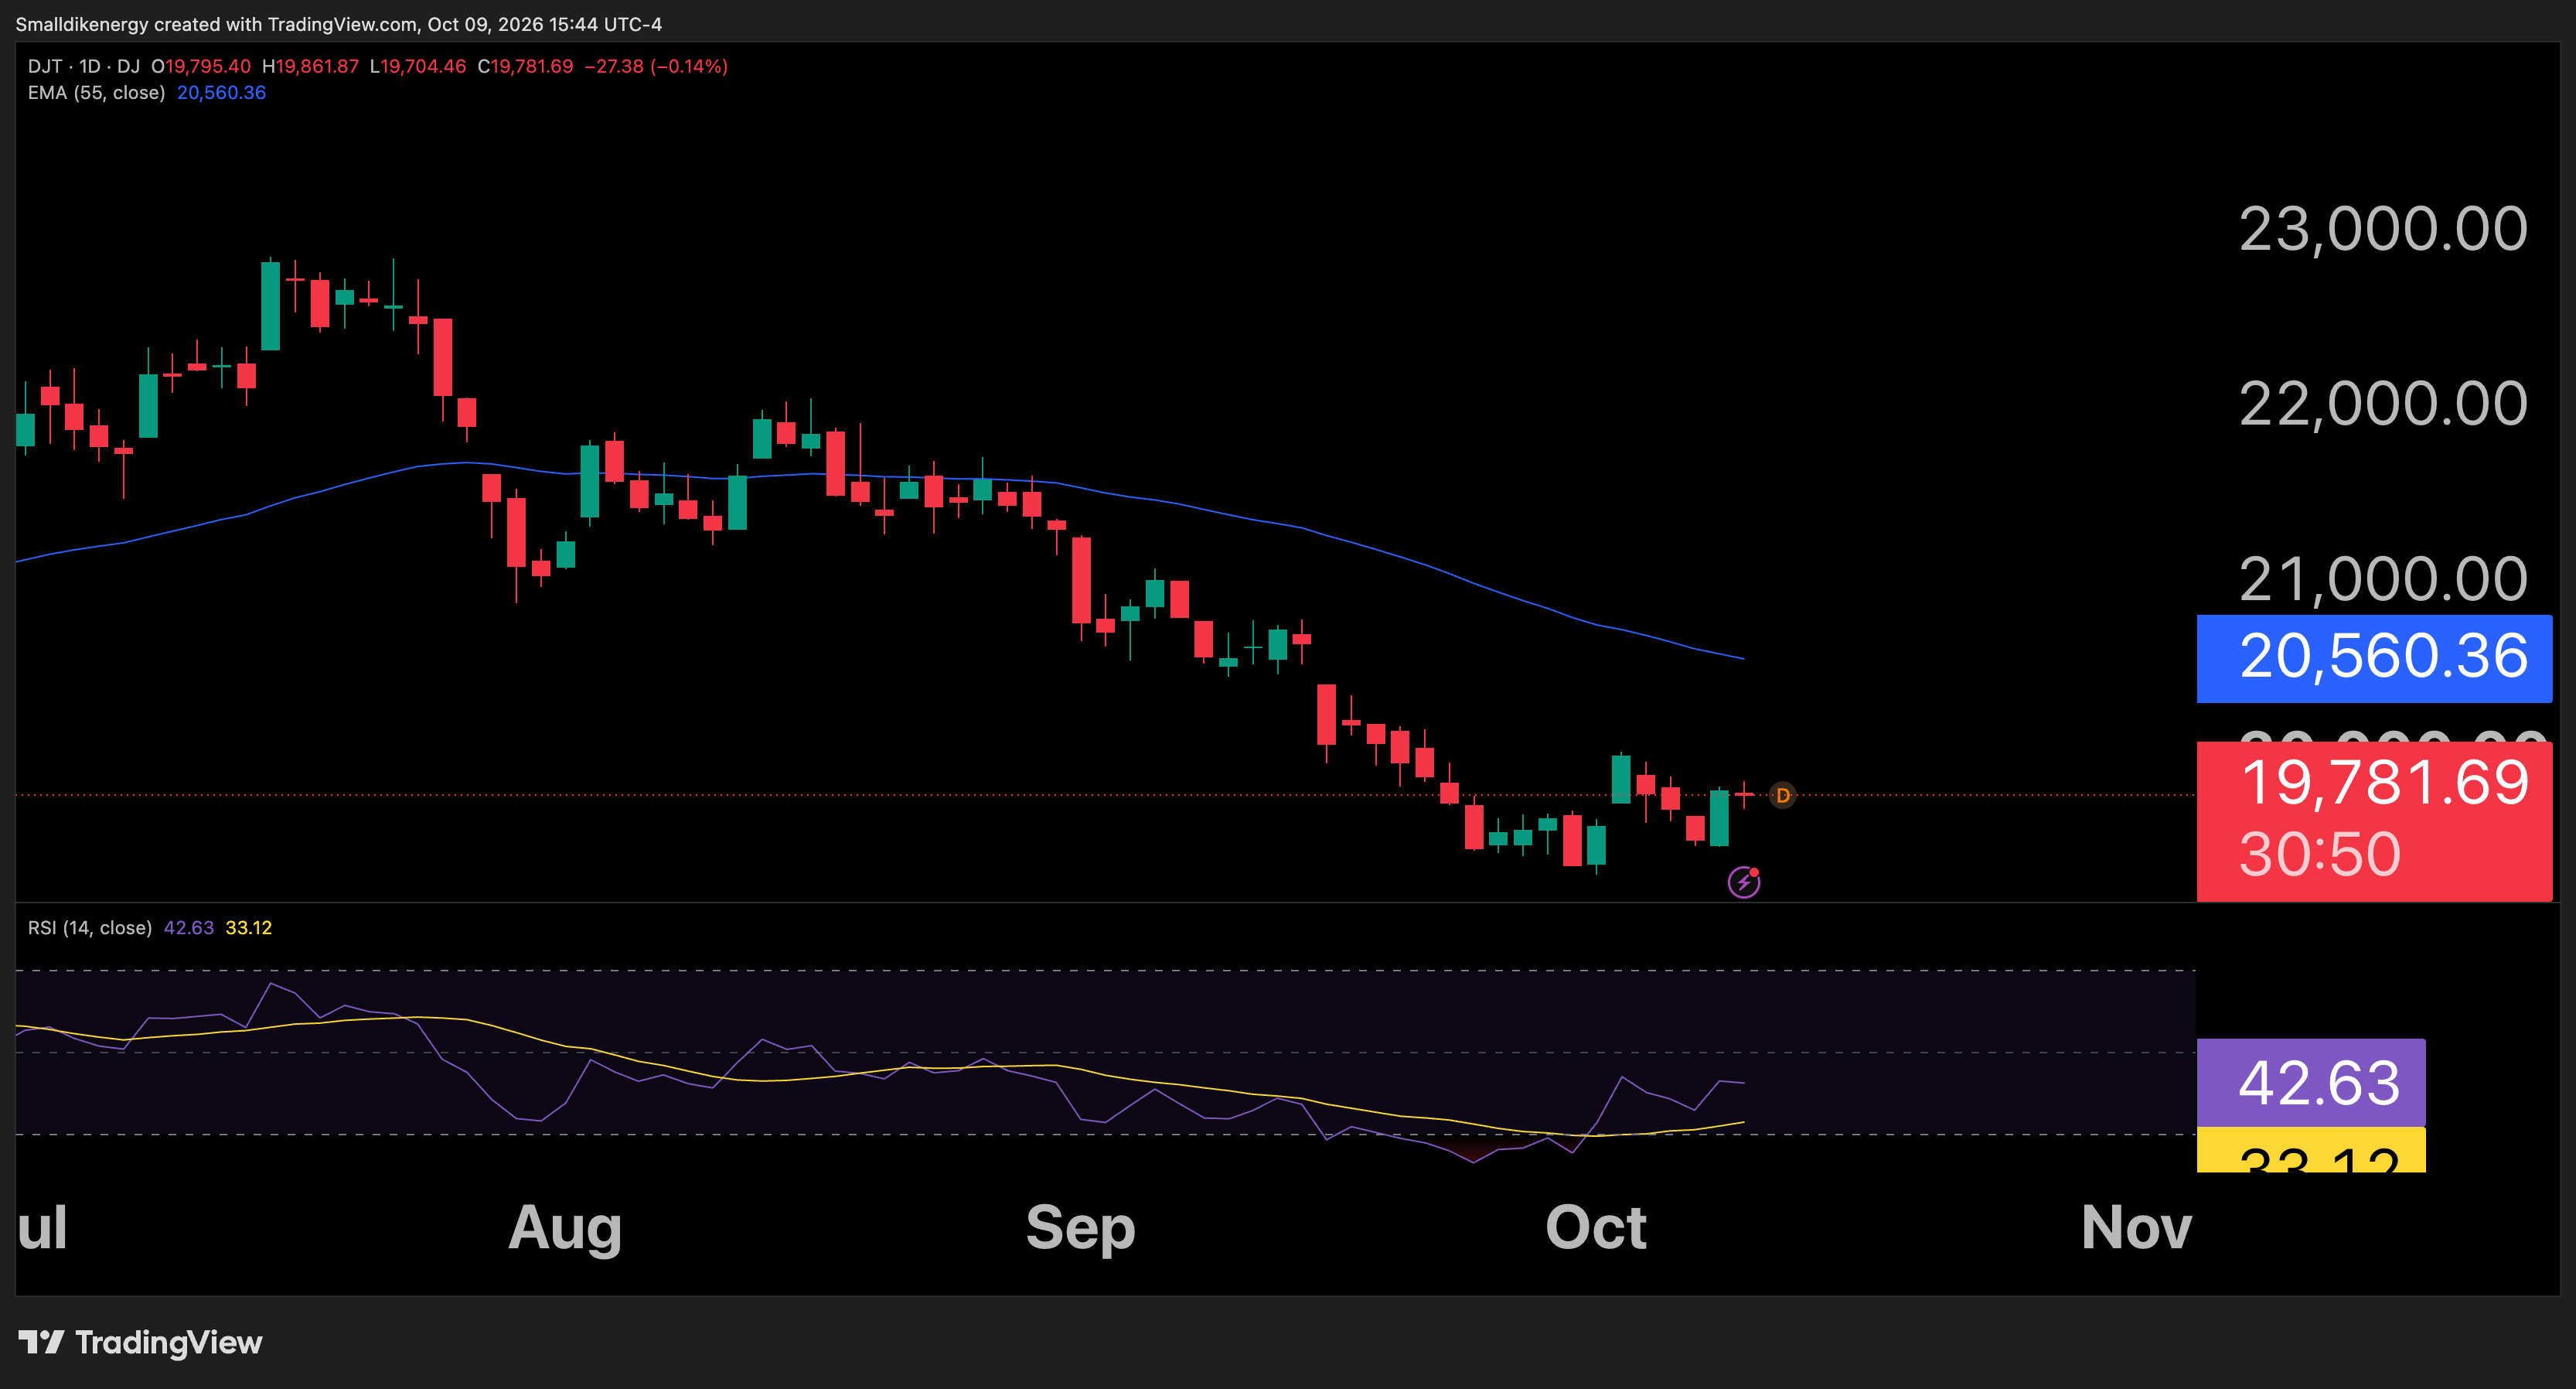
Genuine native TradingView DJ_DLY:DJT 1D candlestick export October 9, 2026 at 14:44:09 America/Chicago. Delayed forming regular-session bar O19,795.40 H19,861.87 L19,704.46 latest19,781.69; EMA55 20,560.36 and RSI14 42.63 in the sole lower panel. Legend and scale agree; index levels are not execution prices or a completed daily close.
Failure branch: acceptance below the captured 19,704.46 low would extend the weakness reading. A prompt reclaim would challenge that branch. Between that low and 19,861.87, the range remains unresolved, with the opening reference at 19,795.40 inside it. These are conditional index observations, not directly executable orders. Friday’s completed daily bar and the next regular-session evidence offer clearer comparisons than mixing intraday observations from different feeds.
Risk — demand evidence and price confirmation remain separate
The practical lesson is to require the right evidence for each claim. Physical-volume strength needs shipment evidence; improving business economics needs operating evidence; chart repair needs sustained price acceptance. A favorable reading on one measure cannot silently substitute for the others. This edition makes no causal claim, position disclosure or prediction of a guaranteed outcome.
This is educational research, not personalized financial advice. Market data can be delayed or revised. An index cannot be traded directly, and derivatives or funds introduce their own pricing, basis, leverage and gap risks. Losses can be substantial. Define invalidation for the actual instrument and use current evidence before making any real decision.
Sources and supporting evidence
U.S. Census Bureau · August 2026 Monthly Wholesale Trade Report, released October 8
TradingView · U.S. index board observed October 9 around 14:43 CT
TradingView · rates and continuous-commodity overview checked October 9 around 14:43 CT
TradingView · Dow Jones Transportation Average chart reference