
The September jobs report invites a familiar shortcut: weaker hiring must be bullish for gold. The October 5 daily gold chart is a useful check on that story. At the 1:03 p.m. CT capture, the spot display remained below its established 55-day average and its RSI was below 50. A macro argument may be plausible while price has yet to confirm it.
Macro: one weak payroll print does not set the rate path
The U.S. regular equity session is open at this edition’s cutoff. The Bureau of Labor Statistics reported on October 2 that September nonfarm payroll employment rose 29,000 and the unemployment rate was 4.2%. July and August payroll estimates were revised a combined 60,000 lower. Average hourly earnings rose 0.1% in September and 3.0% over twelve months. These are reported labor-market results, not a Federal Reserve decision or a forecast for the next jobs report.
Slower hiring can shift expectations toward easier policy, but gold’s response depends on the full mix of nominal yields, expected inflation, real yields and the dollar. A lower nominal yield is not automatically a lower real yield; a currency move can alter the price paid by non-dollar buyers. The September employment report also came before today’s trading. Treat it as background evidence, then ask what the current market is doing with it. Claiming that the jobs figure caused each move in gold would overstate what this evidence establishes.
The two BLS surveys need different labels. The 29,000 payroll gain comes from the establishment survey. The 4.2% unemployment rate comes from a household survey. Revisions are normal as more employer records arrive. Their combined message is cooling, not proof of recession, immediate easing or a specific future gold price. The next labor release and policy communication can change that interpretation.
Fundamental: gold’s value proposition has an opportunity cost
Gold does not distribute earnings or a coupon. Its appeal can rise when investors want a liquid hedge against currency, policy or geopolitical uncertainty, but the holder also gives up the return available on interest-bearing assets. A weak jobs print may reduce that opportunity cost if real yields fall. If inflation expectations fall faster than nominal yields, or the dollar strengthens, the same headline may fail to support spot gold. These are mechanisms and scenarios, not measured explanations of today’s candles.
For a portfolio decision, separate the hedge thesis from the timing thesis. A strategic allocation may be justified by diversification even if a short-term chart is weak. A tactical entry needs a different test: can the market reclaim resistance and hold it on completed bars? The amount at risk should reflect the fact that spot quotes vary by dealer and do not describe a guaranteed futures, ETF or physical-metal execution price. No HPT position or trade outcome is implied.
The teaching point is to keep three columns apart: what BLS actually reported, the policy or real-yield interpretation an investor infers, and what gold’s own price has confirmed. Confusing those columns turns a plausible narrative into a blind signal. They can disagree for days or longer.
Technical: the daily chart has not reclaimed the average
A separate publisher-owned TradingView tab showed OANDA:XAUUSD on the one-day timeframe at about 1:03 p.m. CT. The October 5 bar was unfinished. The spot display was around $4,139.94, below the established 55-day EMA near $4,300.94; RSI, the only lower panel, was near 38.4. These are visual, feed-specific readings at capture, not a completed daily close or an executable quote. The chart’s marked swing low is around $4,110.87. An immediate control line sits near $4,149.44, with $4,200 and $4,221.19 above it. The drawn midpoint near $4,255.27 and the average are further recovery tests. The marks are historical chart references, not new targets supplied by BLS.
The constructive scenario first requires a completed daily close back above $4,149.44, then acceptance over $4,200 to $4,221.19. A later retest that holds would be stronger evidence than a brief intraday cross. A neutral scenario is continued rotation between the marked $4,110.87 low and the $4,149.44 line while the labor and rate narrative is digested. A completed close below $4,110.87 followed by a failed reclaim invalidates the immediate hold-the-low case. Repeated closes above $4,221.19 would weaken the near-term bearish reading, though the 55-day average remains overhead.
This structure does not predict the next tick. A central-bank surprise, a sharp dollar move or geopolitical news can gap through drawn levels. Trade sizing and exits must account for slippage and for the differences between this spot display and any instrument actually traded. The chart asks whether buyers are accepting higher prices; it cannot establish why the jobs data came in as reported.
The tension is instructive: the BLS report supplies a softer hiring backdrop, while the gold chart still needs a price reclaim. There is no need to force those facts into one direction. Wait for the specific evidence that matters to the chosen time horizon.
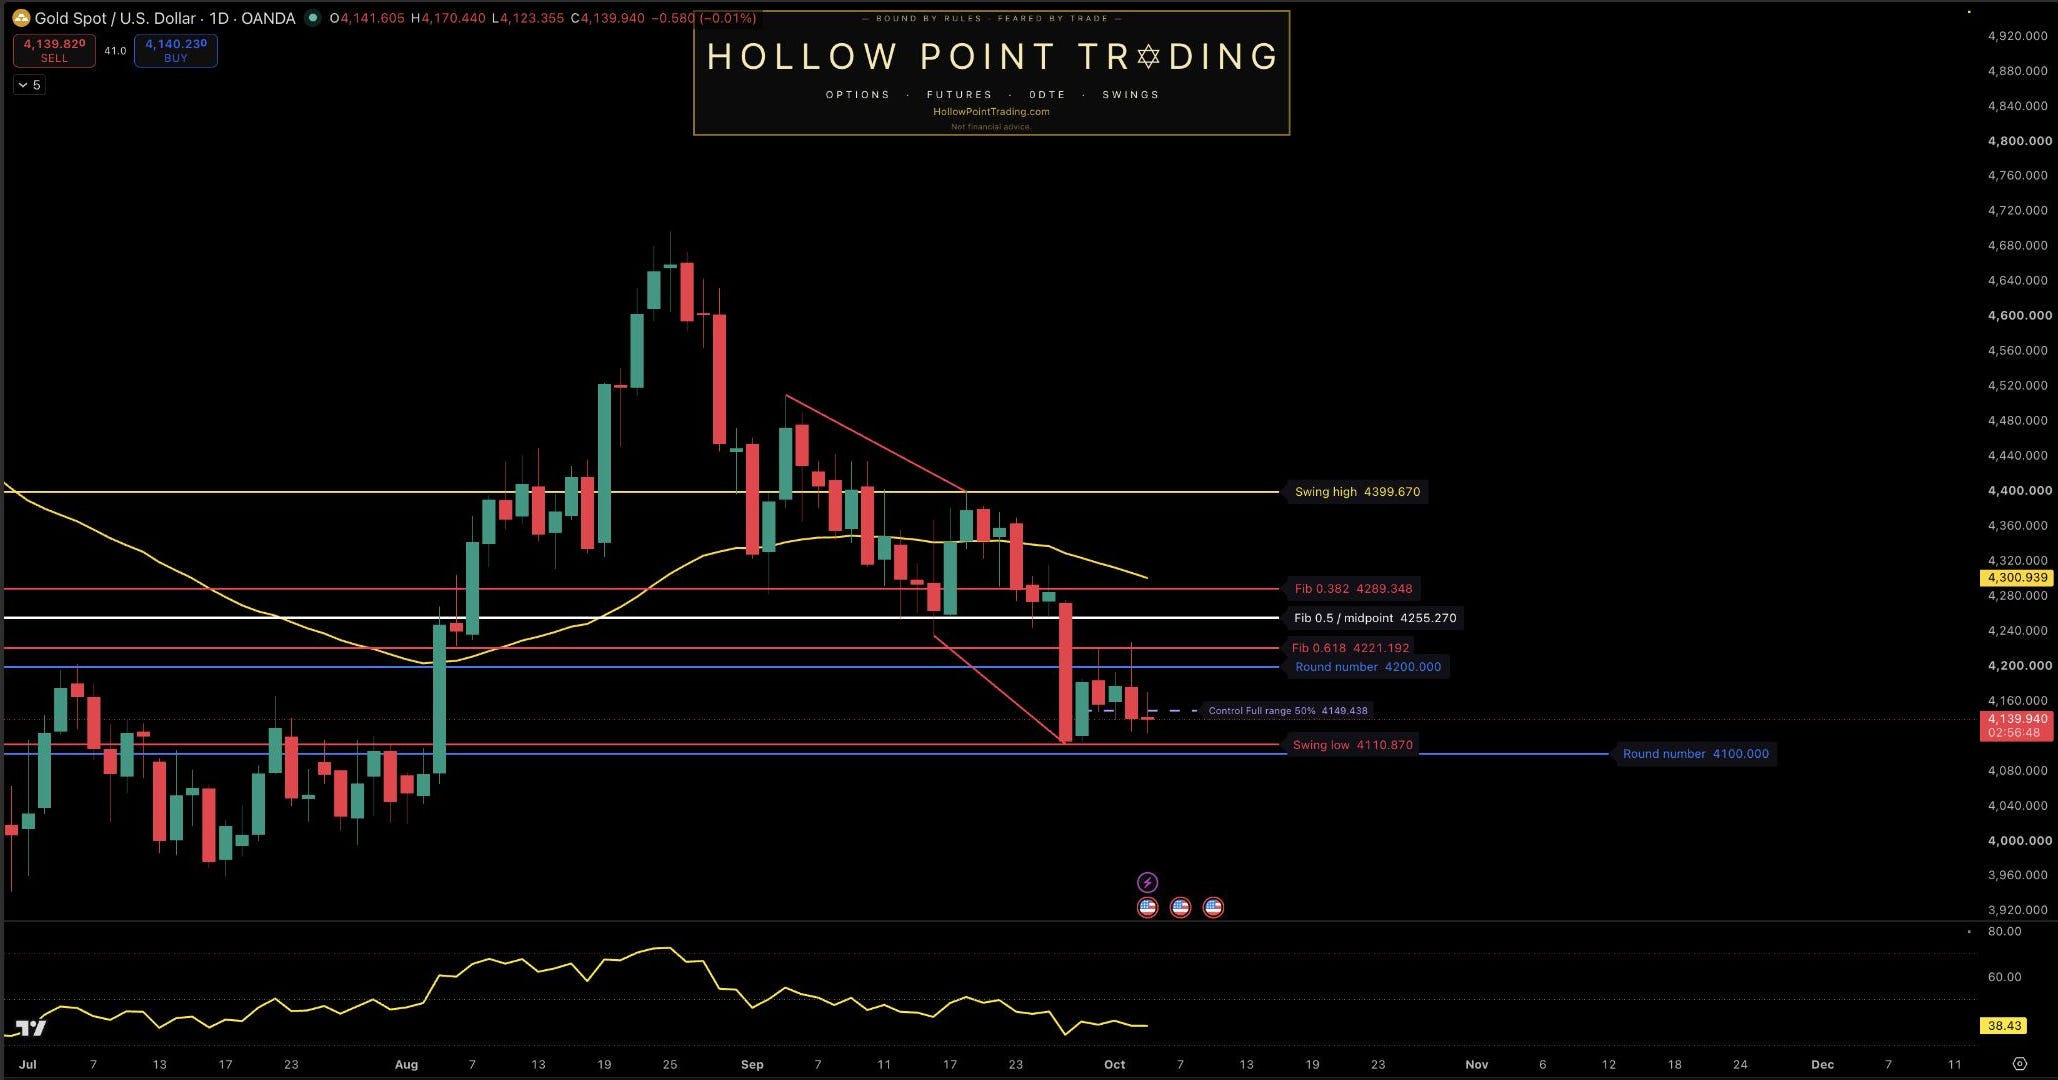
Source: TradingView, dedicated HPT publisher-owned OANDA:XAUUSD chart; 1-day timeframe; captured October 5, 2026 at about 1:03 p.m. CT. October 5’s bar was unfinished. Spot indication near $4,139.94, 55 EMA near $4,300.94 and RSI near 38.4 are visual, feed-specific readings. Drawn levels are static references, not assured fills, a futures settlement, a completed close or an HPT position.
Sources: BLS, Employment Situation for September 2026, released October 2; TradingView OANDA:XAUUSD chart.
Educational research only. Spot metals, futures, ETFs and options have different risks and execution terms. Price gaps and leverage can cause substantial loss. This is not personalized investment advice.
Which would change your near-term gold view first: a completed daily reclaim above $4,221.19, a failed hold of $4,110.87, or new evidence that changes the real-yield interpretation?