
Macro: hedging demand can spike without becoming a permanent position
The U.S. regular equity session is open for this 11:30 a.m. CT edition. Rates, oil, European gas, crop prices and equity risk all create reasons to use an exchange, and Intercontinental Exchange sits across several of those markets. ICE’s October 5 release gives this edition a fresh catalyst: September average daily volume rose 51% from a year earlier, while total open interest rose 13%. The first number measures how many contracts changed hands on an average trading day; the second is a stock of outstanding contracts at a point in time. They answer different questions. A volatile month can create rapid position turnover without a comparable increase in positions carried forward. Neither number by itself is reported third-quarter earnings.
The gap is a useful teaching tool. Higher volume may reflect hedgers rolling exposure, speculators trading around headlines, or new positions; open interest helps test whether contracts remained outstanding. It cannot identify who holds them or whether a trade was profitable. Comparing the two growth rates is more informative than calling a 51% surge permanent demand. The release also says total Q3 ADV rose 31% year over year. That is a completed activity result, whereas the earnings conversion remains for ICE’s scheduled October 29 call to test.
Fundamental: the product mix matters more than the headline percentage
September’s breadth is striking, but it is uneven. ICE reports energy ADV up 26% and energy open interest up 4%. Brent ADV rose 51%, while European TTF gas ADV rose 50% with TTF open interest up 17%. Financials ADV rose 81% with open interest up 27%; interest-rate ADV rose 95% with open interest up 30%. Those pairs show that rate contracts saw both heavy turnover and a larger stock of outstanding risk, while energy trading rose much faster than aggregate energy open interest. They do not prove equal revenue contributions, because contract fees, trading days and mix differ.
Agriculture and metals provide a different comparison: ADV rose 44% and open interest 43%. Cocoa ADV increased 53% and its open interest 69%; sugar ADV and open interest rose 44% and 42%, respectively. ICE says sugar open interest reached a record 2.5 million lots on September 11. The broad September release is company-reported trading data. It does not disclose enough here to assign a precise incremental profit to any one product. A contract’s notional size is also not an exchange’s revenue. The October earnings test is whether this activity mix raised net transaction revenue after all relevant expenses and whether the more recurring businesses held their own.
The latest completed financial quarter, Q2 2026, is the anchor for that test. ICE reported $2.7 billion of net revenue and $1.4 billion of GAAP operating income. Exchanges contributed $1.464 billion of net revenue; fixed income and data services, $645 million; mortgage technology, $557 million. Across the company, recurring revenue was $1.353 billion, up 8% year over year, while net transaction revenue was $1.313 billion, up 2%. These are actual Q2 results, not a forecast for Q3. The point is that a 51% September ADV increase is not a 51% consolidated revenue forecast: ICE sells data, mortgage workflow and recurring services as well as transaction processing.
There is a second useful boundary. Q2 energy exchange revenue fell 13% year over year even as financials exchange revenue rose 21%, according to ICE’s release. That prior quarter is not evidence that September energy fees declined; it shows why category-level volume and realized dollars require separate measurement. On October 29, compare energy and financial transaction revenue with the September and Q3 activity pattern, then compare recurring revenue and expenses. A constructive report would show activity translating into stronger fee dollars without weakening the recurring base. A weaker report would show poor mix or expense growth absorbing the turnover. Both are scenarios, not reported Q3 outcomes.
Technical: the rebound has not reclaimed the daily trend average
The dedicated TradingView chart was captured at about 11:33 a.m. CT while the October 5 daily candle was unfinished. The Cboe One/BATS feed showed a $150.17 open, $151.29 high, $147.50 low and about $150.94 indicated last value at capture. That value is a snapshot, not a completed close or guaranteed execution price. The established 55-day EMA is near $153.15, above the indicated price, and RSI, the only lower panel, is near 41. The chart shows a rebound from the late-summer low that stalled before a durable reclaim of the mid-$150s.
The first constructive condition is a completed daily close above the $153.15 trend average, followed by a hold on a later retest. The drawn band around $155 to $158 and the recent high near $164 are separate overhead tests; one intraday cross would not satisfy them. A neutral case is continued rotation around $148 to $153 while investors wait for October 29 financial evidence. A completed close below the $147.50 October 5 low, followed by a failed reclaim, would invalidate the immediate recovery view and put the older downswing back in focus. A bearish continuation view would weaken after repeated closes above the average and then the $158 area. Earnings gaps can skip marked levels, so trade sizing and exit planning must account for slippage. This is an educational scenario map, not a claim of an HPT position or a price target.
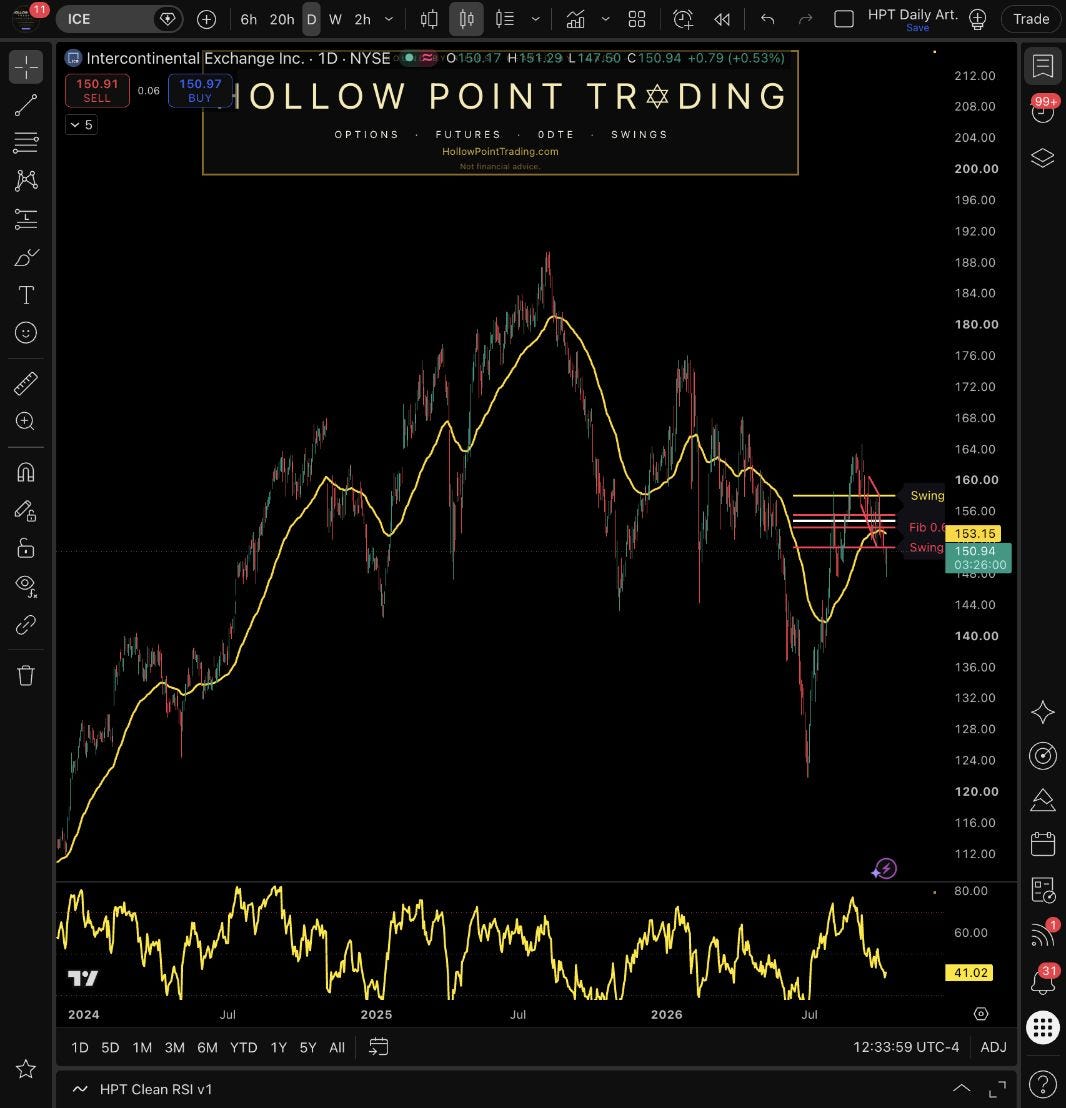
Source: TradingView NYSE:ICE, dedicated HPT publisher-owned tab; requested NYSE:ICE, observed NYSE display with BATS:ICE/Cboe One chart feed; 1-day timeframe; captured October 5, 2026 at about 11:33 a.m. CT. October 5 candle is unfinished. 55 EMA near $153.15 and RSI near 41 are visual readings. Drawn levels and indicated price are static, feed-specific observations, not a future close, guaranteed fill or HPT trade.
Sources: ICE September and Q3 activity release, October 5 · ICE Q2 2026 earnings release.
Educational research only. Futures, options and equities involve substantial risk. Historical volume and a static chart cannot predict earnings, direction or execution price; this is not personalized investment advice.
On October 29, which combination of transaction revenue, open-interest persistence and recurring growth would convince you ICE converted September activity into durable economics, and which completed daily close would invalidate your chart case?