
Two growth percentages can describe the same business collection and still tell different stories. Intuit’s online ecosystem provides a useful case: removing Mailchimp raises the reported growth rate. That gap tells us the excluded business diluted the combined percentage. It does not, by itself, reveal Mailchimp’s own growth rate. The missing ingredient is the size of the business in the earlier comparison period.
This October 3 Saturday evening edition examines that arithmetic and the next reporting checkpoint. U.S. equity markets are closed. The technical section uses a newly captured daily TradingView chart through the completed October 2 bar. Nothing here describes a live weekend equity session, and none of the chart observations proves why the stock moved.
Macro: A blended growth number can hide unequal exposure
A company serving business customers can carry several economic sensitivities inside one headline. Customer additions, price changes, spending intensity and product mix can each affect revenue differently. When a slower component sits beside a faster one, the combined growth number reflects both performance and the old revenue weights. A change in the blend can therefore alter the headline without telling us that every customer group experienced the same conditions.
The practical macro lesson is to avoid converting a company-level percentage into a universal verdict on small-business demand. A reported aggregate can remain positive while one component is flat, or improve because a faster component has become larger. That does not make the aggregate misleading; it makes the composition part of the explanation. Investors need the scope of the measure before assigning it a broad economic meaning.
For this setup, the next useful catalyst is new fiscal 2027 reporting that makes the separate businesses easier to compare. That is an evidence checkpoint, not a claim that a newly announced event occurred tonight. A weekend research note can prepare the questions; an open market and new company disclosures must supply the answers.
Fundamental: The three-point gap needs a weight
In its August 25 results release for the year ended July 31, Intuit reported fourth-quarter Online Ecosystem growth of 17%, versus 20% excluding Mailchimp. Global Business Solutions grew 14%, or 15% excluding Mailchimp. These are reported historical results. Effective August 1, Mailchimp became a separate operating segment and is to be reported separately in fiscal 2027. Its fiscal 2027 revenue guidance was $1.256–$1.266 billion, representing growth of minus 1% to 0%. That final range is management guidance, not an achieved result.
The calculation starts with prior-period revenue. If two businesses had equal revenue in the old period, their growth rates would contribute equally to combined growth. If one represented a much smaller share, its growth would have less influence. Subtracting the combined percentage from the faster business’s percentage skips that weighting step. The resulting gap measures the dilution of the combined rate, not the excluded business’s standalone rate.
Consider a purely hypothetical example, unrelated to Intuit’s actual segment sizes. Suppose the faster business generated $80 in the earlier period and then grew 20%, reaching $96. Suppose the slower business started at $20. For the total to grow 17%, combined revenue would need to reach $117. The slower business would then contribute $21, a 5% increase. The headline gap is three percentage points, while the slower business’s growth is 5%. Both statements can be true because the earlier weights were 80% and 20%.
Change the earlier weights and the implied slower growth changes. With $90 in the faster business and $10 in the slower business, the same 20% faster growth would produce $108. A $117 combined total would leave $9 for the slower business, a 10% decline. The same two headline growth rates are compatible with very different component results. These examples teach the calculation; they are not estimates of Mailchimp’s historical revenue or performance.
Fundamental: A reporting change improves the question, not the answer
Separate reporting can help investors compare a component directly rather than backing into it through an exclusion measure. The first discipline is matching the periods and boundaries. A newly displayed business line should be compared with an equivalent historical base, using any company-provided recast figures. Comparing a new scope with an old scope can create a false acceleration or slowdown.
The second discipline is distinguishing the forecast from the evidence. A roughly flat standalone outlook describes management’s expected direction. It does not settle whether future customer demand, product execution or pricing will meet that expectation. The relevant test is the next reported performance on a comparable basis, followed by an explanation of the drivers. A favorable headline deserves less confidence if the accompanying bridge is incomplete.
My inference is that the separate disclosure could reduce uncertainty about the blend. That is an analytical possibility, not a company promise of a higher valuation. A clearer table can reveal improvement, continued weakness or a less favorable mix. Transparency supplies a better measurement tool; it cannot predetermine what the measurement will show.
Technical: A rebound remains below the daily trend filter
The fresh NASDAQ-listed INTU chart uses TradingView’s Cboe One feed, identified as BATS:INTU, on the daily timeframe. The completed October 2 bar shows an open of $283.79, high of $284.20, low of $277.38 and close of $281.08. The established 55-day EMA reads $313.82, while RSI(14), the only lower panel, reads 37.11. These are feed-specific historical observations captured tonight, not a consolidated live quote.
The broader visible structure matters more than the attractive sound of a growth percentage. Price remains beneath the descending EMA after a long decline. RSI is below its 50 midpoint. That combination supports a cautious trend reading even though the right side of the chart shows a bounce off the recent low area. A rebound can improve the next few candles without reversing the larger structure.
For a constructive scenario, watch whether a future daily close clears Friday’s $284.20 high and whether a later pullback holds above that area. That would be an initial improvement in local price control. The wider recovery still needs to confront the $300 round-number area and ultimately the moving EMA, observed here at $313.82. The EMA will change as new bars arrive; tonight’s value should not be treated as a permanent future hurdle.
The base scenario is continued hesitation around the $277.38–$284.20 Friday range. Repeated crossings inside that small range would provide weaker evidence than a close and a subsequent hold outside it. A bearish scenario begins with failure below $277.38 followed by an inability to reclaim that boundary. That would bring the chart’s recent low zone around $262–$263 back into focus. The zone is an approximate visible reference, not a guaranteed support price or a measured downside target.
Risk: The thesis and the entry have separate invalidations
The local constructive price scenario is invalidated if an attempted breakout above $284.20 fails and closes back under $277.38. That would undermine the proposed local hold, even if the company’s longer-term reporting story remains interesting. Conversely, an improved chart would not establish the fundamental thesis if the next comparable standalone disclosure failed to support the anticipated clarity or performance.
Use a future session’s actual prices and spreads before assessing any entry. Overnight gaps can jump a planned stop, and options can lose value through time decay or changing implied volatility even when the stock moves somewhat favorably. This is an educational conditional map, with no position, fill, realized return or guaranteed outcome being reported. Risk size has to follow the actual distance to invalidation and the possibility of a worse execution price.
The central lesson is to keep the growth bridge, the standalone forecast and the chart response on separate lines of the research notebook. One explains the arithmetic, one describes management expectations, and one shows observed market behavior. Agreement between them must be demonstrated with later evidence
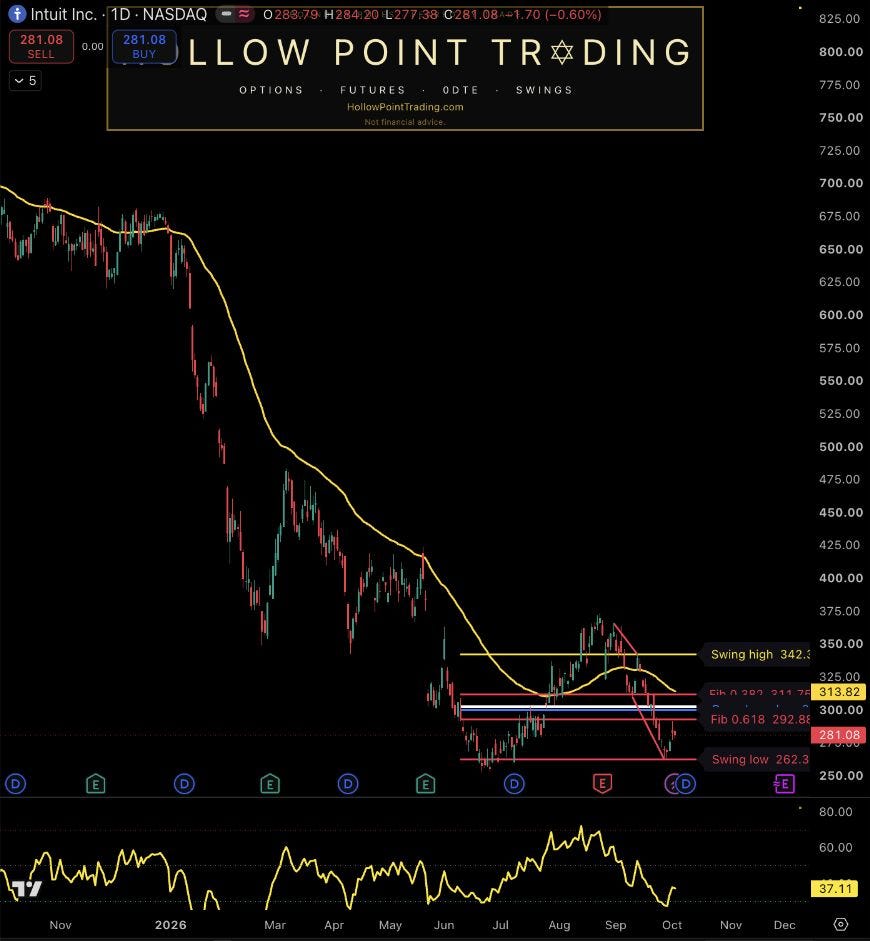
Source: TradingView, NASDAQ-listed INTU / Cboe One (BATS:INTU), daily (1D); captured October 3, 2026 at 7:05 p.m. CT. Latest completed bar: October 2. U.S. equity market closed. Established EMA(55) $313.82; RSI(14) 37.11, sole lower panel. Feed-specific historical snapshot; no live weekend equity price, causal proof or guaranteed outcome.
Sources and the next comparison
Intuit August 25, 2026 earnings release — reported fourth-quarter growth, fiscal 2027 reporting change and standalone Mailchimp guidance
TradingView — fresh publisher-owned daily chart captured October 3; technical observations and approximate zones
Discussion: Which comparable figure in the first separate Mailchimp report would most change your interpretation of Intuit’s blended growth, and what price behavior would you require before treating the current rebound as a durable recovery?