
Put two clinical percentages beside each other and the larger number seems to tell the story. That shortcut can fail before an investor reaches the revenue model. Johnson & Johnson’s latest psoriasis update provides a useful exercise: a result for completely clear skin and a result for clear or almost clear skin do not describe the same threshold. A change in the label changes the question the number answers.
This October 3 Saturday evening edition examines that comparison discipline for JNJ. U.S. equities are closed. The supporting TradingView image was captured anew tonight and ends with the completed October 2 daily candle. It shows the stock’s historical response framework, not an executable weekend quote, a clinical verdict or proof that a single release caused a move.
Macro: Healthcare headlines compete for a portfolio’s attention
A diversified healthcare company is evaluated through several lenses at once. Product evidence, commercial execution, financing conditions and the rest of the portfolio can move in different directions. A favorable study headline may improve one research question while leaving the investor’s earnings expectation unchanged. The size of the company and the contribution of the relevant product still matter.
For that reason, I would begin with the scope of the new information. Does it change the evidence about durability, the breadth of a measured response, or an economic assumption? Those are separate questions. A company announcement can supply useful evidence for the first two without supplying the missing inputs for the third. The headline should enter the model at the line it actually informs.
The market context tonight is preparation between sessions. There is no fresh equity price discovery to attach to this Saturday analysis. A researcher can still refine a comparison, identify the next financial checkpoint and define a chart condition. That work is useful precisely because the next open session can test the conditions without forcing a story onto every candle.
Fundamental: Read the outcome label before the percentage
J&J’s October 2 release reports Week 112 ICONIC-TOTAL results for ICOTYDE, also called icotrokinra. Among treated patients, it lists complete clearance of 60% for scalp psoriasis and 89% for genital psoriasis, using site-specific assessments. Its overall clear-or-almost-clear measure is 70%. These are different outcomes and populations, not three interchangeable descriptions of a single response rate. Source: J&J’s October 2 update.
The earlier October 24, 2025 release gives the comparison its necessary labels. At Week 52, scalp clear-or-almost-clear was 72%, while complete clearance was 57%. For genital psoriasis, those figures were 85% and 73%, respectively. The release also describes a placebo-to-treatment transition at Week 16. That design detail belongs beside any attempt to interpret a later time point. Source: J&J’s Week 52 disclosure.
The comparison worksheet: A percentage needs a passport
A tempting comparison would place the older scalp figure of 72% beside the newer 60% and call the difference deterioration. That would mix a broader outcome threshold with a stricter one. It would be like comparing the proportion of students who passed an exam with the proportion who earned the highest grade, then treating the lower second percentage as proof that performance worsened.
Even the better comparison, 57% and 60% for complete scalp clearance, needs restraint. The arithmetic difference is three percentage points. It is not proof of statistically significant improvement, and it is not necessarily a matched analysis of the same evaluable patients. The research worksheet should retain the population, time point, assessment threshold and handling of missing observations before drawing a trend conclusion.
For a hypothetical illustration, imagine 100 measured participants: 60 completely clear and another 12 almost clear. Complete clearance is 60%, while clear-or-almost-clear is 72%. Both percentages can be correct at the same moment. The twelve-point gap comes from the definition. This example is invented arithmetic for teaching purposes; it is not a reconstruction of the trial.
Now suppose the later measurement includes only 80 evaluable participants, with 48 meeting a threshold. The resulting 60% does not answer every question about the original 100. One would need to know why observations are missing and which analysis method is used. I am not asserting that this hypothetical pattern occurred in ICONIC-TOTAL. It shows why the denominator and analysis rules should travel with a percentage.
The investment bridge: Evidence does not fill a revenue cell
My inference is that longer follow-up can strengthen a durability discussion when the outcome definitions and analysis support that reading. The investment implication remains conditional. To estimate a commercial contribution, an analyst still needs a supported view of eligible use, paid activity, price realization, expenses and timing. A response percentage alone cannot be multiplied into JNJ revenue.
J&J’s next announced financial checkpoint is October 13. The company schedules its results release for approximately 6:45 a.m. ET and the investor call for 8:30 a.m. ET, or 5:45 and 7:30 a.m. CT. Those are planned times, not results already delivered. I would use the release and discussion to update disclosed financial assumptions, while keeping this clinical comparison in its own evidence file. Source: J&J’s conference-call announcement.
Technical: A year of advance meets a local breakdown
The newly captured daily chart shows NYSE-listed JNJ using Cboe One, observed as BATS:JNJ. Friday’s completed candle opened and topped at $259.38, reached $255.12 and closed at $256.03. The established 55-day EMA reads $263.21; RSI(14), the only lower panel, reads 32.28. All figures are historical observations from this feed.
The one-year frame matters. It shows a substantial rise from the prior autumn, then a right-side decline beneath the recent summer structure and the EMA. A longer advance and a weaker local setup can coexist. Calling the whole year bullish does not repair the recent loss of support; calling the latest decline weak does not erase the earlier advance.
The constructive scenario first requires a future daily close above Friday’s $259.38 high, followed by acceptance through the EMA near $263.21 and the displayed $265.04 swing reference. The EMA will change with new bars. A hold after a reclaim would provide better evidence than an intraday touch. Higher overhead references around $268.93 and $275 remain context, not guaranteed destinations.
The base case is stabilization within roughly $255.12–$259.38 while remaining below the EMA. That would describe a pause, with recovery still unconfirmed. The bearish scenario is a daily break beneath $255.12 and a failed attempt to regain it; the $250 round-number area then becomes a reassessment reference rather than a promised target. RSI near the low 30s describes weak momentum without establishing a bottom.
Risk: Make each inference answer to its own evidence
The proposed reclaim scenario fails if acceptance above the recovery area does not hold and price subsequently closes below $255.12. Separately, the commercial interpretation must be revised if later financial disclosures do not support the assumed contribution. A chart reclaim cannot validate an endpoint comparison, and a trial percentage cannot validate a trade entry.
Use actual session prices and liquidity before acting. Earnings can gap through a planned exit, and options add volatility and time-decay exposure. This is educational research with no position, execution or realized return claimed. It is not a treatment recommendation. The task is to identify which observation would change the analysis, rather than convert an attractive percentage into certainty.
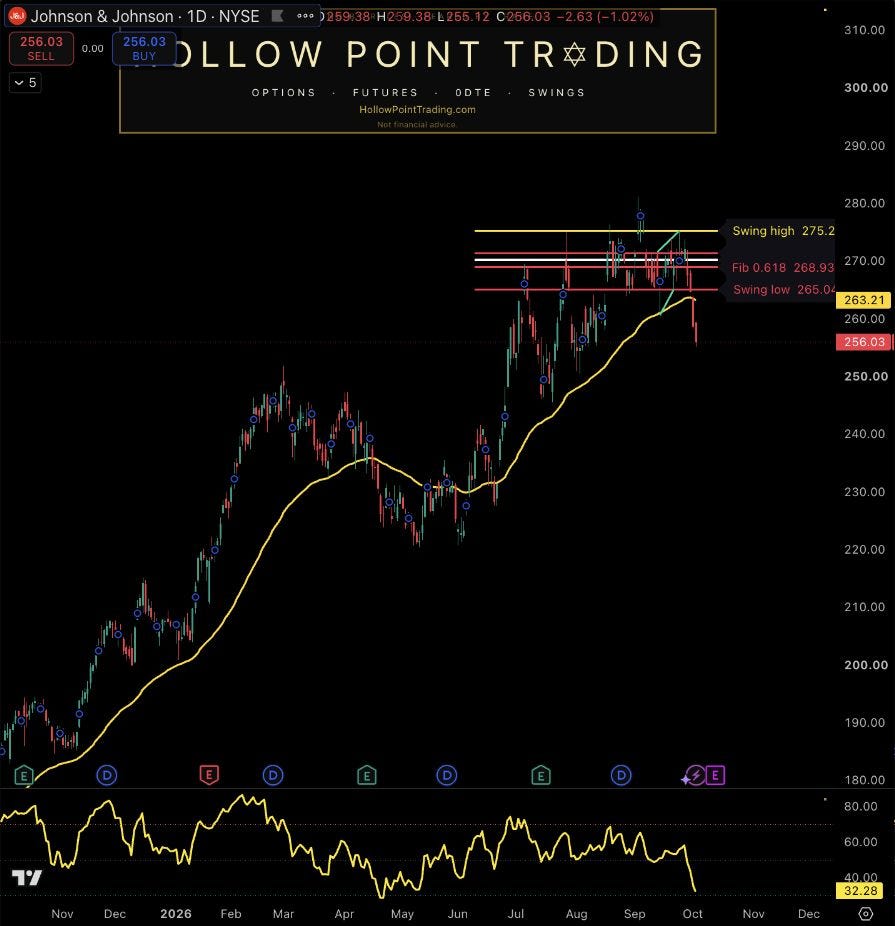
Source: TradingView, requested NYSE:JNJ, observed BATS:JNJ / NYSE by Cboe One; daily (1D). Captured October 3, 2026 at approximately 8:12 p.m. CT. Saturday U.S. equity market closed; latest completed candle October 2. One-year historical frame; established EMA(55) $263.21 and RSI(14) 32.28, the sole lower panel. Levels are historical or explicitly identified round-number references. Static feed-specific image does not establish causation, live weekend prices or executable terms.
Sources and discussion
J&J October 2, 2026 — Week 112 outcome definitions and results
J&J October 24, 2025 — Week 52 results and study-design context
J&J August 31, 2026 — October 13 results-release and call schedule
TradingView — newly captured publisher-owned JNJ daily chart
Discussion: Which missing detail would you require before treating the Week 52–112 comparison as an investment-relevant change, and what price behavior would convince you that JNJ’s $263–$265 recovery area is holding?