
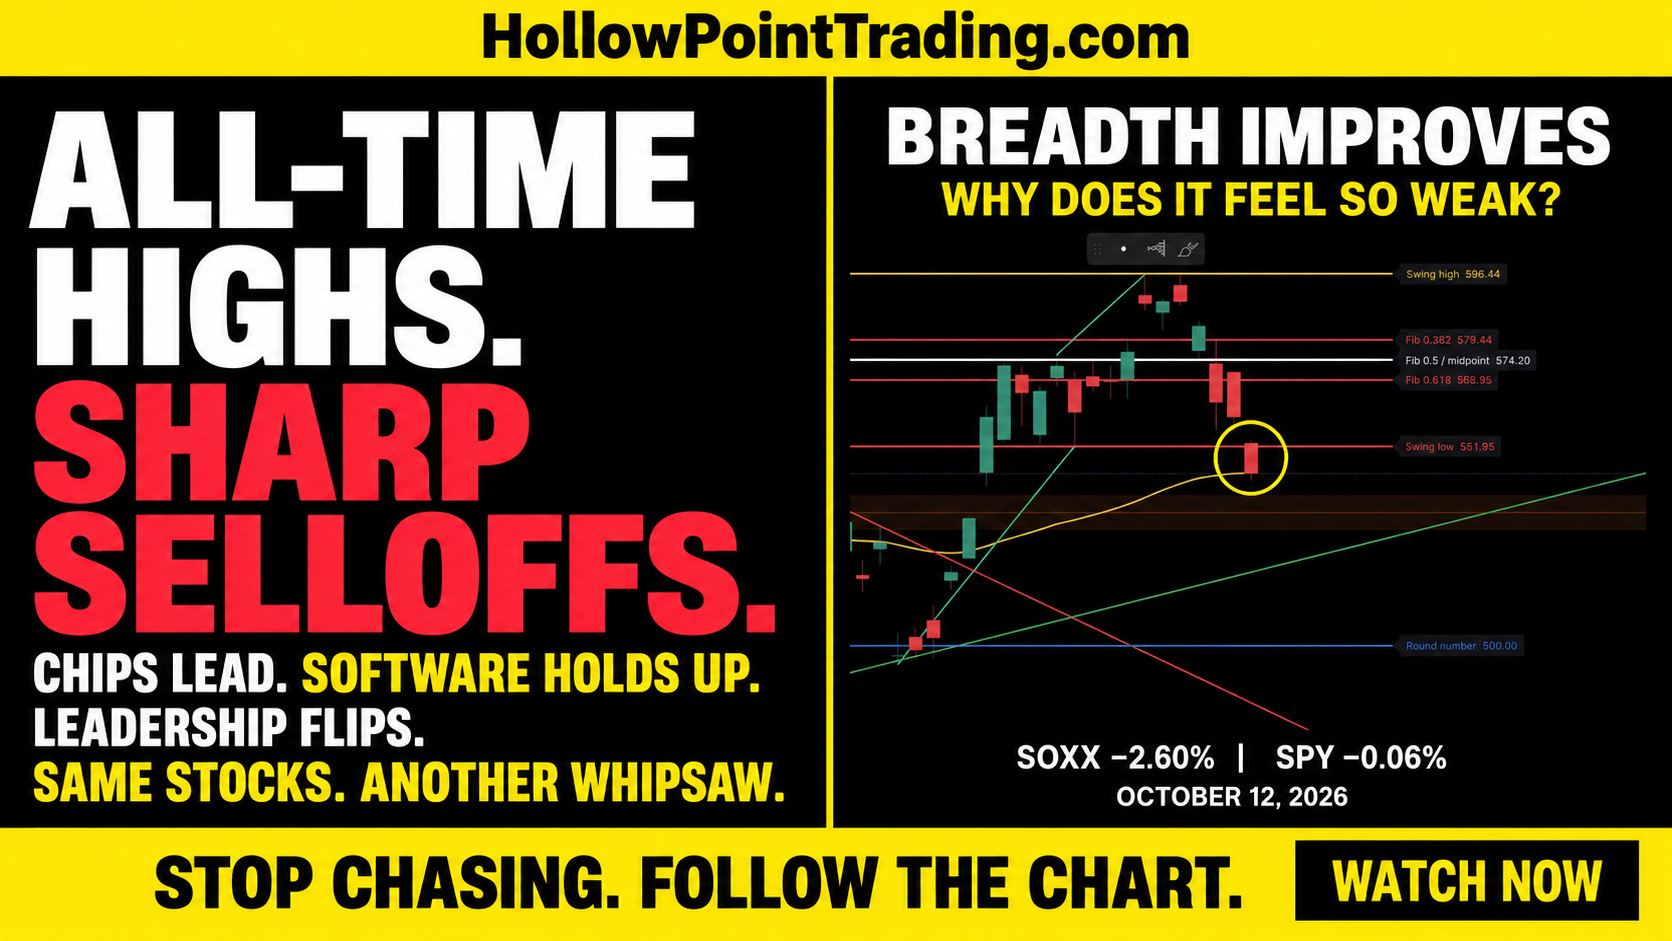
Hollow Point Trading • October 12, 2026 regular-session recap. Prices and levels below are dated observations, not live quotes.
One week, everybody wants chips. Memory stocks have already made a huge move, the charts look strong, and the same names dominate the conversation. Then those names get hit. Another group holds up better. People switch their attention, chase the new relative leader, and feel blindsided when that trade starts moving against them too.
The frustration is real. But “the market” is not one trade. A strong index, a weak semiconductor chart, improving participation and a stock-specific selloff can all exist at the same time. If your entire market view comes from the three stocks on your watchlist, those conditions look contradictory. Once you separate the index, the group and the individual stock, the picture becomes much easier to read.
Monday gives us a concrete example: SOXX fell 2.60%, Micron fell 3.88%, and SPY slipped just 0.06%. Eight of eleven sector ETFs finished higher. Both breadth measures we tracked improved. Yet software, the relative winner against chips, also finished lower.
That is the story. The broad market was more resilient than the popular chip trade, but resilience was uneven. This article explains how to read that split without inventing a money-flow story, treating every bounce as a recovery, or buying yesterday’s winner because its earlier move was impressive.
WATCH THE FULL CHART BREAKDOWN: Stock Market Whipsaw—New Highs, Sharp Reversals, What’s Really Going On?
1. A record-high headline and your portfolio can tell different stories
An index can reach a high without every constituent reaching a high. In a capitalization-weighted index, the largest companies have much more influence than the smallest. A strong move in a few heavily weighted names can offset weakness across many others. Conversely, participation can improve outside the largest names while the index makes little progress because its biggest weights are struggling.
Separate three questions: Where is the index trading? How many stocks are participating? Which groups are leading over the time window that matters to your trade? The first is about price, the second about breadth, and the third about relative performance. None is a substitute for the others.
The all-time-high/rapid-reversal theme describes the experience we are examining; it is not a claim that every instrument made a fresh record on October 12. Nor does Monday’s evidence prove leadership changes on a fixed every-other-week schedule. A pattern can feel repetitive without being a reliable calendar rule.
This matters because a trader can be right about broad-market resilience and still choose a poor expression of it. “I think the S&P holds” does not automatically justify buying the weakest semiconductor stock. Your thesis and your instrument need to match.
2. Monday’s scoreboard: selective resilience, not universal strength
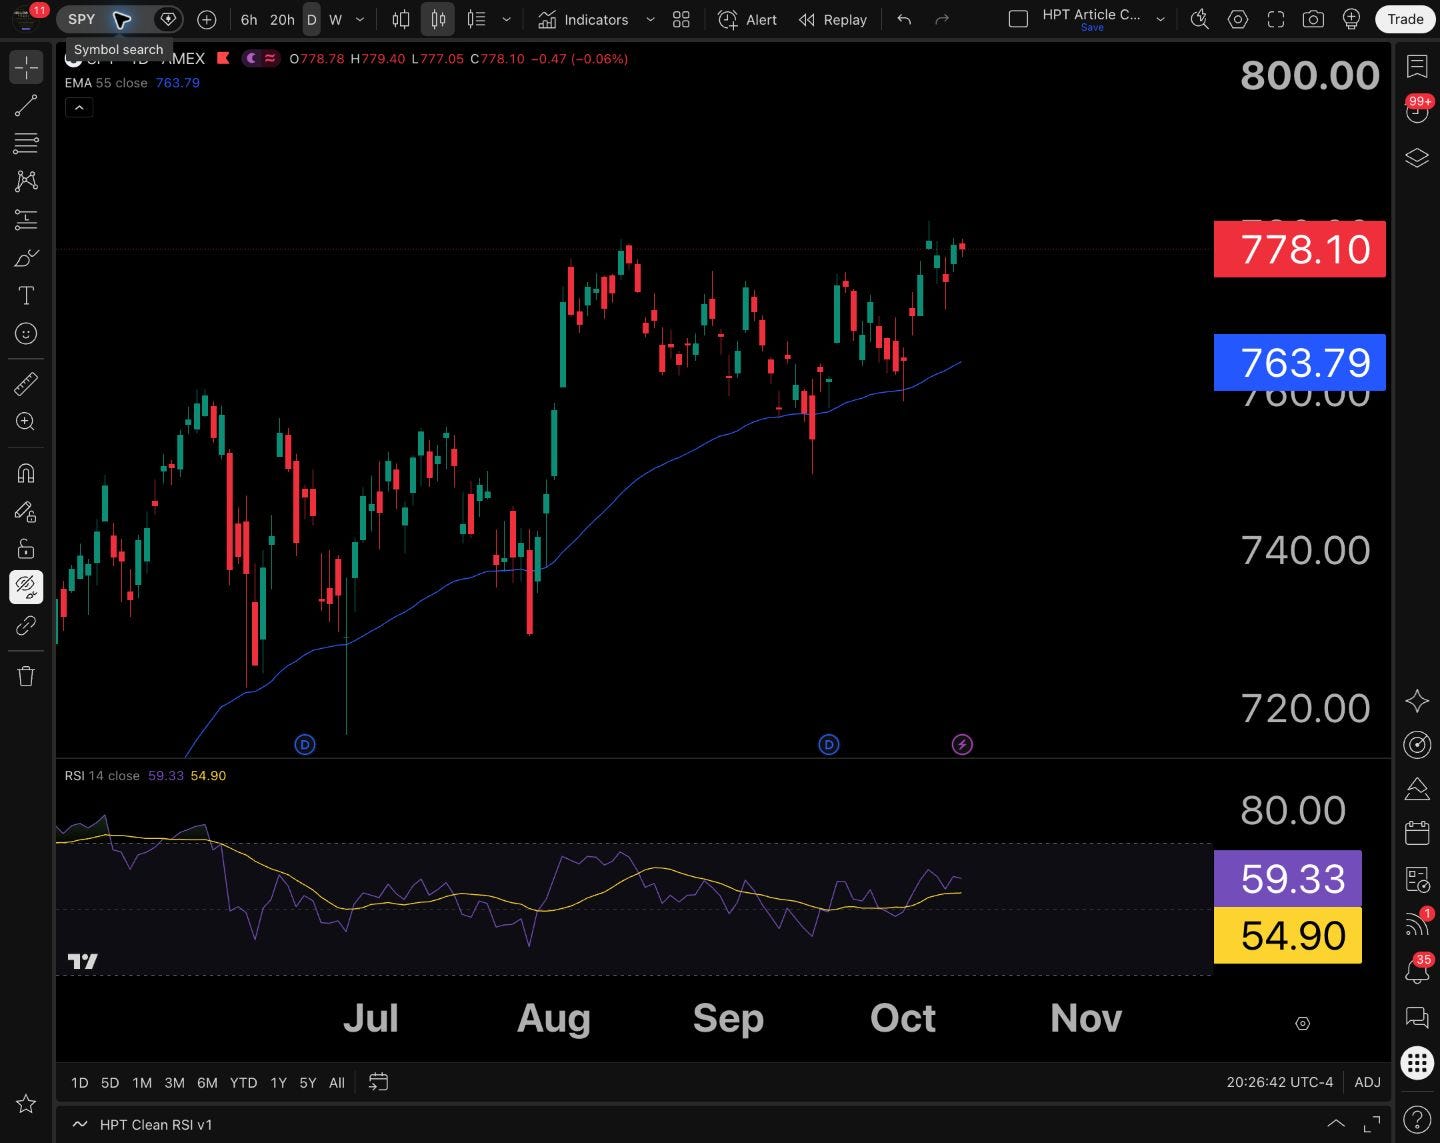
SPY: 778.10, −0.06%. Large-cap S&P resilience.
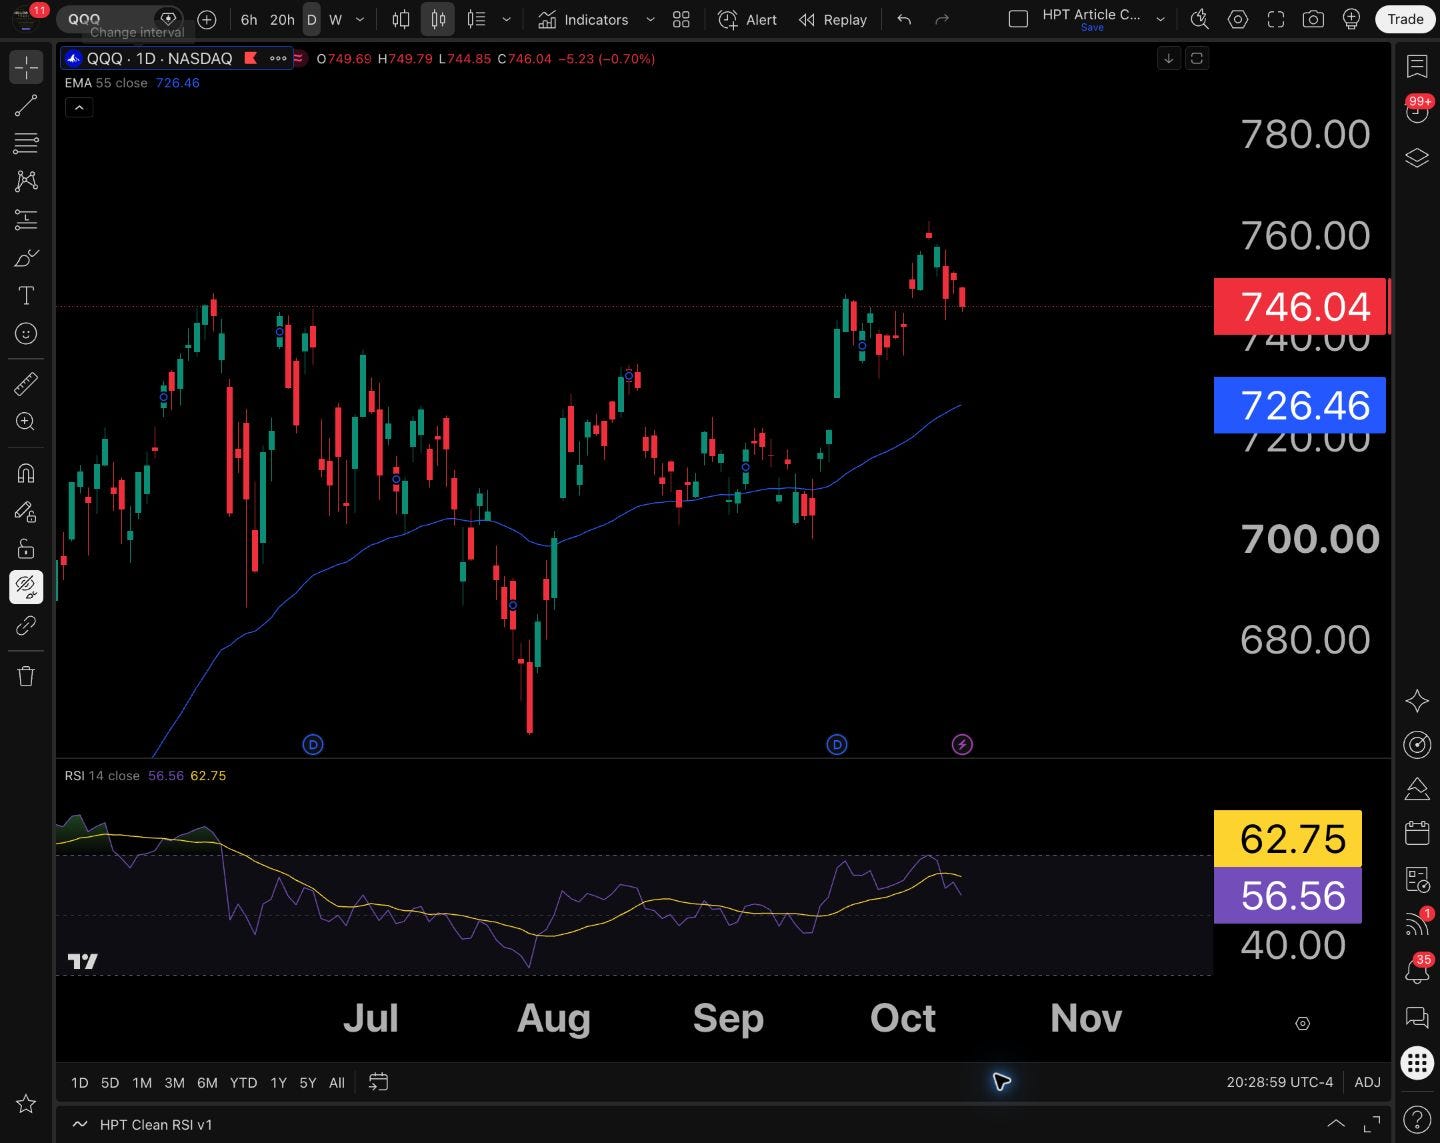
QQQ: 746.04, −0.70%. Nasdaq-100 price response.
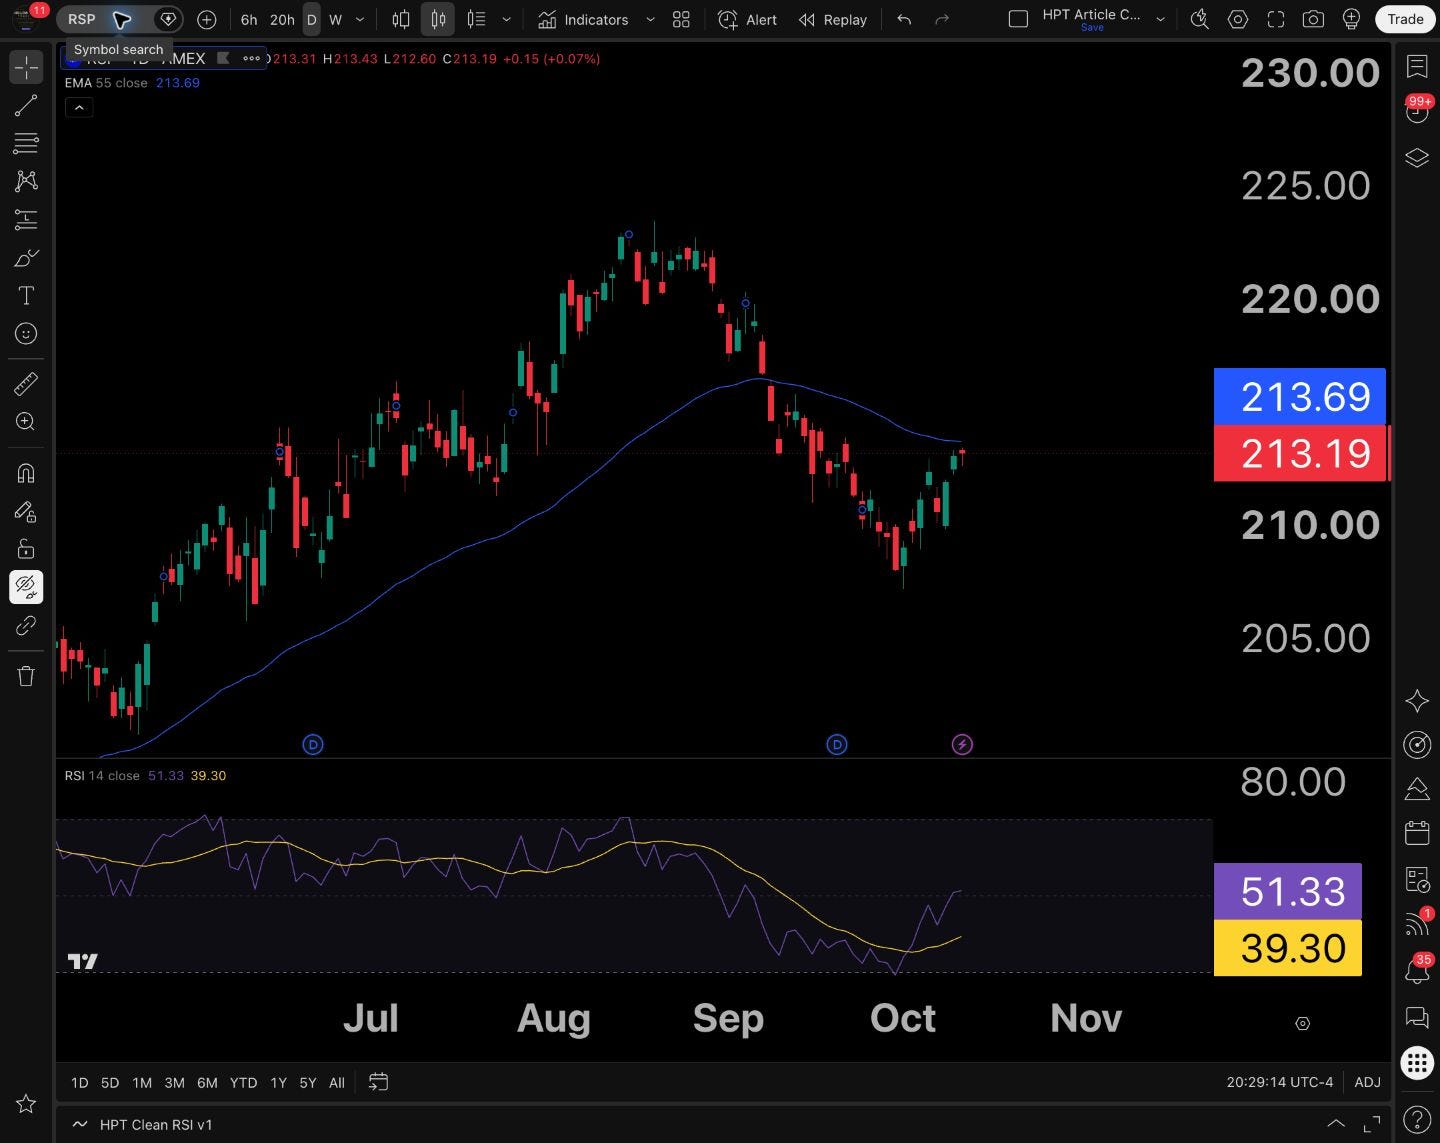
RSP: 213.19, +0.07%. Equal-weight comparison.
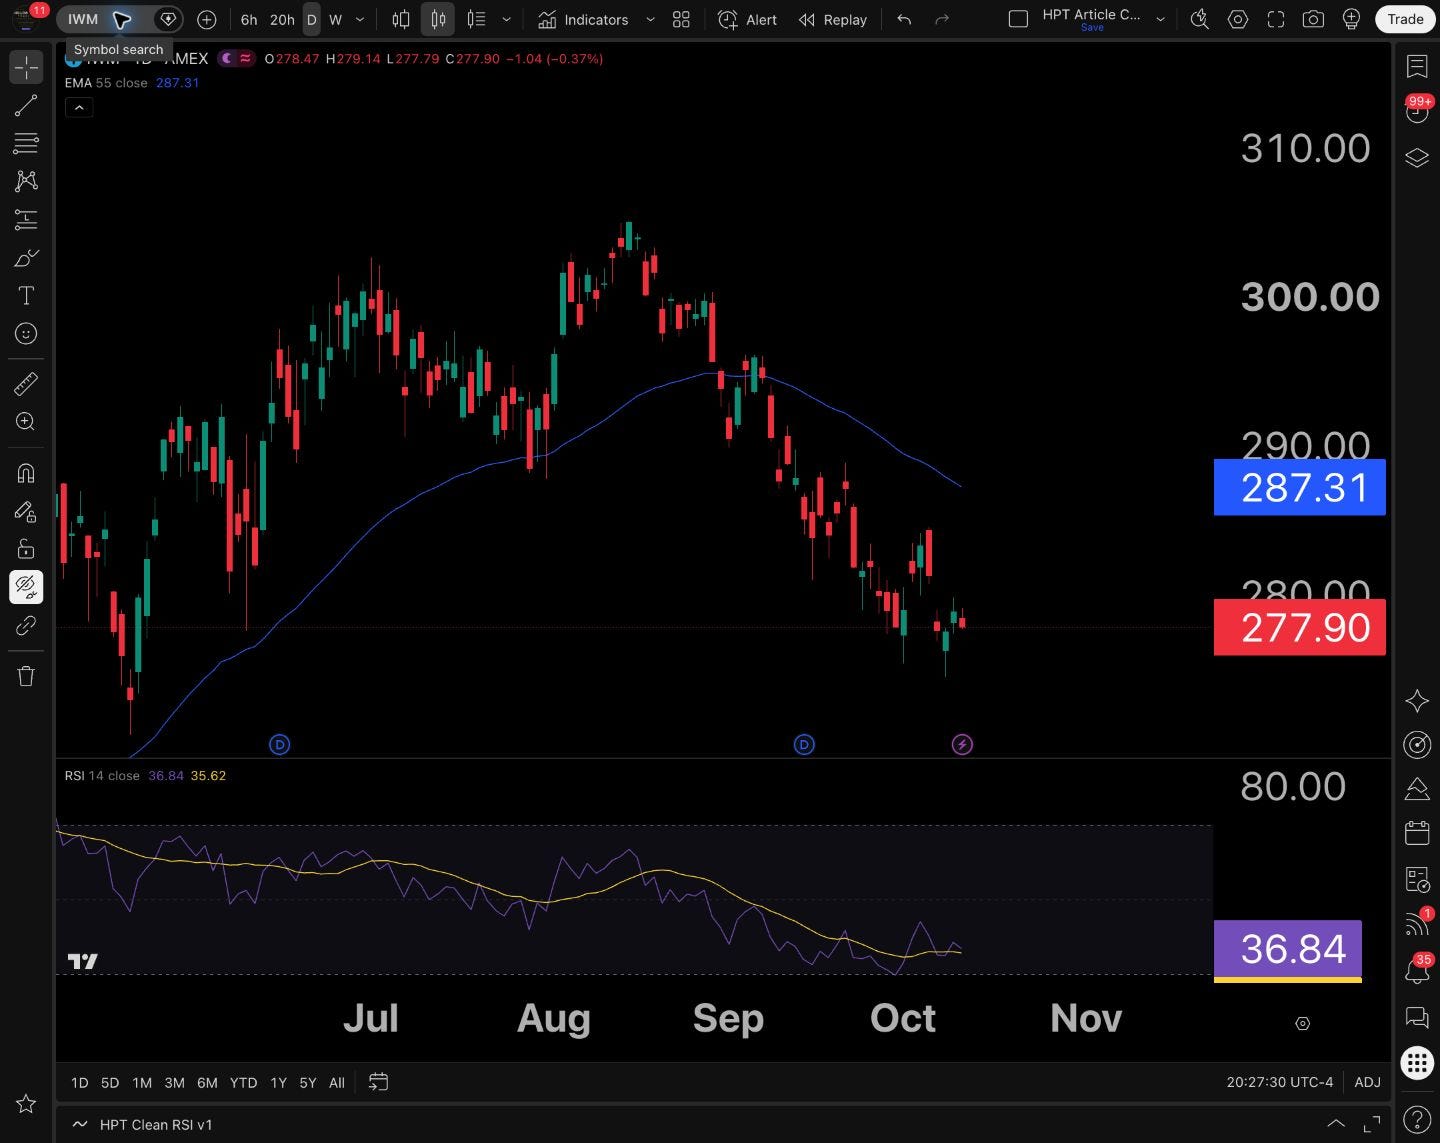
IWM: 277.90, −0.37%. Small-cap participation.
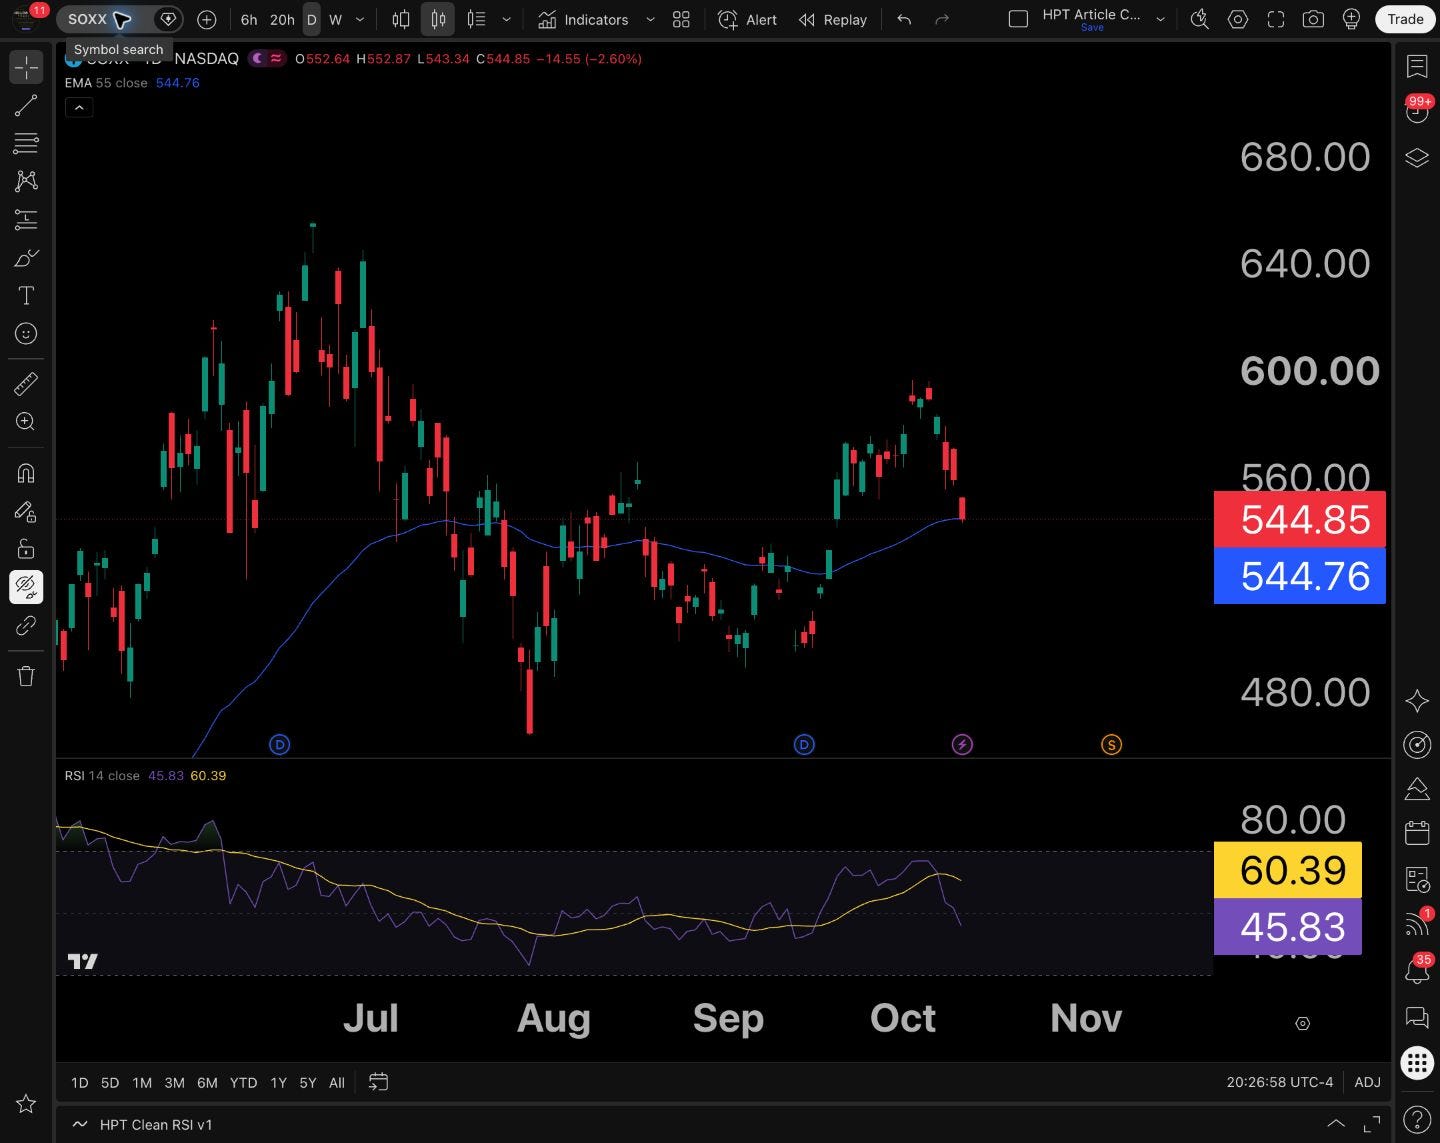
SOXX: 544.85, −2.60%. Semiconductor group pressure.
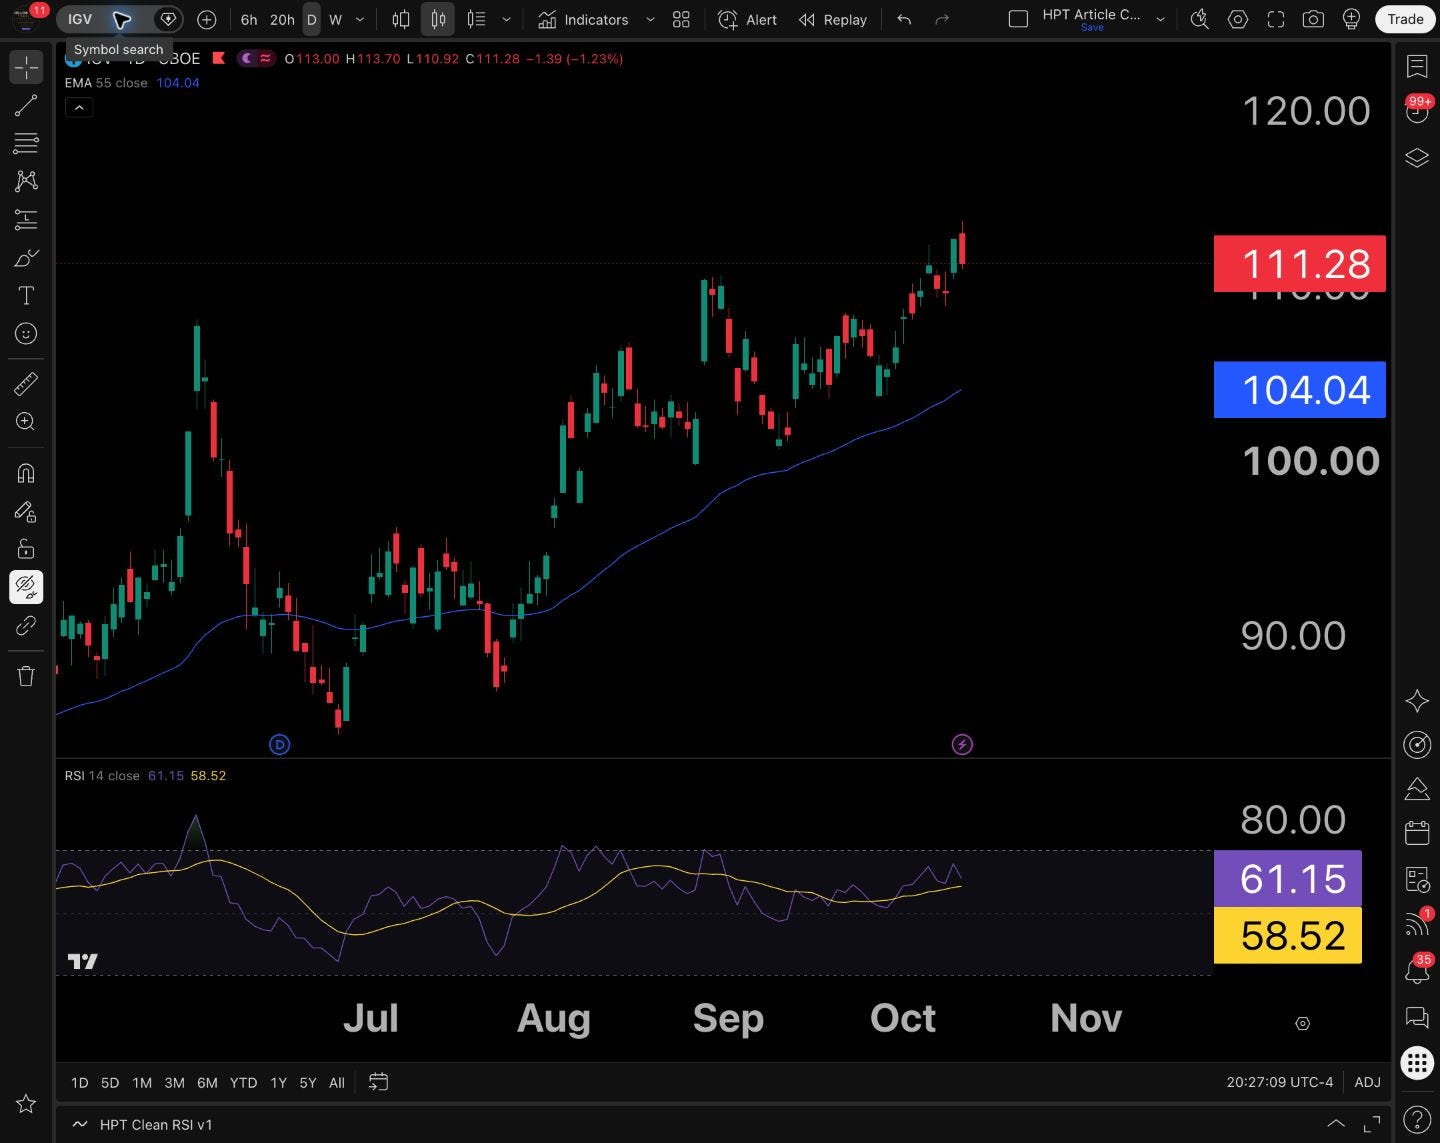
IGV: 111.28, −1.23%. Software relative resilience.
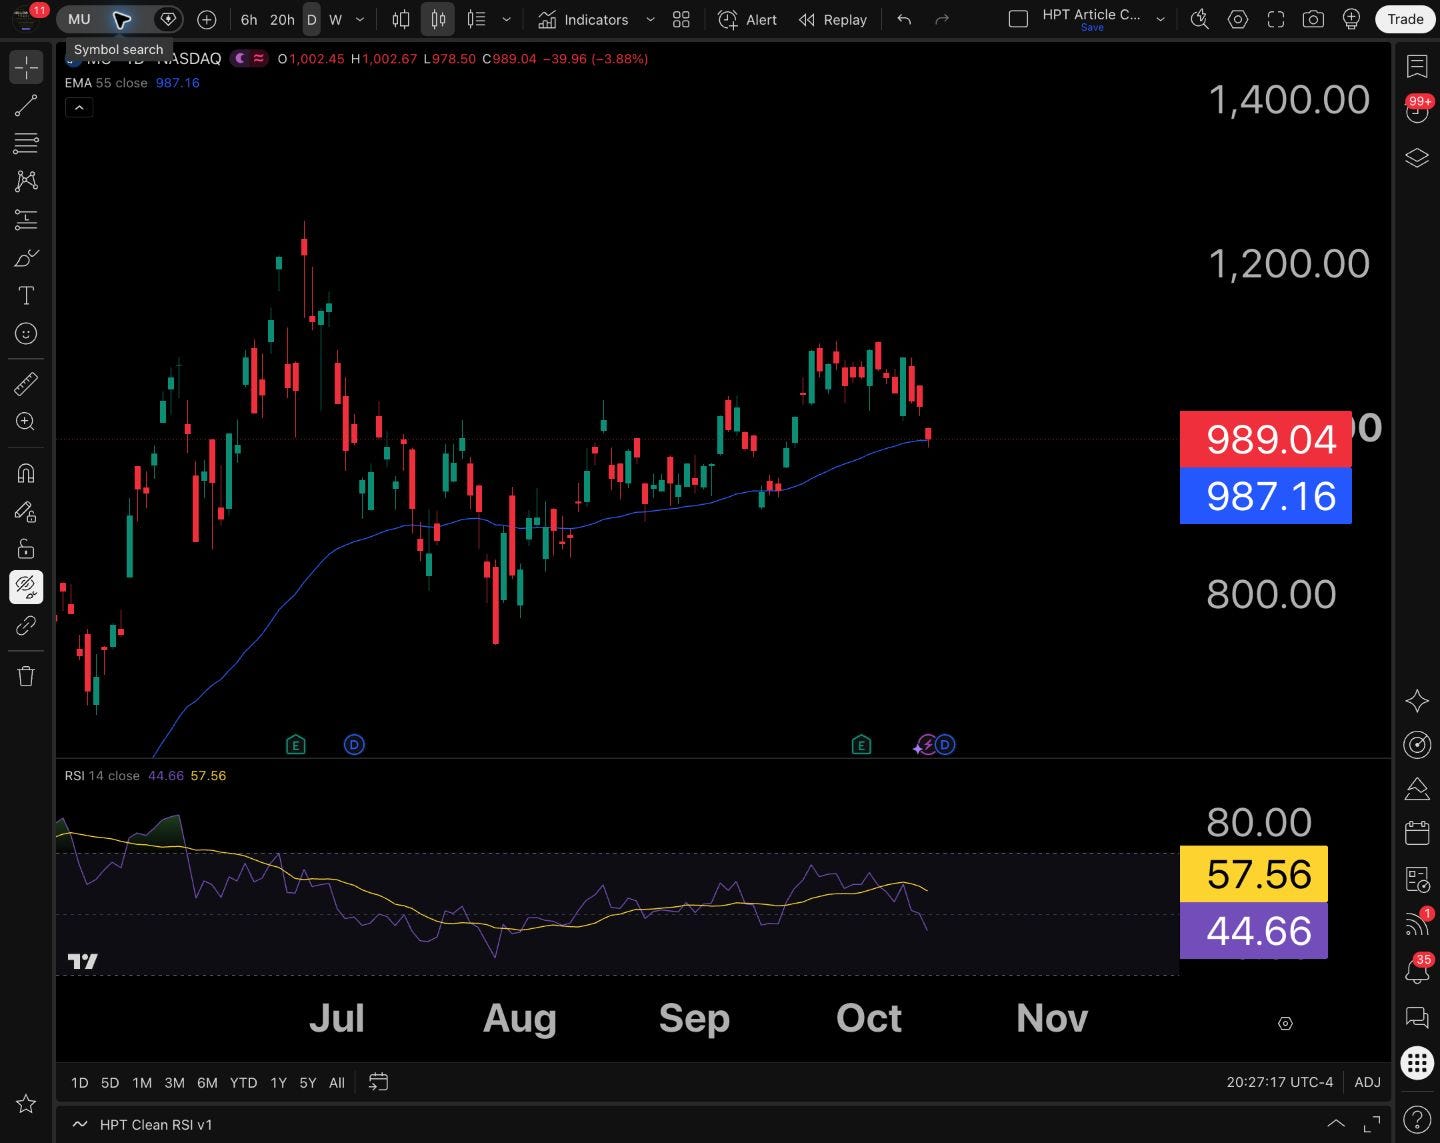
MU: 989.04, −3.88%. Memory-stock response.
Source: the dated native TradingView observations retained for this HPT recap. ETF market prices are distinct from fund NAVs and cash-index levels.
Energy gained 1.43%, staples gained 1.17%, and communication services gained 0.97%. Technology fell 1.22%. Eight positive sectors against three negative sectors help explain why a weak chip screen did not translate into an equally weak S&P session.
RSP’s advantage over SPY was modest: roughly 0.13 percentage points. Useful evidence, but not a declaration that equal weight has taken over leadership for the next month. IWM declined and closed near its session low, below its roughly 287.31 daily 55-period exponential moving average. Small caps did not confirm an enthusiastic, market-wide risk expansion.
Read the combination, not the most exciting individual number: more groups held up, but the repair underneath the index remained incomplete.
3. Breadth improved. That does not mean concentration disappeared.
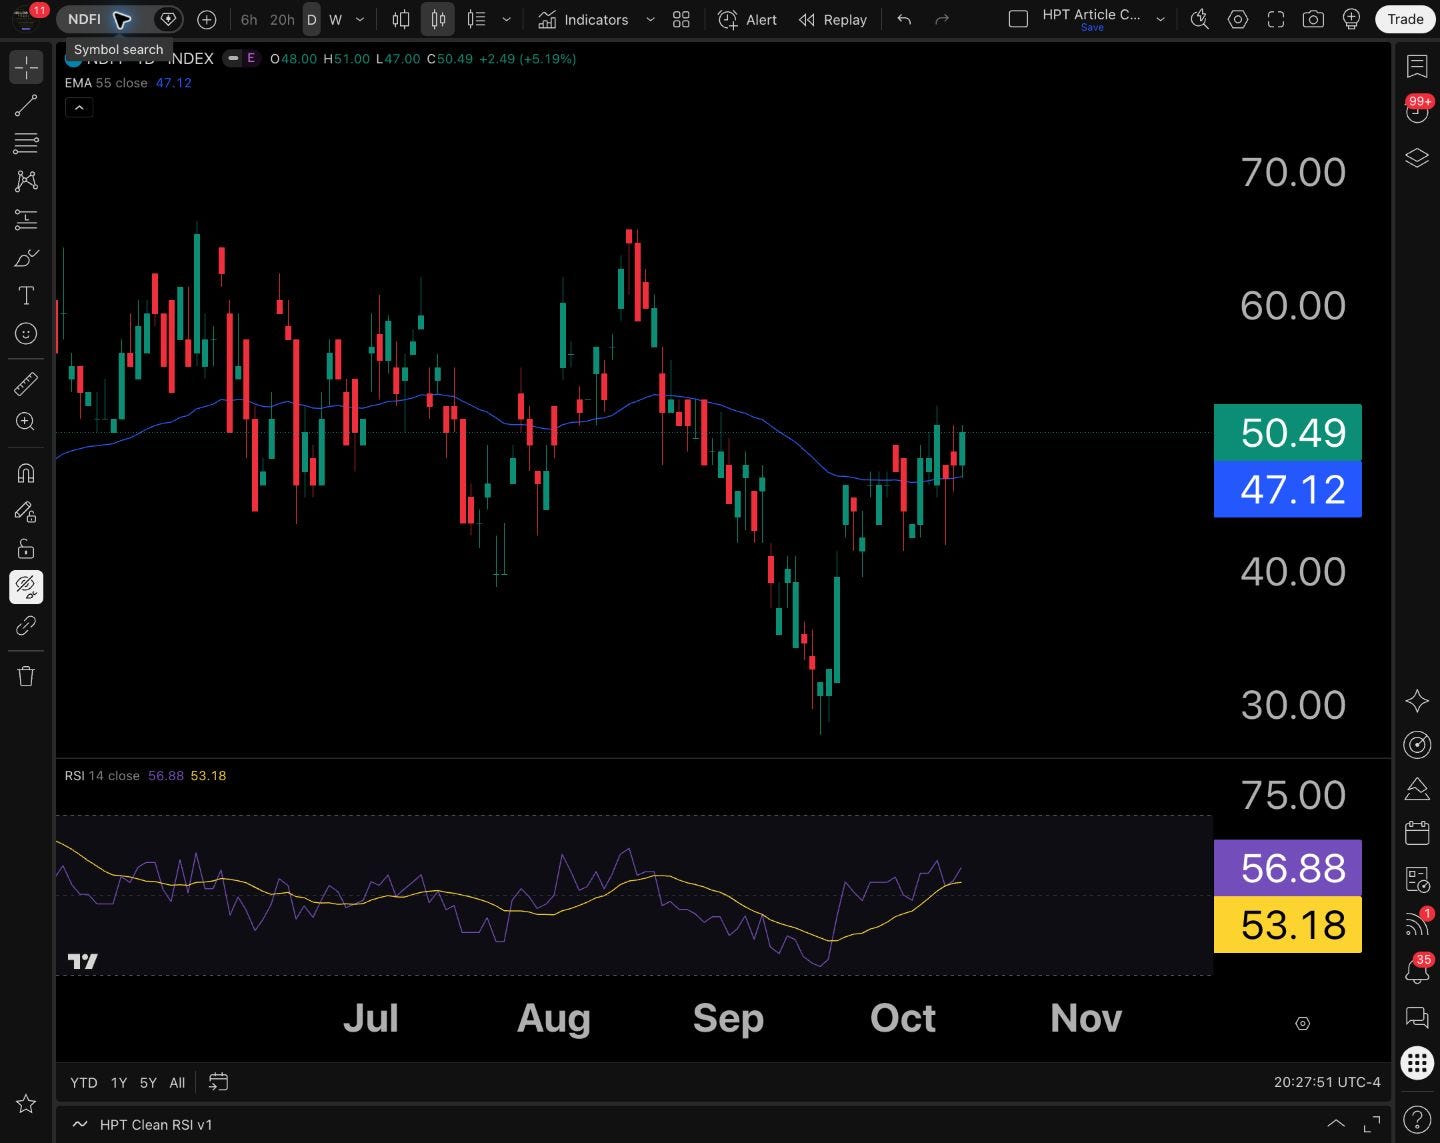
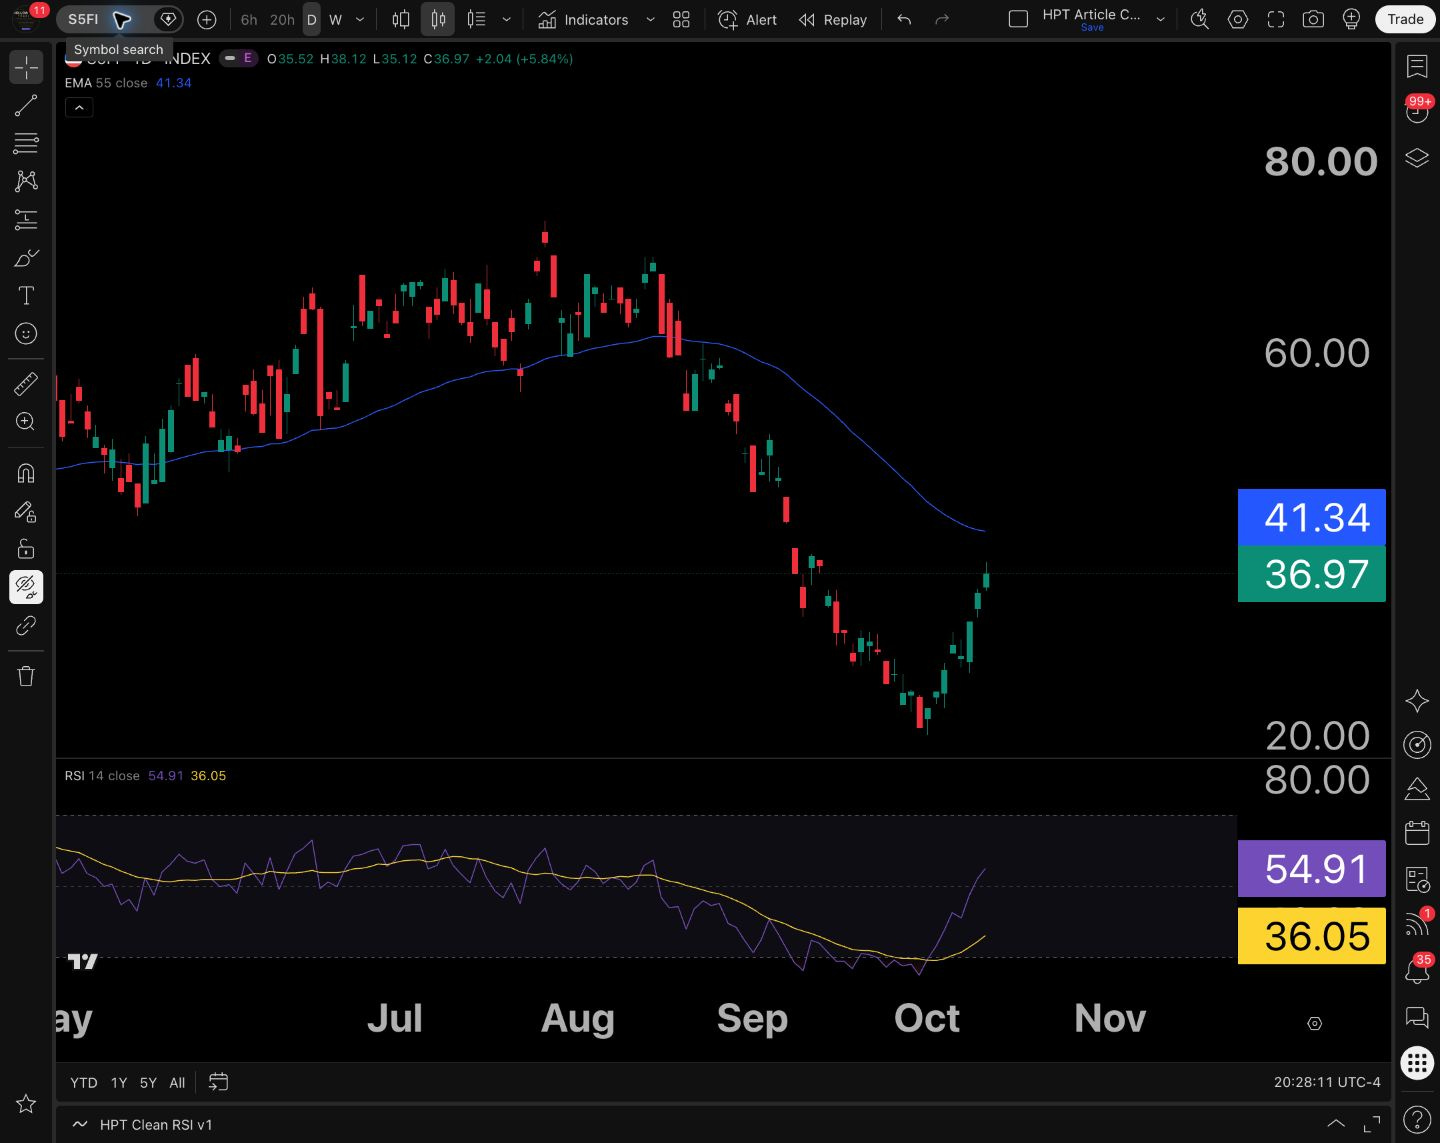
The Nasdaq-100 breadth measure, NDFI, increased from Friday’s 48.00% to 50.49%. The S&P measure, S5FI, increased from 34.93% to 36.97%. These track the share of members above their 50-day moving average.
The changes were +2.49 and +2.04 percentage points, respectively. Those are changes in participation, not index returns. Nasdaq participation moved just above half. The S&P measure still had substantially fewer than half its members above that trend reference.
That supports “participation improved.” It does not establish “the market is fully repaired,” “concentration is gone,” or “every sector is breaking out.” Concentration is about the distribution of index weights or contributions; breadth is about how many constituents meet a defined condition. Better breadth can coexist with a concentrated index.
There is another subtlety: a moving average changes as its lookback window rolls forward. A count above the average is a useful trend measure, but not a direct measurement of fresh dollars entering stocks. It should be paired with price structure and a consistent sequence of observations.
The stronger version of the broadening argument would show continued participation gains, equal-weight confirmation, and previously weak groups maintaining recoveries. Monday offered a step in that direction, not the entire journey.
4. Why I start with the index, then the sector, then the stock
The backwards process starts with attachment: “I want Micron,” “I want Nvidia,” or “Microsoft always comes back.” Only after selecting the name does the trader look for evidence to justify the entry. A chart bounce becomes the whole thesis, even if the relevant index has failed a recovery and the industry is still making lower lows.
My order is a filter. Start with the index to establish the trading environment. Compare the sector or industry with that index to identify leadership or weakness. Then select a stock that has its own setup, peer strength and invalidation level.
Nvidia and Micron belong to both the S&P 500 and Nasdaq-100; they are not Russell 2000 small-cap holdings. Membership in both large-cap indexes is normal. The baskets differ in composition and weighting. The Nasdaq-100 is a basket of large Nasdaq-listed nonfinancial companies, not every company trading on Nasdaq. Invesco’s QQQ composition reference.
State Street’s October 9 index-weight snapshot put Nvidia around 8.25% and Micron around 1.73% of the S&P 500. Those are dated index weights, not October 12 closing weights and not exactly the ETF portfolio weights. An equal percentage move in the larger holding has greater index influence, all else equal. State Street’s SPY/index reference.
IWM asks a different question. It represents small-cap exposure, including both growth and value businesses. Financing costs and refinancing access can matter especially to businesses with weaker balance sheets, but “small cap” does not mean every company has the same rate sensitivity. The balance sheet, profitability and funding calendar still matter.
This process does not forbid buying a stock in a weak market. It makes you identify the evidence that the stock is an exception instead of assuming that a familiar name deserves special treatment.
5. Software versus chips: the ratio explains the split
For this comparison, use consistent instruments: IGV for the software-focused ETF, SOXX for the semiconductor ETF, and QQQ for the Nasdaq-100 ETF. SOXX is not the SOX cash index; its issuer identifies its benchmark as the NYSE Semiconductor Index. SOXX fund details.
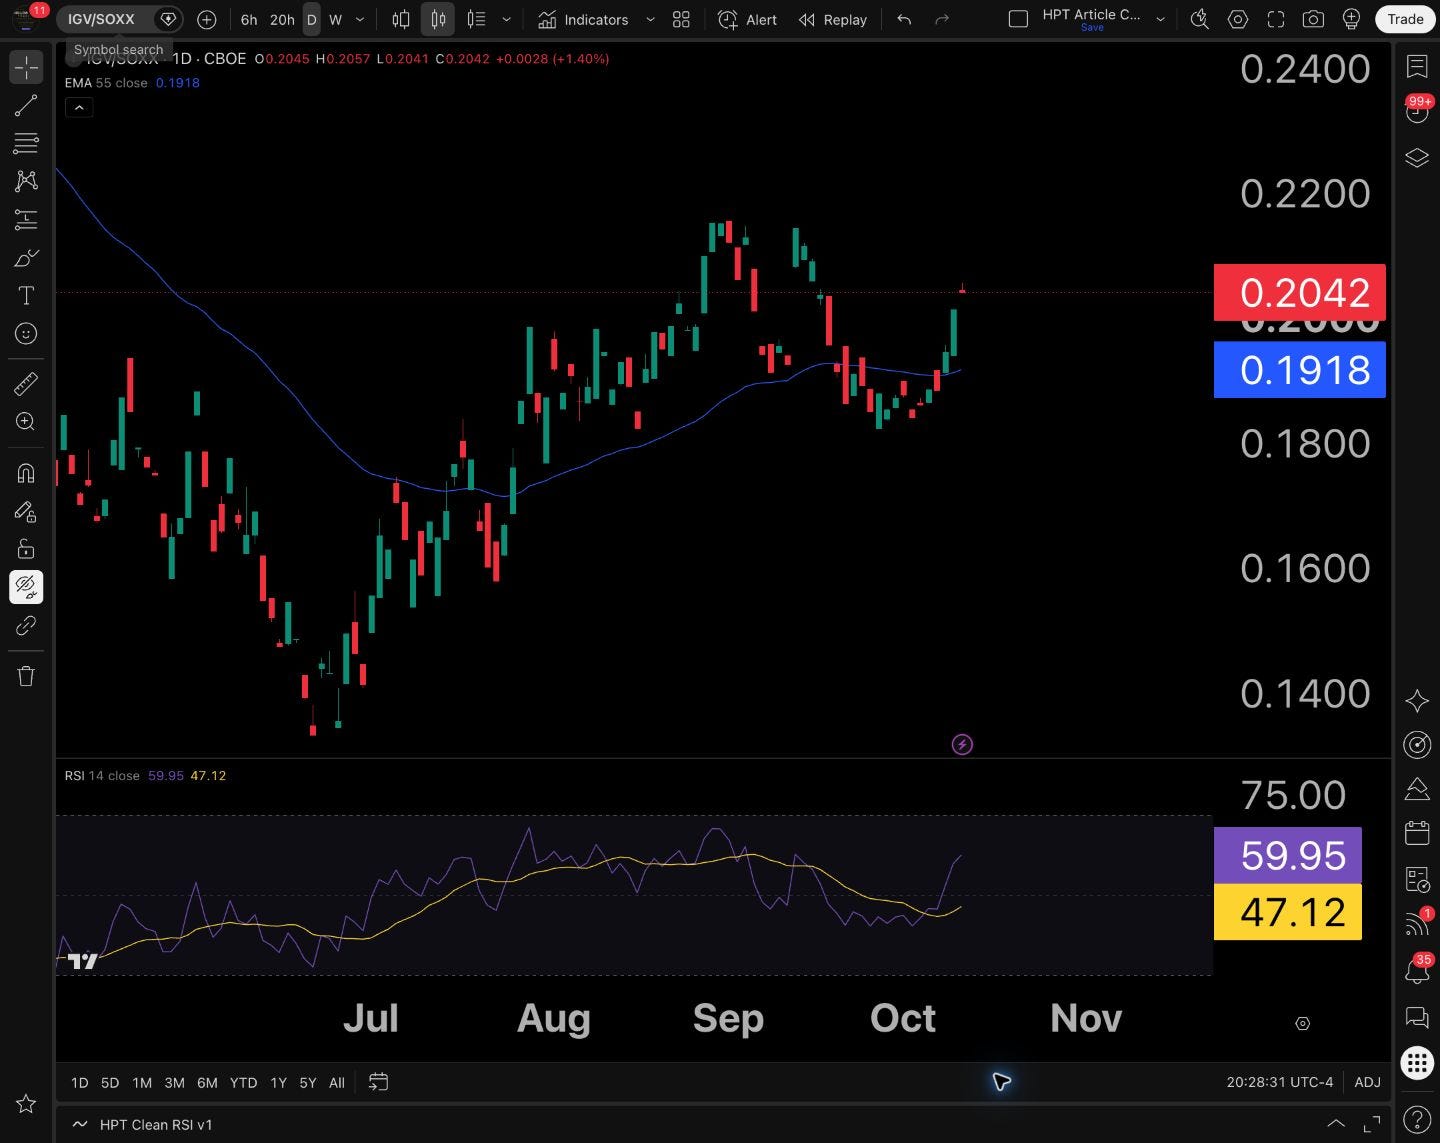
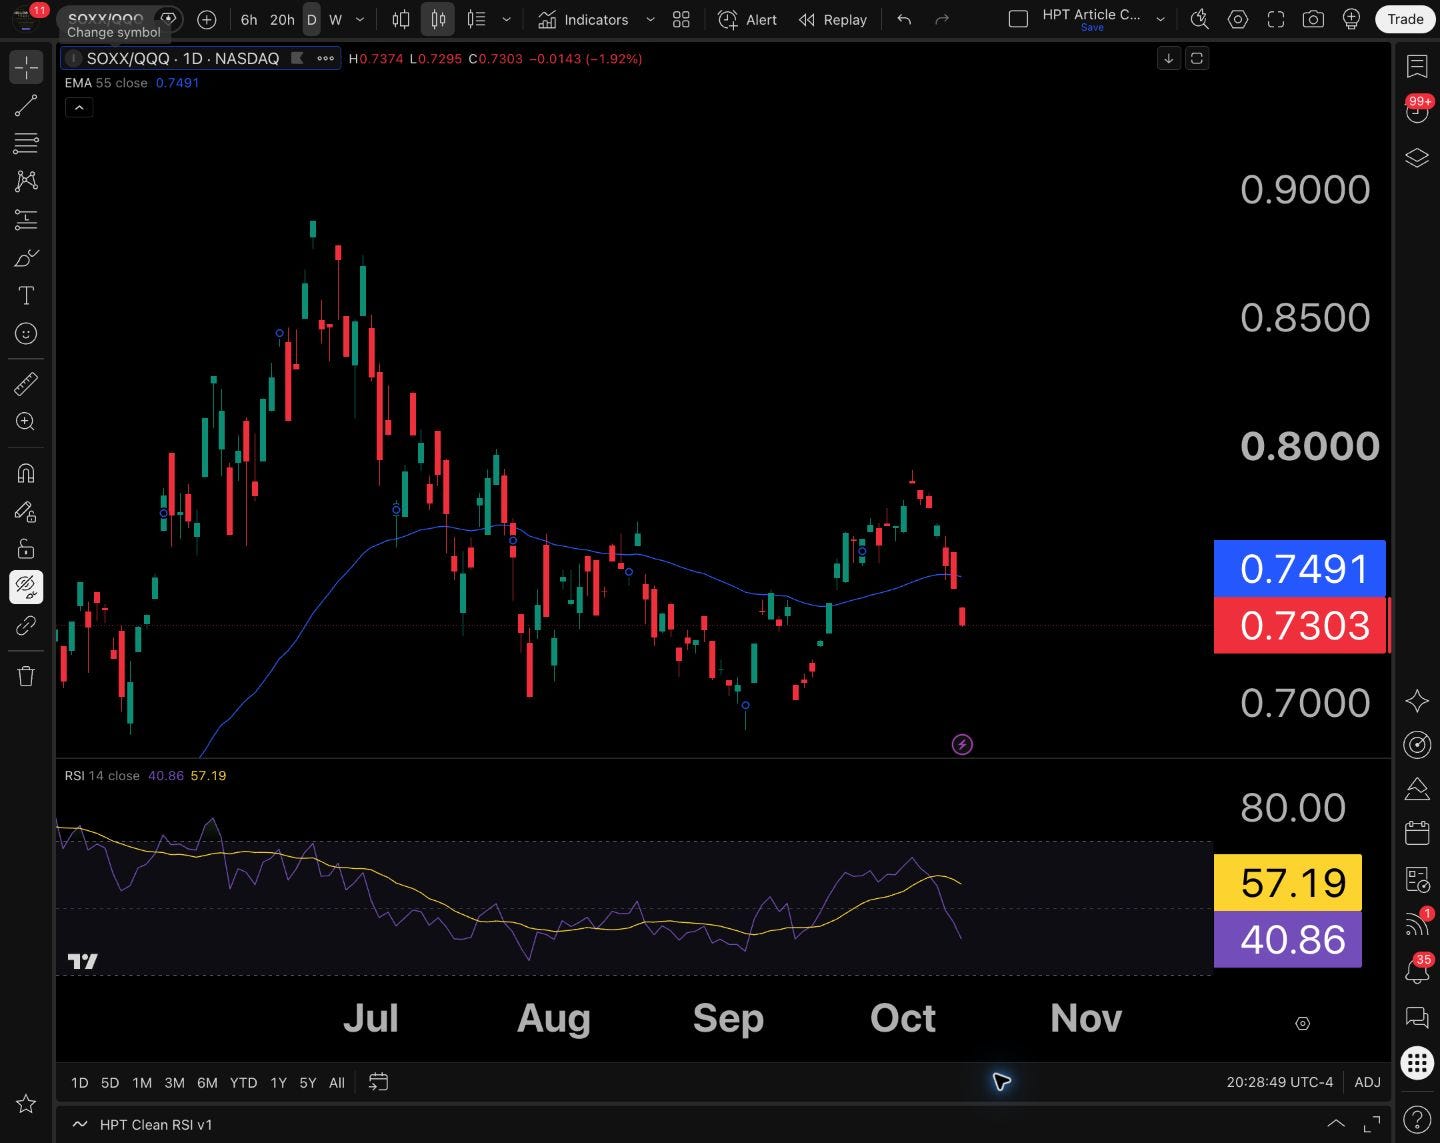
IGV ÷ SOXX asks whether software is gaining or losing ground against that chip basket. SOXX ÷ QQQ asks whether chips are gaining or losing ground against the broader Nasdaq-100 ETF. A rising ratio favors the numerator relative to the denominator; it does not tell you both funds are rising.
Monday’s arithmetic makes that distinction impossible to ignore. IGV fell 1.23%; SOXX fell 2.60%. Using the rounded session returns, (0.9877 ÷ 0.9740) − 1 is approximately +1.41%. Software gained relative ground while a holder of either fund experienced a down session. The chart ratio’s roughly +1.40% reading differs slightly because displayed daily returns are rounded.
Similarly, SOXX lagged QQQ: (0.9740 ÷ 0.9930) − 1 is approximately −1.91%. That is relative underperformance, not a count of declining semiconductor stocks. Breadth requires constituent-level participation data.
These ratios also do not prove that a particular institution sold chips and bought software. We can observe relative price behavior. Identifying actual fund flows or investor motives requires additional evidence. “Rotation” is useful shorthand for changing relative leadership, provided we do not turn it into an unsupported transaction story.
Software is more than Microsoft. The October 9 IGV holdings reviewed for this recap included Palo Alto Networks, Palantir, CrowdStrike, Microsoft and Oracle. The fund also has some interactive-media exposure. Know the basket before using it as shorthand for a business model. IGV issuer reference.
6. An old leader can have a huge advance and still be weak now
iShares reported SOXX’s year-to-date total return at +89.02% through September 30, while the three-month return through the same date was −11.26%. Both can be true. A powerful earlier advance and a later drawdown measure different windows. Neither cancels the other. These are issuer total-return figures, not Monday’s price return or a verified contribution to an index record. Dated SOXX performance tables.
That is why “chips already ran” is context, not a buy signal, and “chips are red today” is not a complete long-term thesis. The decision depends on the timeframe, location and evidence you are trading.
Monday, SOXX closed at 544.85 against a daily 55-period EMA near 544.76. The session high was 552.87 and the low was 543.34. The close was near the bottom of the day’s range. Touching an average is a test; recovering and holding higher levels is evidence that buyers are responding.
A constructive sequence would be stabilization, recovery toward the session high, and a pullback that holds the reclaimed area. A break below 543.34 followed by a failed reclaim would weaken the support argument. The average is calculated from price. It does not protect a position because we want it to.
7. Similar tickers can hide the same exposure
Two names are not two independent ideas just because they have different ticker symbols. If both rely on similar demand, share the same weak industry backdrop and lose support together, buying both may simply increase the same exposure.
Use peer comparisons carefully. Nike and Lululemon are consumer-discretionary examples, not staples. Super Micro and Dell are systems/hardware comparisons; Super Micro is not a memory-chip manufacturer. EOG and Devon provide exploration-and-production examples alongside XOP. Vertex and Regeneron are biotechnology comparisons alongside XBI. Comparable does not mean interchangeable.
Meta belongs to communication services, represented by XLC—not automatically to the technology sector or semiconductor group because people informally call it a tech company. Formal classification, index membership and business exposure answer different questions.
Micron and Sandisk both connect to memory and storage, but their product mixes differ. Micron participates in DRAM and NAND; Sandisk focuses on NAND flash storage. Company-specific earnings, products, customers and execution can create meaningful differences within a shared demand theme.
For each candidate, ask: Is it outperforming its relevant group? Is that advantage persistent or just one session? Is there a specific level to trade against? What would make the original idea wrong? If those answers are missing, changing tickers has not repaired the process.
8. Micron: business strength and a weak price response are different facts
Micron’s September 30 release reported fiscal fourth-quarter revenue of $54.23 billion and guided the following quarter to $61.5 billion, plus or minus $1.5 billion. Reported results and forward guidance are separate categories, and neither was newly released on October 12. Micron’s earnings release.
Monday’s stock response was a 3.88% decline to 989.04, near a 55-period EMA of 987.16. Its high was 1002.67; its low was 978.50. The immediate price questions are whether the stock can recover 1000 and the session high, or whether it loses the low and fails to reclaim it.
A strong business report does not determine the price investors are willing to pay today. Expectations, valuation, financing conditions and positioning can all matter. The chart cannot isolate which motive dominated. It can show whether the market is accepting higher prices or rejecting them.
Do not skip from “great revenue” to “safe long.” Read the report, distinguish guidance from completed performance, then study the reaction and the group. A company can be worth following while its current trade setup still deserves patience.
9. The next catalysts can change the chart’s starting point
JPMorgan’s October 13 results are expected around 7 a.m. Eastern / 6 a.m. Central, with the call at 8:30 a.m. Eastern / 7:30 a.m. Central. Banks matter here because the S&P can find support outside technology and because credit, funding costs and borrowing demand inform the broader backdrop. Those are questions for the report, not outcomes we know in advance. JPMorgan schedule.
September CPI is scheduled for October 14 at 8:30 a.m. Eastern / 7:30 a.m. Central. Read the release, then yields and the dollar, then whether equities sustain or reverse their initial response. The prior August readings were +0.4% headline and +0.3% excluding food and energy, month over month. They are not the unreleased September result. BLS CPI.
TSMC’s third-quarter conference is scheduled for October 15 at 2 a.m. Eastern / 1 a.m. Central. Its manufacturing outlook provides another semiconductor-demand checkpoint. The relevant test is what it reports and how the group responds—not a promise that a favorable headline must produce a lasting rally. TSMC results calendar.
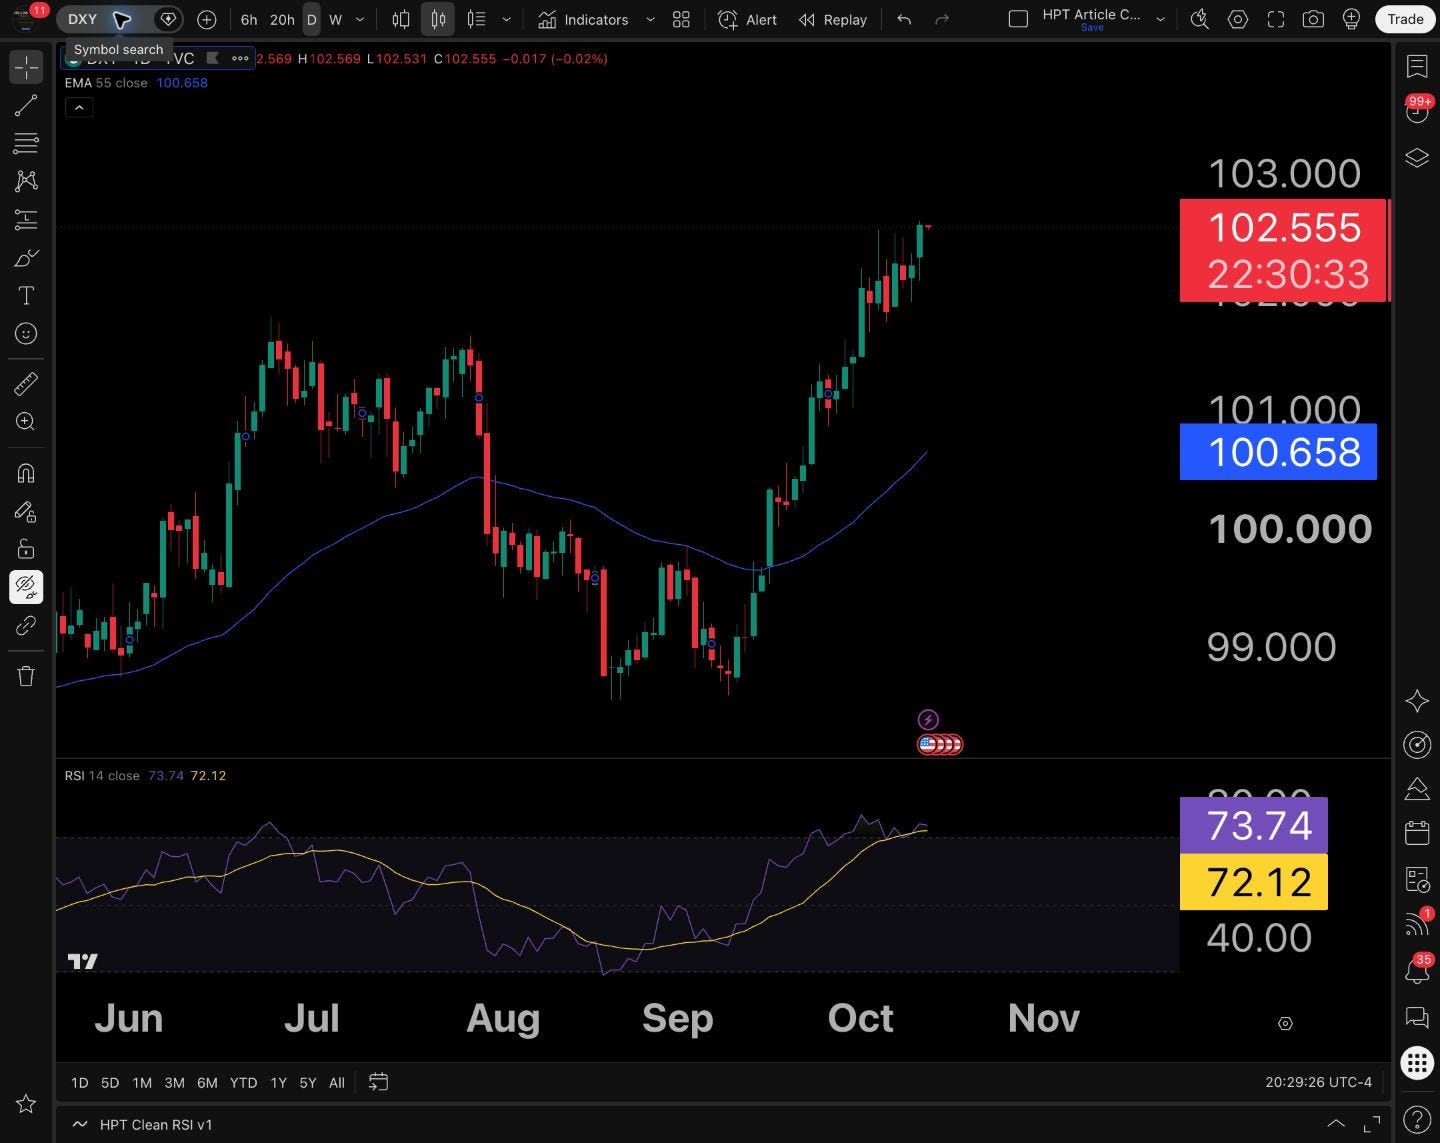
The dollar index was around 102.582, up 0.34%, at approximately 4:58 p.m. Eastern. That was a late-afternoon observation, not an official settlement. A stronger dollar can affect translated overseas revenue, dollar-priced inputs and international demand differently across companies. Hedging and costs matter.
The cash bond market’s October 12 holiday also matters: do not label an old cash-yield quote as fresh confirmation from a full Treasury session. When yields resume trading, distinguish policy-sensitive shorter maturities from longer-term financing conditions. SIFMA holiday reference.
10. Three paths to prepare for, rather than one prediction to defend
Repair: QQQ recovers the 750 area and holds a pullback. SPY works through its 779.40 session high. Semiconductors stabilize around their average and begin improving relative to QQQ. Participation continues improving rather than depending on one large stock. That would strengthen the recovery case.
Deterioration: QQQ loses the 745 area and cannot reclaim it. SOXX loses 543.34 and fails to regain support. Software’s relative resilience weakens, and pressure spreads into the groups that had helped SPY hold up. That would challenge the view that weakness remains contained.
Unresolved range: The lows hold, but pushes toward the highs fail. Leadership changes without durable index progress. That is a recognizable condition, not an analytical failure. The mistake is treating the range as a trend before price has resolved it.
These are reference areas based on Monday’s session, not automatic orders. A gap beyond a level, a quick intraday rejection and a sustained close through it are different events. Set the timeframe and confirmation standard before the move; otherwise it is too easy to redefine success after the fact.
11. A practical checklist before the next trade
Define the basket. Which index is relevant, and how does the stock fit inside it?
Check participation. Is the index supported by more constituents, and is that improvement sustained?
Compare the group. Use consistent instruments and time windows. Separate relative strength from an absolute gain.
Compare peers. Is this stock actually stronger, or is the whole group moving together?
Mark the setup. Identify the reclaim, hold or failure condition on the actual chart.
Check the calendar and instrument. Earnings, CPI, gaps, option premiums and volatility can change the trade’s practical risk.
Allow no trade. A watchlist is not an obligation to enter.
You do not have to buy software because it is losing less than chips. You do not have to short semiconductors because they had a bad day. You do not have to abandon a long-term business view because a short-term setup failed. You do have to know which question you are answering.
The same names will keep attracting attention. What changes is their location, relative strength and response to new information. The task is not to predict which familiar ticker social media will celebrate next. It is to stop letting the last move choose the next position.
Start with the index. Check participation. Compare the group. Then trade the stock’s actual setup.
Watch the complete 21-minute HPT chart breakdown. For the sector indicator, comment “sector indicator” under the video. More education and resources: HollowPointTrading.com.
Educational market commentary, not personalized investment advice. These are conditional scenarios, not promises or trade execution records. Trading and options involve risk. Prices, holdings, weights, averages and scheduled events are date-sensitive. October 12 market observations are retained from the video’s native TradingView research; holdings/weight references are dated October 9 where stated.