
Oil’s Third-Quarter Supply Premium Met a Softer WTI Chart | October 5, 2026
Macro: a quarterly supply story is not today’s price signal
The U.S. equity session is open for this 12:30 p.m. CT edition, and the energy market remains exposed to geopolitical supply risk. In an analysis published today, the U.S. Energy Information Administration (EIA) says Brent futures began the third quarter near $72 a barrel, crossed $100 in July, peaked near $109 on September 15, and averaged around $104 over the quarter’s final two weeks. The report attributes that path to disruptions and threatened flows as fighting affected Middle Eastern and Russian energy infrastructure. Those are historical third-quarter observations and the agency’s analysis, not a claim that today’s WTI price should rise.
EIA’s second macro point is that a barrel of crude and a barrel’s worth of refined products can face different constraints. The agency says U.S. refineries averaged 95% utilization in the third quarter and processed the most crude for a third quarter since 2019. High runs did not erase tightness in every fuel. As of the week ending September 25, EIA reports U.S. distillate inventories 13% below their five-year average, while gasoline was 7% below and jet fuel 3% above. This divergence is why the fuel mix deserves attention alongside the headline oil price. A tight diesel market can support refinery margins even if the crude chart pauses; it does not guarantee a particular refiner’s profit.
The teaching question is what each number actually measures. Brent’s quarterly path is a crude benchmark; refinery utilization is a processing rate; inventory gaps compare product stocks with seasonal history; a crack spread approximates the difference between product and crude prices. None of those is a current price quote for a U.S. oil producer or a company’s earnings result. Today’s TradingView chart below is TVC:USOIL, a WTI CFD display, not EIA’s Brent futures series. Their levels are not interchangeable.
Fundamental: strong crack spreads still need a company-level bridge
EIA says the third-quarter average gasoline crack spread more than doubled from a year earlier, while distillate and jet fuel spreads nearly tripled. That is historical product-market evidence. The agency links unusually strong distillate and jet spreads to disrupted refining activity abroad and tight global supplies, with U.S. exports pulling product toward regions in short supply. A producer, a refiner and a fuel retailer sit at different points in that chain. Higher crude can lift a producer’s realized sales price while raising a refiner’s feedstock cost; a wider product spread may offset that cost for a refiner. The net effect depends on the actual crude slate, product yield, hedges, logistics, operating uptime and costs.
The next company report should therefore bridge product-price strength to realized margins and cash generation instead of treating EIA’s industrywide spread as booked profit. Look for throughput, refinery utilization, product mix, maintenance downtime and the realized refining margin per barrel. Compare those figures with the prior quarter and with the market’s distillate-versus-gasoline split. An adverse result could come from a plant outage or a weaker mix even with strong benchmark spreads. A constructive result would show the benchmark advantage persisting through actual operating volumes and costs. Those are scenarios to test, not reported October outcomes.
The macro catalyst can also reverse. A durable easing of supply disruption, demand weakness or a quicker product-inventory rebuild would reduce the premium implied by today’s EIA retrospective. Continued physical disruption and persistent distillate deficits would keep the supply-risk case alive. Watch subsequent weekly inventory and refinery data rather than promoting one retrospective quarter into a permanent forecast.
Technical: the daily WTI display is testing its trend average
At about 12:34 p.m. CT, the dedicated TradingView TVC:USOIL daily chart showed an unfinished October 5 bar near $89.9. The established 55-day EMA was around $89.52 and RSI, the only lower panel, was near 47. This is a timestamped CFD chart observation, not a completed daily close, a Brent quote, or a guaranteed futures execution price. Today’s displayed low was around $89.11 at capture. The chart’s existing swing-low reference is $88.67. The first recovery test sits around the $91.76 control line; $95.58, $97.71 and $100 are farther overhead references.
The constructive case needs the current bar to finish above the 55 EMA and then reclaim $91.76 on a completed daily close. A later retest that holds above that line would provide better evidence of acceptance than a brief intraday print. The neutral case is repeated rotation between roughly $88.67 and $91.76 while the market digests supply headlines and the next product-inventory data. A completed close below $88.67 followed by a failed reclaim would invalidate the immediate hold-at-average thesis. Conversely, repeated closes above $91.76 would weaken the bearish near-term reading and open a test of $95.58. All levels are feed-specific static references; a headline can gap past them. Risk size and exits should account for slippage.
This is the tension worth following: the EIA’s third-quarter supply and margin evidence was strong, while the daily WTI display at this cutoff was near its trend average with sub-50 RSI. Neither fact cancels the other. One describes a historical physical and refining environment; the other shows how this particular market display was pricing risk at a specific moment. Confirmation requires future data and completed bars.
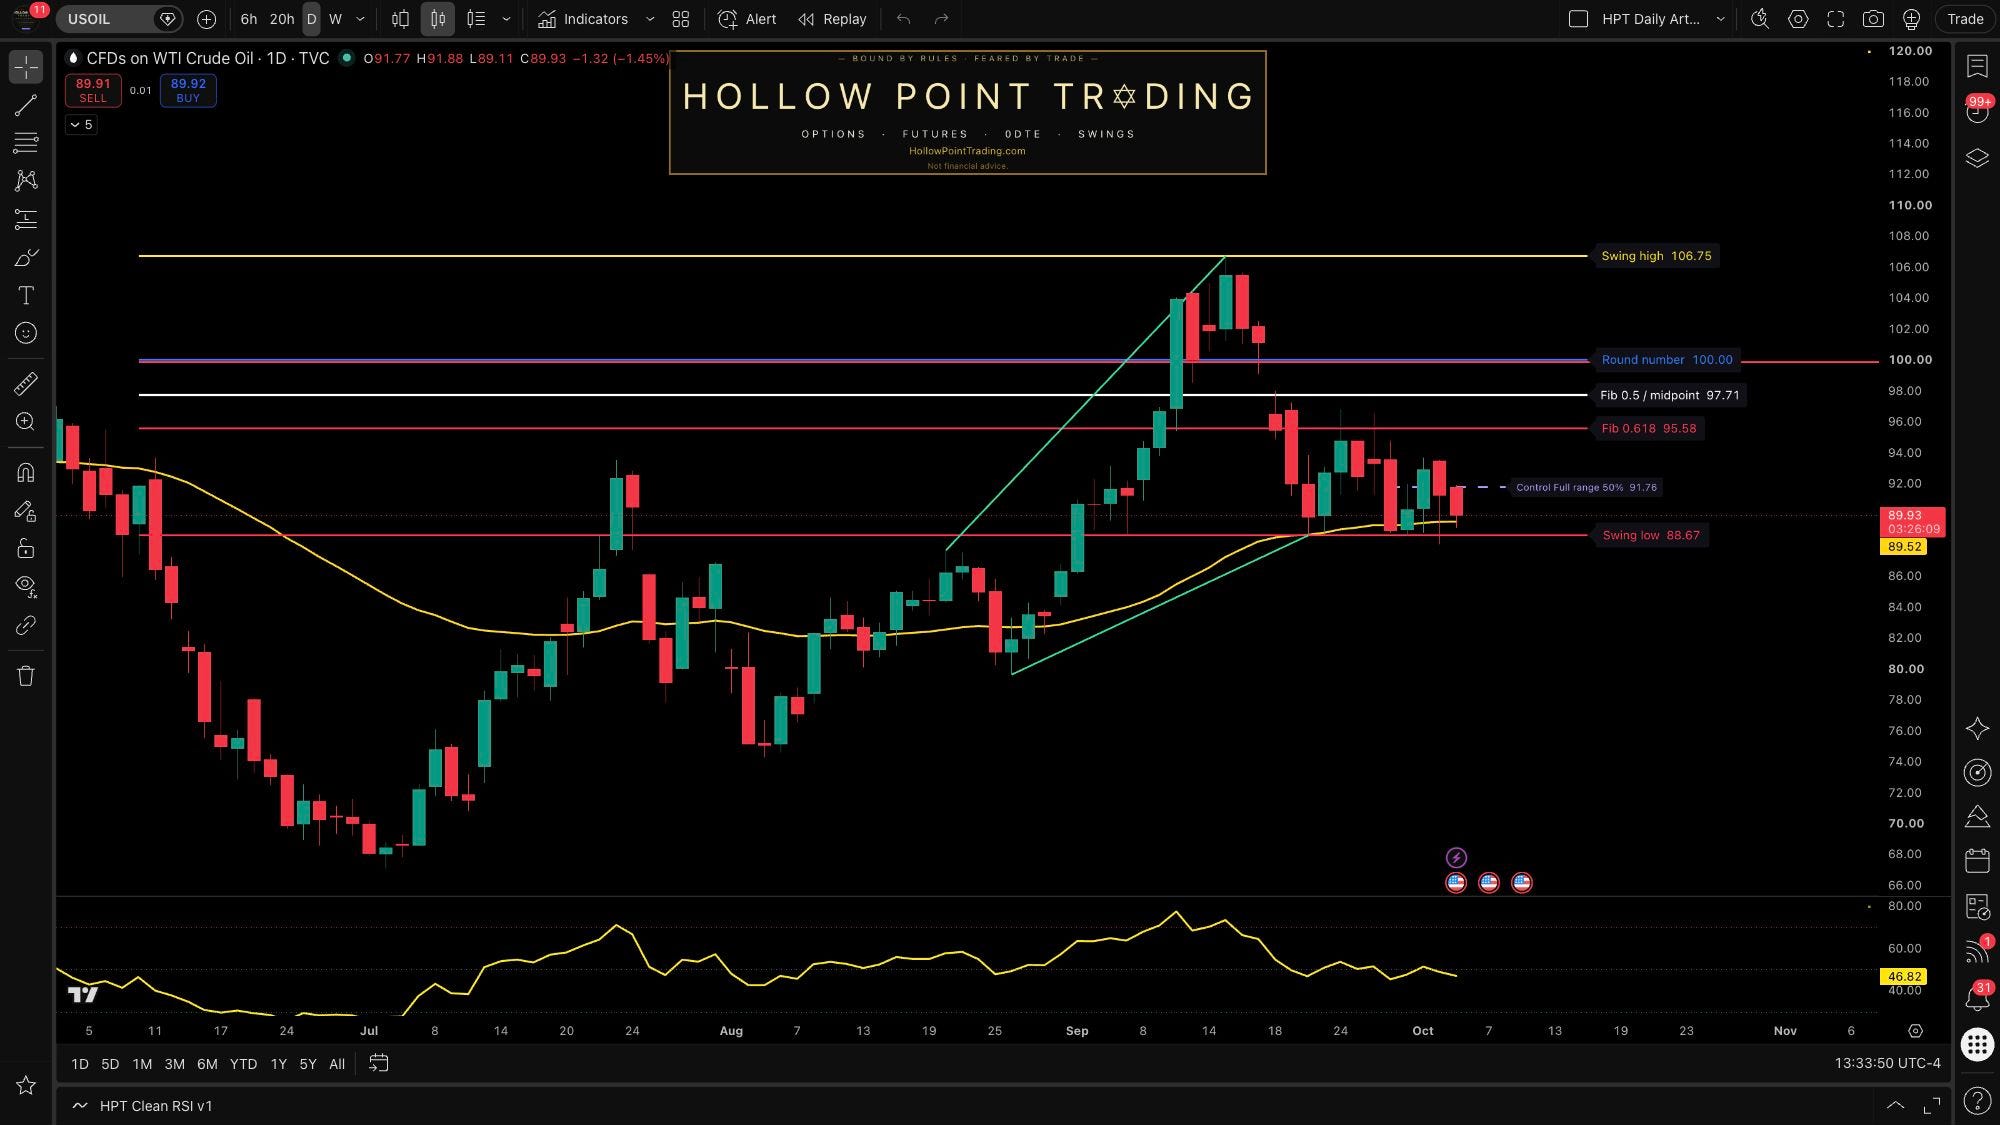
Source: TradingView, dedicated HPT publisher-owned TVC:USOIL chart; 1-day timeframe; captured October 5, 2026 at about 12:34 p.m. CT. October 5’s bar was unfinished; indicated value near $89.9, 55 EMA near $89.52 and RSI near 47 are visual readings. The WTI CFD display differs from EIA’s Brent futures series. Drawn levels are static, feed-specific observations, not assured fills or future closes.
Sources: EIA, “Crude oil prices and refinery margins generally increased throughout the third quarter,” October 5, 2026; TradingView TVC:USOIL chart.
Educational research only. Energy markets can move abruptly on physical-supply and geopolitical news. Futures, CFDs, options and equities involve substantial risk. This is not a claim of an HPT trade or personalized investment advice.
Which would change your near-term oil view first: a completed daily reclaim of $91.76, a break below $88.67, or a new EIA inventory report that materially changes the distillate picture?