
Macro: A bigger business can carry a thinner margin
A profit total and a profit margin answer different questions. The first asks how many dollars the business earned; the second asks how much operating profit it kept from each dollar of sales. PepsiCo’s next report gives us a reason to keep those questions separate. A larger profit pool can coexist with a less efficient conversion of revenue into profit.
This is Hollow Point Trading’s 11:00 a.m. Central Sunday edition for October 4. U.S. cash equities are closed. The chart is a fresh capture of completed daily candles through October 2, not a live weekend quote. The operating figures are historical second-quarter disclosures. Thursday’s third-quarter release remains a future event.
Packaged-food and beverage economics connect household purchases to a long chain of production, packaging, distribution and marketing. More revenue creates an opportunity to spread some fixed costs, but it does not guarantee that operating expenses grow more slowly. A different product mix, added capacity or higher variable costs can change the profit conversion of the additional sales.
That is the macro question for this worksheet: how much of a growing sales base reaches operating profit? It is more precise than assuming a consumer-staples company is protected from every cost pressure. No fresh inflation reading or measured change in commodity prices is asserted here. The mechanism is general; the company disclosure supplies the historical test.
Fundamental: The second-quarter comparison has two valid directions
PepsiCo’s July 9 release reports second-quarter core operating profit of $4.067 billion versus $3.911 billion a year earlier, a rounded 4% increase. Core operating margin was 16.8%, versus 17.2%, a contraction of 40 basis points. Net revenue increased 6.4%. Core measures are non-GAAP and require the accompanying reconciliation; they are not interchangeable with reported GAAP profit.
The narrow inference is that the profit total increased while core profit per dollar of revenue declined. Those statements are compatible. They do not establish that every business segment deteriorated, that all incremental sales were unattractive or that a single cost category caused the difference. A consolidated ratio combines several operations and their changing weights.
A basis point is one-hundredth of a percentage point, so a move from 17.2% to 16.8% is 0.4 percentage points, or 40 basis points. It is not a forty-percent decline in profitability. Keep the unit beside the number. Reading basis points as percentages can turn a modest ratio change into a very different claim.
The worksheet: Scale can outweigh a lower conversion rate
Imagine a hypothetical producer with revenue of 100 units and an operating margin of 20%. Operating profit is 20. If revenue grows to 110 and the margin falls to 19%, operating profit becomes 20.9. The company has earned more profit units, even though it retained less profit from each unit of revenue. This arithmetic illustration is not PepsiCo’s financial reconciliation or an estimate of its next quarter.
The example also shows why the choice of question matters. An investor interested in total operating earnings may welcome the larger pool. An analyst investigating efficiency still needs to explain the lower conversion rate. Neither observation cancels the other. Growth and margin need to be evaluated together, including whether the resources required for growth are sustainable.
A further comparison must hold the measurement boundary steady. Use core profit with its corresponding core margin and the company’s reconciliation. Do not attach a GAAP adjustment from a different period to explain a core ratio mechanically. Before concluding that a cost saving improved the business, ask whether the effect persisted and whether the underlying revenue composition changed.
For Thursday’s reading, I would build a three-column note: revenue growth, core operating profit growth and core margin change. A constructive combination would show the earnings pool expanding with stable or improved conversion. A mixed combination would retain profit growth while conversion remains weaker. A less favorable combination would lose both scale support and margin. These are conditional research scenarios, not estimates or management guidance.
Fundamental: October 8 is the next test of conversion
The August 25 event announcement schedules third-quarter 2026 results, covering the period ending September 5, for October 8. Materials are expected around 6:00 a.m. Eastern, or 5:00 a.m. Central, with the analyst question-and-answer session at 8:15 Eastern, or 7:15 Central. The schedule supplies no advance result.
Write the margin question before the release, then fill it with the actual disclosure. A headline about stronger earnings is incomplete for this purpose until the comparable margin and reconciliation are checked. Management’s explanation can identify areas for follow-up; it does not turn an announced expectation into a completed operating result.
Technical: Weak momentum needs a price repair, not a label
The publisher-owned TradingView chart requests NASDAQ:PEP and displays the NASDAQ-listed company through Cboe One, observed as BATS:PEP, on daily candles. Friday, October 2 opened at $125.96, reached $126.30, traded to $125.16 and closed at $125.89. The established 55-day EMA reads $136.06. RSI(14), the sole lower panel, reads 25.46. These are historical feed observations.
The August–October frame shows a decline beneath the average and the displayed $127.98 selected-swing low. RSI below 30 describes weak momentum; it does not supply a reversal date or establish that the stock is inexpensive. The chart cannot prove that margin compression caused the decline. Price structure and business conversion remain separate evidence tests.
A bullish repair begins with daily acceptance above $127.98 and a retest that retains that area. Above it, the displayed $132.11, $133.39 and $134.67 selected-swing retracement references are successive checkpoints. The EMA near $136.06 is farther overhead and moves with new candles. The $138.80 swing-high reference would matter only after the lower repair has developed; none is a promised target.
The base scenario is stabilization around Friday’s $125.16–$126.30 range while $127.98 remains overhead. The bearish scenario is a daily loss of $125.16 followed by a failed recovery. The nearby $125 round number is context, not a demonstrated floor. This frame does not justify inventing a precise support beneath it; reassess with a fresh chart if the visible structure gives way.
A proposed rebound is locally invalidated if its reclaimed $127.98 area fails and price accepts beneath the support chosen for that setup. A retained reclaim would weaken the immediate breakdown interpretation. Thursday’s earnings can gap through an intended exit, and options bring implied-volatility and time-decay exposure. Use actual session quotes and liquidity before considering any exposure. This is educational analysis, with no HPT position, execution or outcome implied.
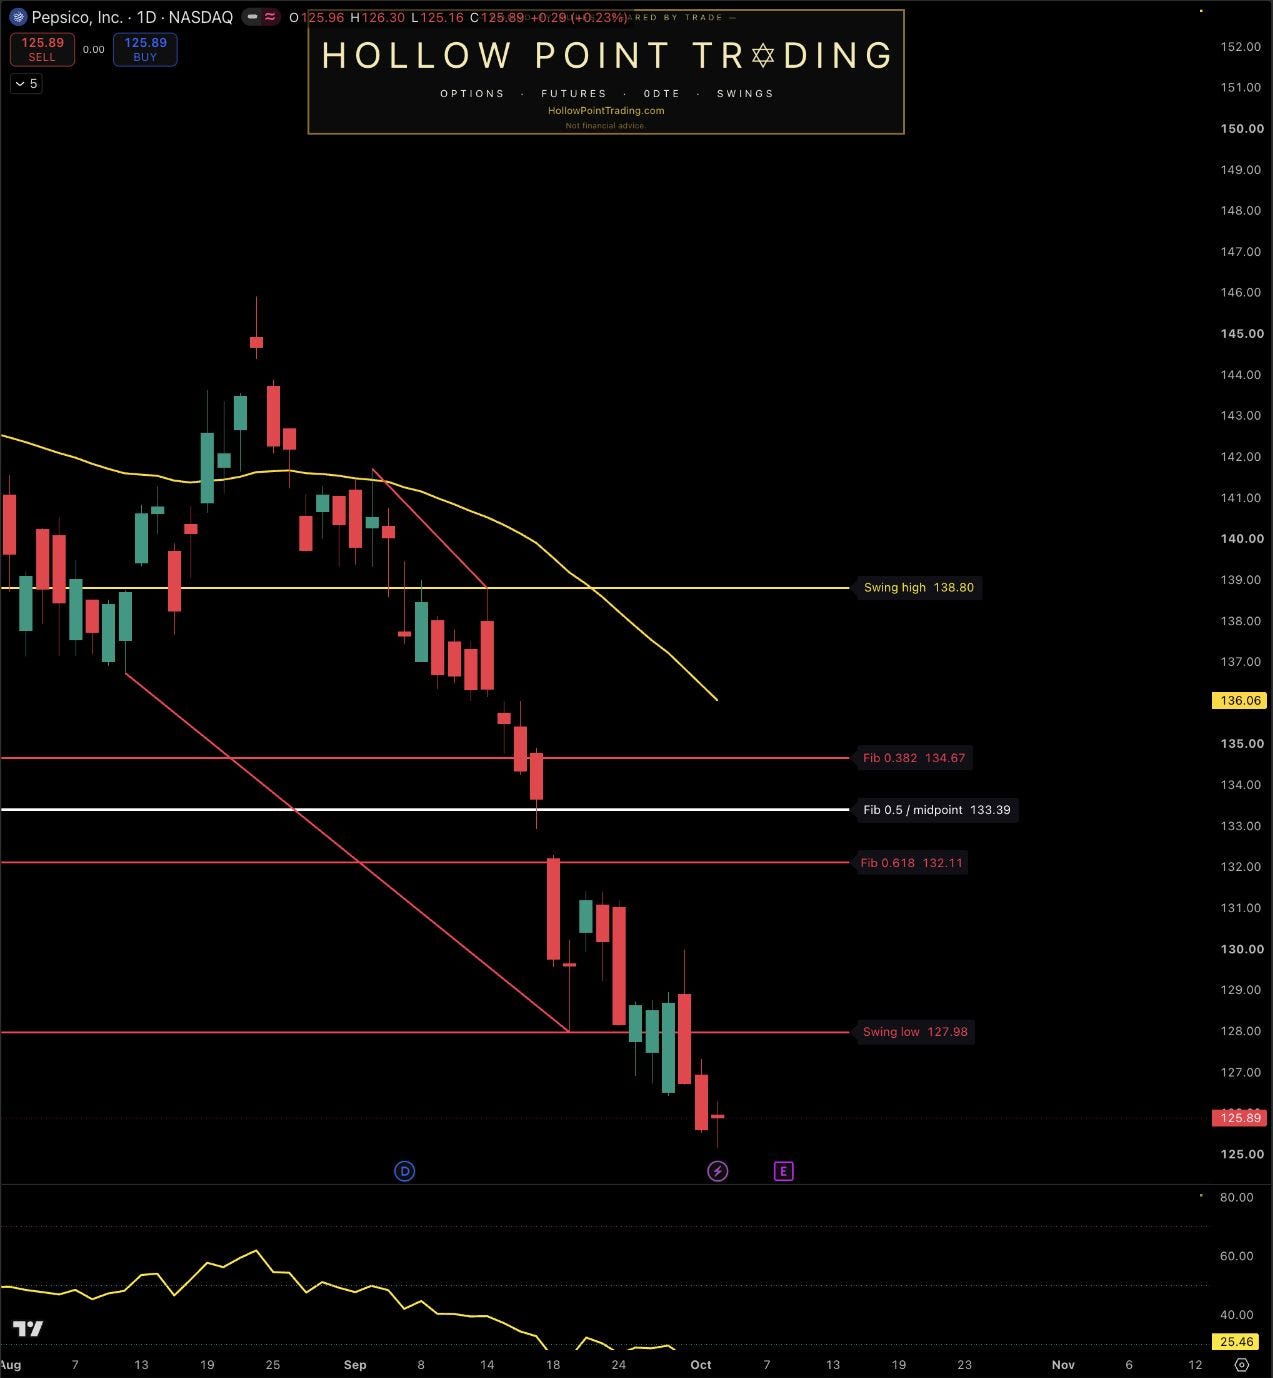
Source: TradingView, requested NASDAQ:PEP, observed BATS:PEP / NASDAQ by Cboe One, daily (1D). Captured October 4, 2026 at 11:05 a.m. Central. Sunday equity market closed; latest completed candle October 2. August–October decline beneath the selected swing low; established EMA(55) $136.06; RSI(14) 25.46 is the only lower panel. Static feed observations do not establish margin causation, valuation or executable weekend prices.
Sources and discussion
PepsiCo — July 9 second-quarter results and GAAP/non-GAAP reconciliation
PepsiCo — August 25 announcement of October 8 results
TradingView — fresh publisher-owned PEP daily chart
Sources checked October 4, 2026. The illustration, interpretations and scenarios are HPT analysis, not company guidance.
Discussion: Which combination of revenue growth and core margin would convince you that PepsiCo’s larger profit pool reflects better conversion, and what daily behavior would validate a $127.98 reclaim?