POINT BLANK | A DURATION BID, NOT A SINGLE RISK REGIME
November 18, 2026 post-session review. This is a fresh 4:15 p.m. Central retrieval of November 18 versus November 17 ETF daily bars. These are ETF prices, not cash-index levels, Treasury yields, credit spreads, spot commodities, constituent breadth counts or options positioning. The source can revise daily bars. Extended-hours latest trades are excluded from the daily-bar comparison.
CROSS-ASSET | THE BOND PROXY ROSE WHILE COMMODITY PROXIES FELL
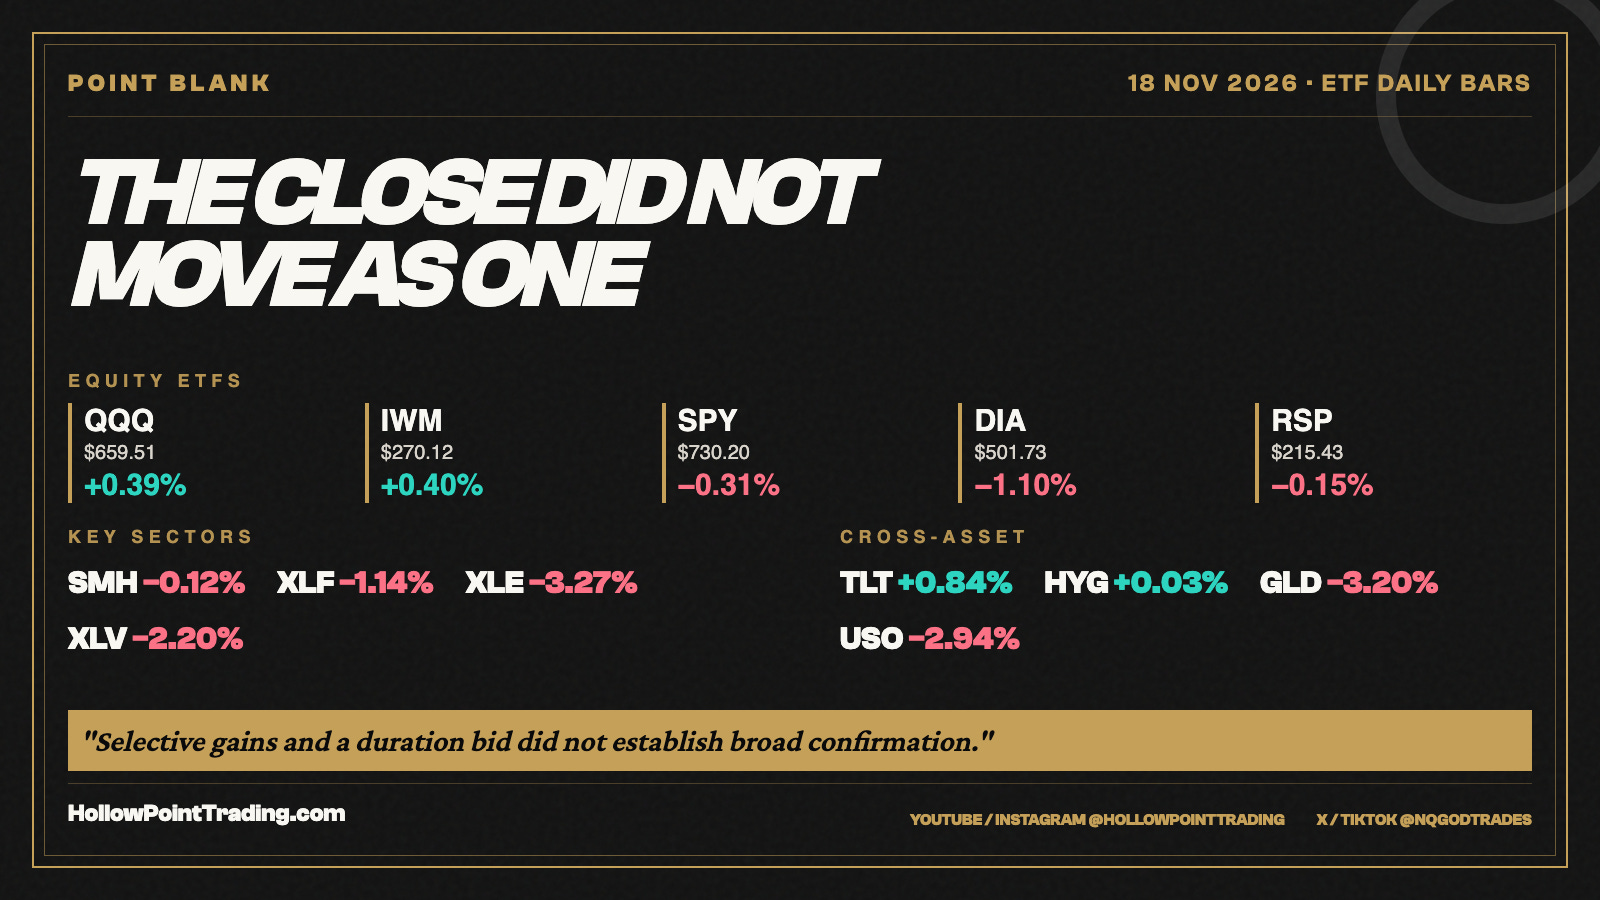
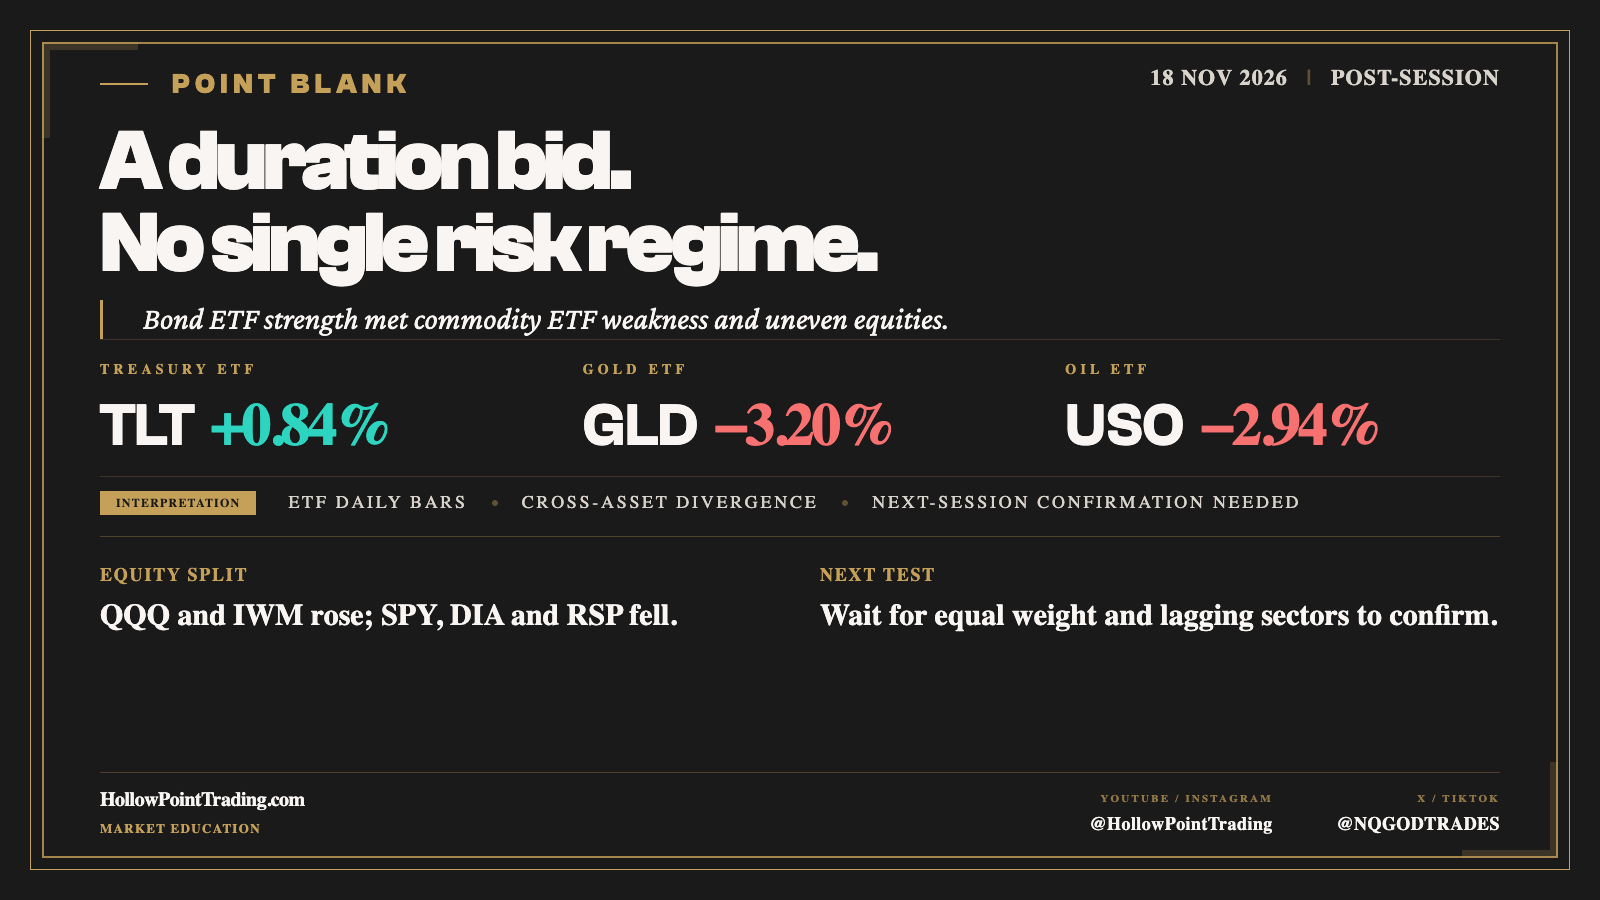
TLT finished $80.22, +0.84%, while HYG was nearly flat at $76.65, +0.03%. GLD fell to $341.19, −3.20%, and USO to $136.11, −2.94%. The long-duration Treasury ETF had a positive daily bar while gold and oil ETFs did not. That mix is compatible with a duration bid, but it cannot by itself establish a single risk-on or risk-off regime, explain yields or prove why investors moved.
EQUITIES | SELECTIVE GAINS DID NOT SPREAD EVENLY
QQQ finished $659.51, +0.39%, and IWM $270.12, +0.40%. SPY closed $730.20, −0.31%; DIA $501.73, −1.10%; equal-weight RSP $215.43, −0.15%. QQQ and IWM did not make this a broad advance. RSP’s decline is an equal-weight ETF comparison, not a count of declining stocks.
SECTORS | FINANCIALS, ENERGY AND HEALTH CARE LAGGED
SMH finished $459.54, −0.12%; XLF $56.42, −1.14%; XLE $61.29, −3.27%; XLV $181.17, −2.20%. Chips held up better than energy and health care but did not confirm QQQ’s positive bar. Sector ETF results do not describe every constituent. The separate company-level Nvidia fiscal-third-quarter release on November 17 reported $115.8 billion revenue, including $107.6 billion Data Center; that is AI-demand context, not a causal explanation for this ETF dispersion.
MACRO | A DATED CATALYST, NOT AN ATTRIBUTION CLAIM
The Federal Reserve released minutes of its October 27–28 meeting at 1:00 p.m. Central November 18. The committee voted 10–2 to hold the 3.75%–4.00% target range; both dissenters preferred a quarter-point increase. That October discussion was not a new November rate decision, and these daily ETF bars do not isolate its market impact.
DECISION ROUTE
My lean is cautious, with selective upside but weak confirmation. A bullish setup needs a break and close above an observed local swing, followed by a separate held retest; RSP and at least one lagging sector improving would support the interpretation. A failed retest is local invalidation; a sustained move below the broader November 18 range is wider invalidation. A bearish setup needs a break and close below observed support, followed by a failed reclaim. One daily bar establishes neither sequence. The attached visuals are editorial market and decision cards, not technical TradingView chart captures.
The six-level options map is unavailable: Tanuki put/call-wall definitions, symbol and expiry scope, underlying data timestamp, and two upside and two downside checkpoints have not been validated. ETF prices cannot substitute for those walls; no gamma flip is claimed.
Question: Which next-session check matters more to you: RSP confirming QQQ, financials recovering, or TLT’s move holding alongside HYG?
Sources and cutoff: Authenticated Alpaca delayed-SIP stock snapshots retrieved November 18 at 4:15 p.m. Central; November 18 and 17 ETF daily bars for named funds; percentages rounded. Latest extended-hours trades excluded. Federal Reserve October FOMC minutes released November 18 at 1:00 p.m. Central; Nvidia fiscal-Q3 investor release dated November 17. Daily bars may revise.
HollowPointTrading.com | YouTube/Instagram @HollowPointTrading | X/TikTok @NQGODTRADES | Reddit r/HollowPointTrading | Substack @HollowPointTrading