November 18, 2026 pre-open update. October housing figures were released by Census and HUD at 07:30 CST. TradingView continuous futures below were checked at about 07:39 CST; these are moving premarket series, not today’s cash-index returns.
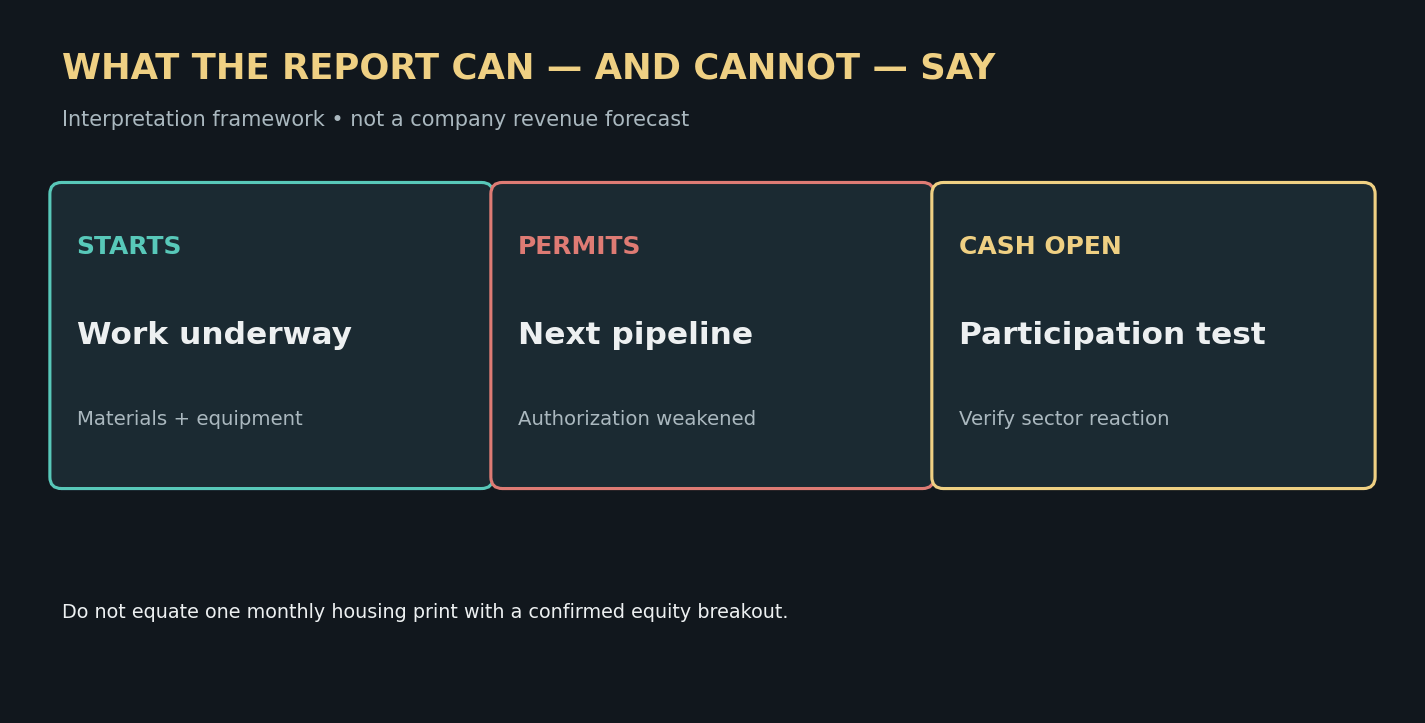
The new housing report is split in the same way as the futures tape. Starts improved, while the earlier-stage permit pipeline weakened. Nasdaq futures were higher, but small-cap futures still lagged. Our read is that a better construction start number can support selected housing and building-materials narratives today, but the drop in permits keeps a broad cyclical recovery unproven.
MACRO — READ PERMITS BEFORE CELEBRATING STARTS
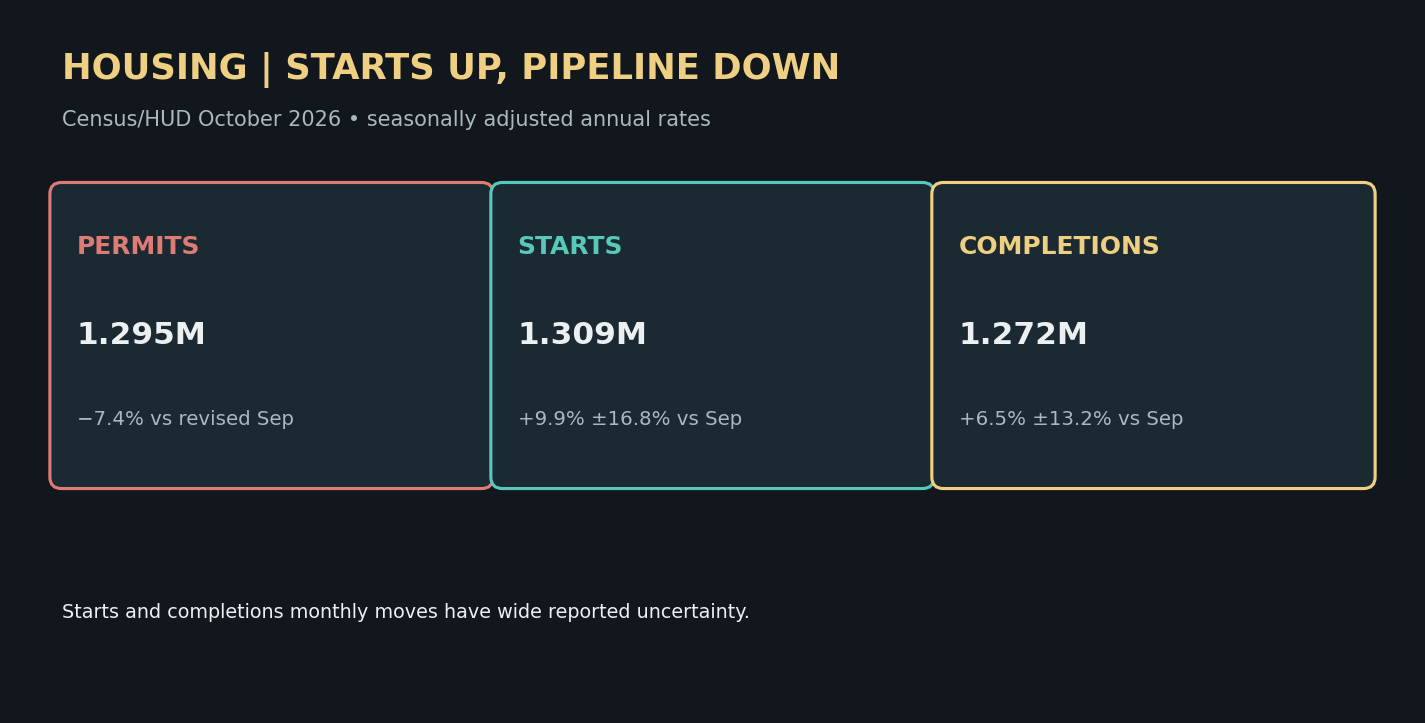
Census and HUD put October privately owned housing starts at 1.309 million seasonally adjusted annual rate (SAAR), up 9.9% from a revised September 1.191 million. The printed monthly change carries a ±16.8% margin of error, so that change is not statistically distinguishable from zero at the 90% confidence level. Single-family starts were 864,000, up 4.0% from revised September 831,000, also with a ±9.0% margin. Starts are actual construction activity, but one month is noisy.
Permits, a separate authorization pipeline, fell 7.4% to 1.295 million SAAR from a revised 1.398 million in September. Single-family permits were 772,000, down 8.7% from revised 846,000. The October five-plus-unit permit rate was 475,000. Completions were 1.272 million, up 6.5% from revised September 1.194 million (±13.2% margin). These three series describe different stages and should not be averaged into a single “housing is strong” headline. Census’s next report is scheduled for December 17. The Fed’s October 27–28 meeting minutes are scheduled for 13:00 CST today, and were not released at this cutoff.
FUNDAMENTAL TRANSMISSION — WHO ACTUALLY BENEFITS?
More starts can mean near-term demand for lumber, electrical products, HVAC equipment and labor, but the benefit depends on project mix, pricing and margins. Lower permits can eventually restrain the next wave of starts. Homebuilders also face financing, inventory and buyer-affordability conditions that today’s starts alone cannot settle. The housing data are an economy-wide input, not evidence that any named builder reported stronger sales or guided higher.
Technology has a different fundamental driver. Nvidia’s November 17 fiscal-third-quarter release reported $115.8 billion of revenue and $107.6 billion of Data Center revenue. That validates large AI infrastructure spending in the company’s own reported quarter; it does not show a matching improvement across small caps or the housing complex. Do not merge these stories into a claim that all sectors have recovered.
OBSERVED PRE-OPEN RESPONSE AND TECHNICAL ROUTE
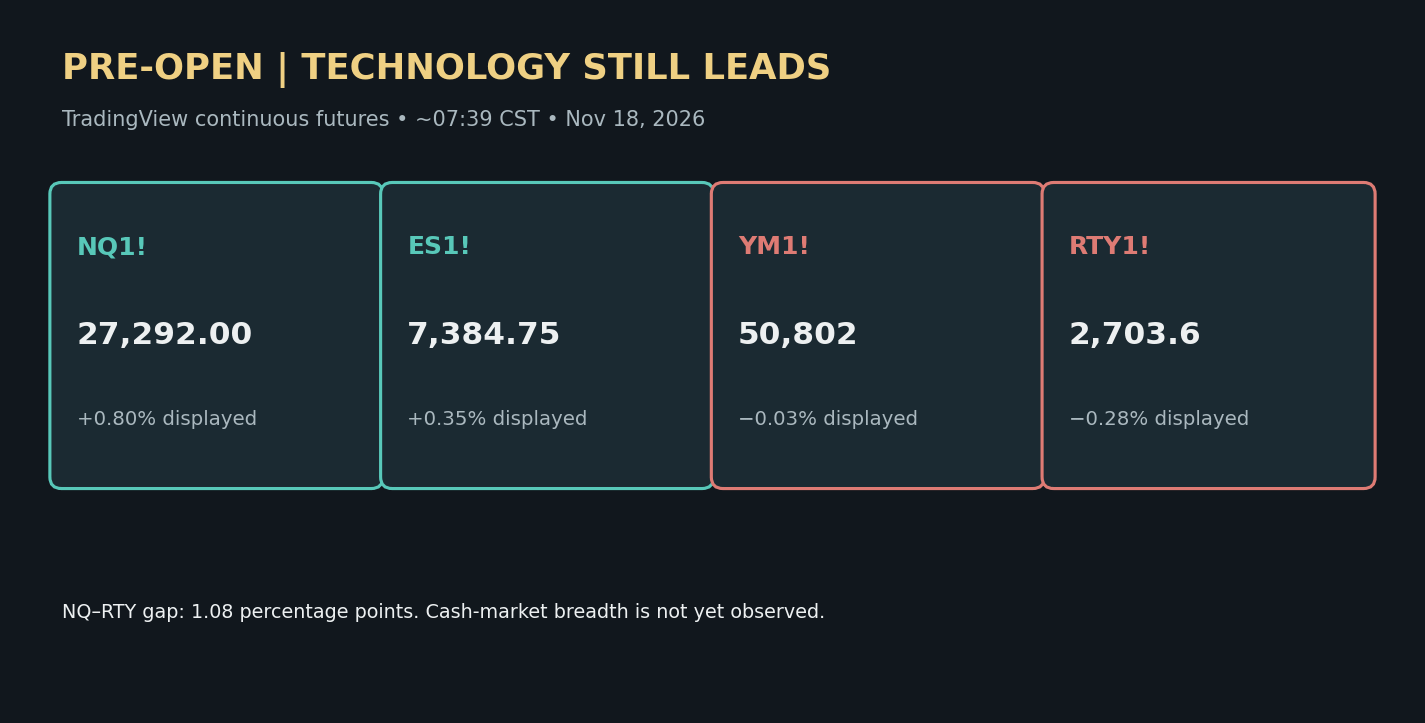
At ~07:39 CST on TradingView, NQ1! was 27,292.00 (+0.80%), ES1! 7,384.75 (+0.35%), YM1! 50,802 (−0.03%), and RTY1! 2,703.6 (−0.28%) on each continuous contract’s displayed comparison. NQ–RTY was a 1.08 percentage-point spread. Continuous WTI CL1! was $83.88/bbl (−2.48%) and gold GC1! $3,781.6/oz (−2.14%). Those co-moves are observed context, not proof of why equities moved. Tuesday’s completed cash decline remains a separate historical session, not today’s return.
My directional lean is selectively bullish for technology, neutral for the full market until the cash open confirms participation. A bullish scenario needs an observed opening-swing break and close, then a separate held retest; stronger proof would include improving Russell/Dow participation and housing-related cash groups holding gains. Losing that retest is local invalidation, while a sustained loss of the prior cash-session range is wider invalidation. A bearish scenario needs a break and close below an observed pullback swing, followed by a failed reclaim; weak permits or red small-cap futures alone do not satisfy that sequence. Set actual prices only after a current native chart establishes them.
The required six-level options map is unverified for this edition: authenticated Tanuki put/call-wall definitions, matching expiry scope, and two upside/two downside checkpoints were not validated. The figures are sourced-data/explanatory visuals; they are not native technical TradingView charts, option walls, or trade signals.
Does the cash open broaden the rebound despite falling permits, or does the split between starts and authorizations carry into equities?
Sources checked: Census/HUD October New Residential Construction release CB26-187 (November 18, 07:30 CST); TradingView NQ1!, ES1!, YM1!, RTY1!, CL1!, GC1! at ~07:39 CST; Federal Reserve November 2026 calendar; Nvidia November 17 investor release. No position or trade result is asserted.