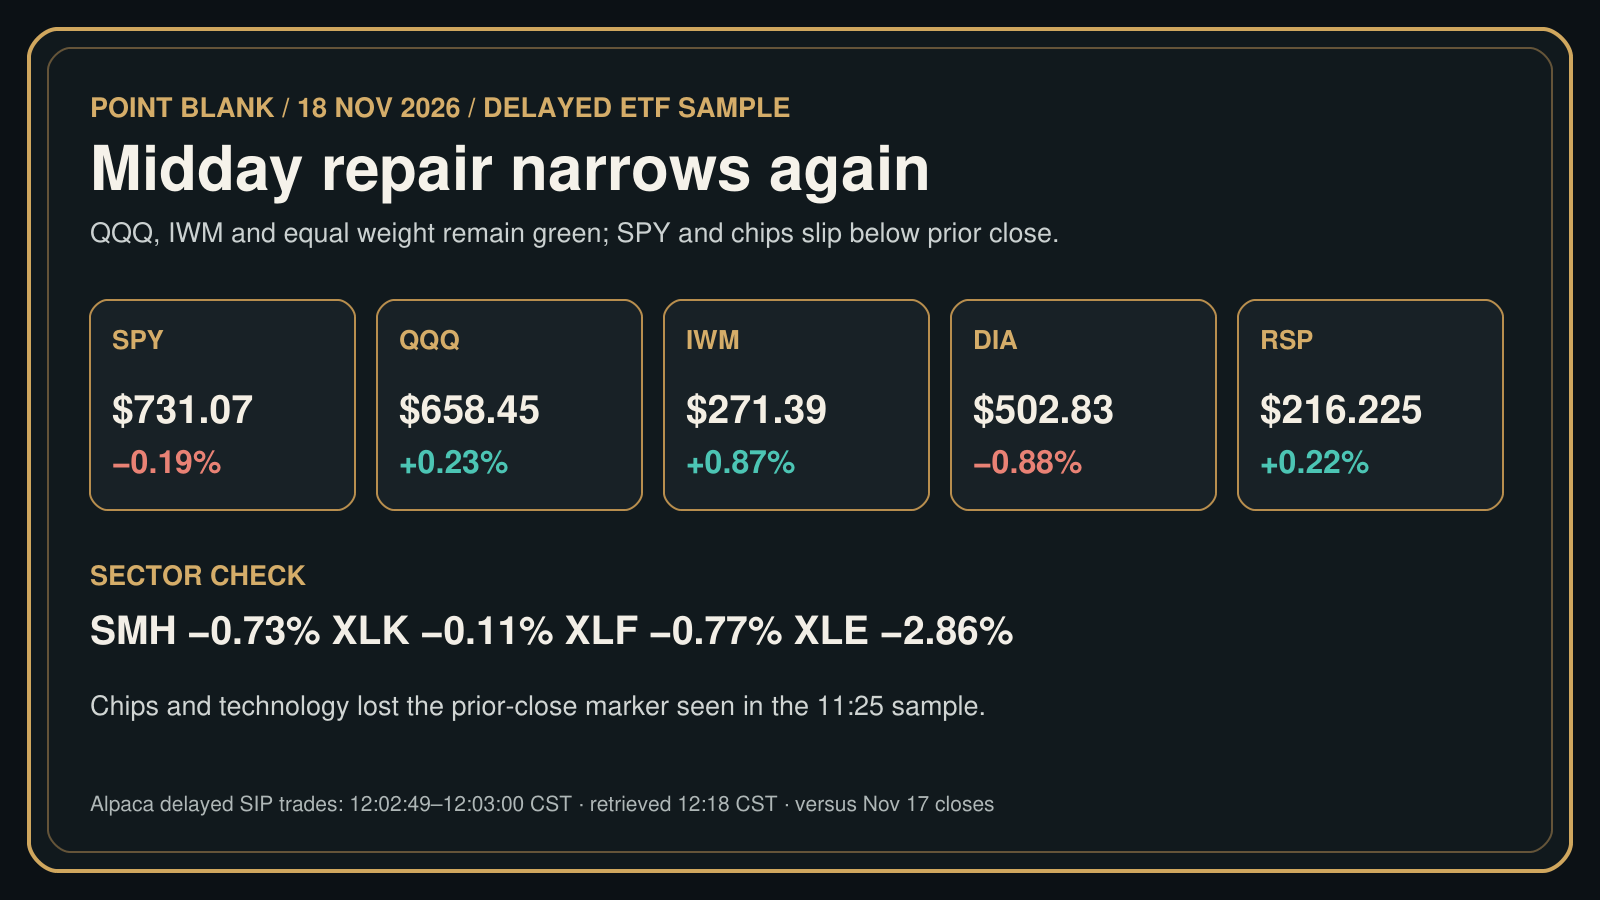
November 18, 2026 midday check. The figures below are Alpaca delayed SIP ETF latest trades stamped 12:02:49–12:03:00 CST, retrieved at 12:18 CST, measured against November 17 completed closes. This is a historical sampled fund board, not live 12:18 quotes, cash index closes, or an advance/decline count. The Federal Reserve’s October meeting minutes were scheduled for 13:00 CST and had not been released at this source cutoff.
MARKET | THE REPAIR NARROWS AGAIN
SPY was $731.07 (−0.19%), QQQ $658.45 (+0.23%), IWM $271.39 (+0.87%), DIA $502.83 (−0.88%) and equal-weight RSP $216.225 (+0.22%). QQQ, IWM and RSP remained above their prior closes, while SPY fell back below and the Dow proxy stayed weak. In the 11:25 sample used for the prior edition, SPY was $732.71 (+0.04%), QQQ $660.83 (+0.59%), IWM $271.95 (+1.08%), DIA $503.68 (−0.72%) and RSP $216.64 (+0.41%). The later delayed sample therefore shows a softer board across all five funds. RSP still being positive prevents a claim that every part of the market has lost its footing; it does not establish constituent breadth.
The key distinction is between relative strength and confirmation. IWM has the largest gain among these broad fund proxies. QQQ remains green but has given back part of its earlier gain. Neither observation by itself proves a fresh breakout, and a snapshot cannot establish a held retest.
SECTORS | SEMICONDUCTORS CROSS BACK BELOW THE PRIOR CLOSE
XLK was $163.08 (−0.11%), SMH $456.725 (−0.73%), XLF $56.63 (−0.77%) and XLE $61.55 (−2.86%). In the 11:25 sample, XLK and SMH had just moved above their prior closes. That repair did not persist through the 12:03 sampled prints. Financials stayed negative and energy remained the largest laggard of these four. A Nasdaq fund remaining green while its semiconductor and technology proxies are negative is a reason to demand more participation before calling the broad tape repaired. These fund moves do not identify what each constituent is doing or why.
MACRO | KNOWN RELEASE CLOCK, UNKNOWN CONTENT
Census/HUD’s October New Residential Construction report, released at 07:30 CST today, put building permits at a 1.295 million annualized rate, 7.4% below revised September. Housing starts were 1.309 million, a reported 9.9% monthly rise with a ±16.8 percentage-point margin of error at the agency’s 90% standard. That monthly starts change is not statistically distinguishable from zero. Permits and starts refer to different stages of the pipeline. This report is a dated input, not evidence that it caused the midday ETF fade.
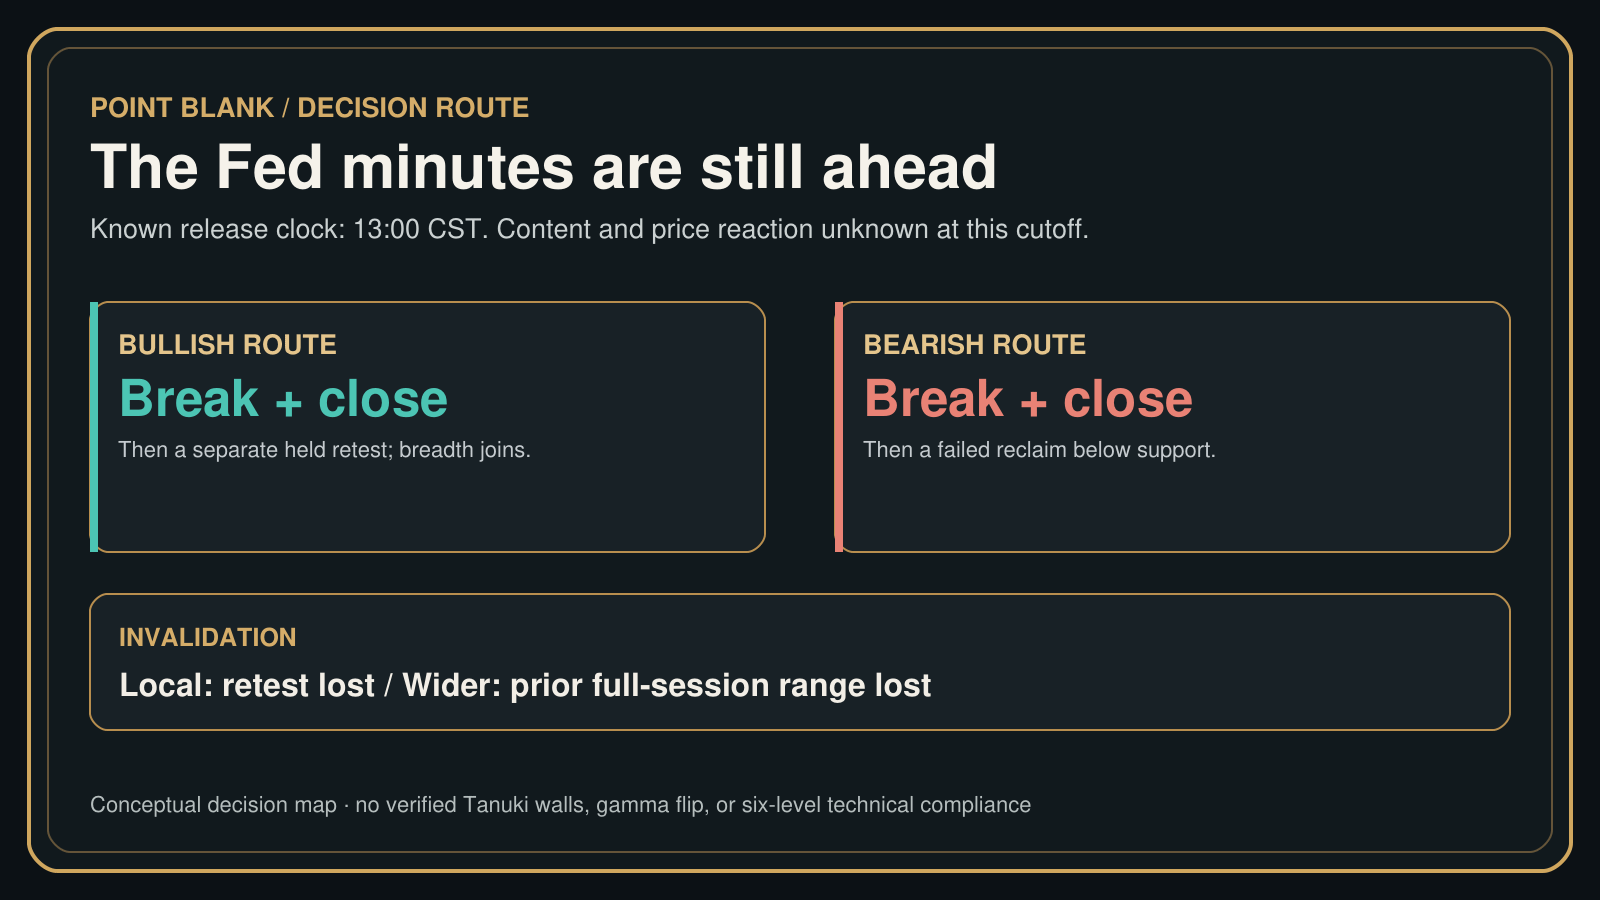
The Federal Reserve scheduled its October FOMC minutes for 13:00 CST. The release timing is verifiable; its contents and the market response are not known at this source cutoff. Ahead of it, a position has to withstand a gap or spread change rather than merely a tidy chart stop. Any post-release version of this analysis must use the released minutes and a fresh price sample.
FUNDAMENTAL | DEMAND EVIDENCE AND FUND PRICE ARE DIFFERENT CLAIMS
Nvidia’s November 17 fiscal-third-quarter release reported $115.8 billion in revenue, including $107.6 billion from Data Center. Those figures support a company-level AI infrastructure demand claim. They do not guarantee a positive semiconductor ETF price, peer margins, order conversion or near-term cash flow for the whole group. SMH returning below its prior close at 12:03 is a price observation that must be assessed separately from Nvidia’s reported result.
CROSS ASSET | KEEP THE CLOCKS AND INSTRUMENTS VISIBLE
GLD was $342.4803 (−2.84%) and USO $135.50 (−3.38%) on this delayed ETF sample. They are fund proxies for gold and oil exposure, not spot gold or crude futures. At the prior review, the latest completed U.S. Treasury daily par curve was November 17, with the 10-year at 5.10%; that is a historical daily entry, not a live midday yield. These asynchronously timed observations do not establish that any one cross-asset move caused the equity change.
DECISION ROUTE | CAUTIOUS UNTIL PARTICIPATION RETURNS
My near-term lean is cautious and defensive for the broad board. QQQ, IWM and RSP still hold above their prior closes, but SPY and the technology and semiconductor fund proxies lost that marker while the Dow, financials and energy continued to lag. A bullish route requires a break and candle close above a verified swing, then a separate held retest with equal-weight, financial and chip participation improving. Loss of that retest is local invalidation; sustained loss of the prior full cash-session range is the wider invalidation. A bearish route requires a break and close below observed support followed by a failed reclaim. These delayed fund marks alone satisfy neither confirmation sequence.
The six-level technical map remains incomplete: authenticated Tanuki put- and call-wall definitions and expiry scope, plus two upside and two downside checkpoints, were not verified for this edition. I do not infer a wall, gamma flip, position, fill or result. The accompanying boards are explanatory data and process visuals, not native TradingView technical captures.
What matters first after the minutes: QQQ and RSP holding green, or semiconductors and financials failing to rejoin them?
Sources and cutoffs: Alpaca delayed SIP ETF latest trades stamped 12:02:49–12:03:00 CST November 18, retrieved 12:18 CST; preceding edition sample stamped 11:25:31–11:25:35 CST; U.S. Census Bureau/HUD October New Residential Construction released November 18 at 07:30 CST; Nvidia fiscal-third-quarter investor release November 17; U.S. Treasury Daily Par Yield Curve Rates November 17; Federal Reserve FOMC calendar, October minutes scheduled November 18 at 13:00 CST.