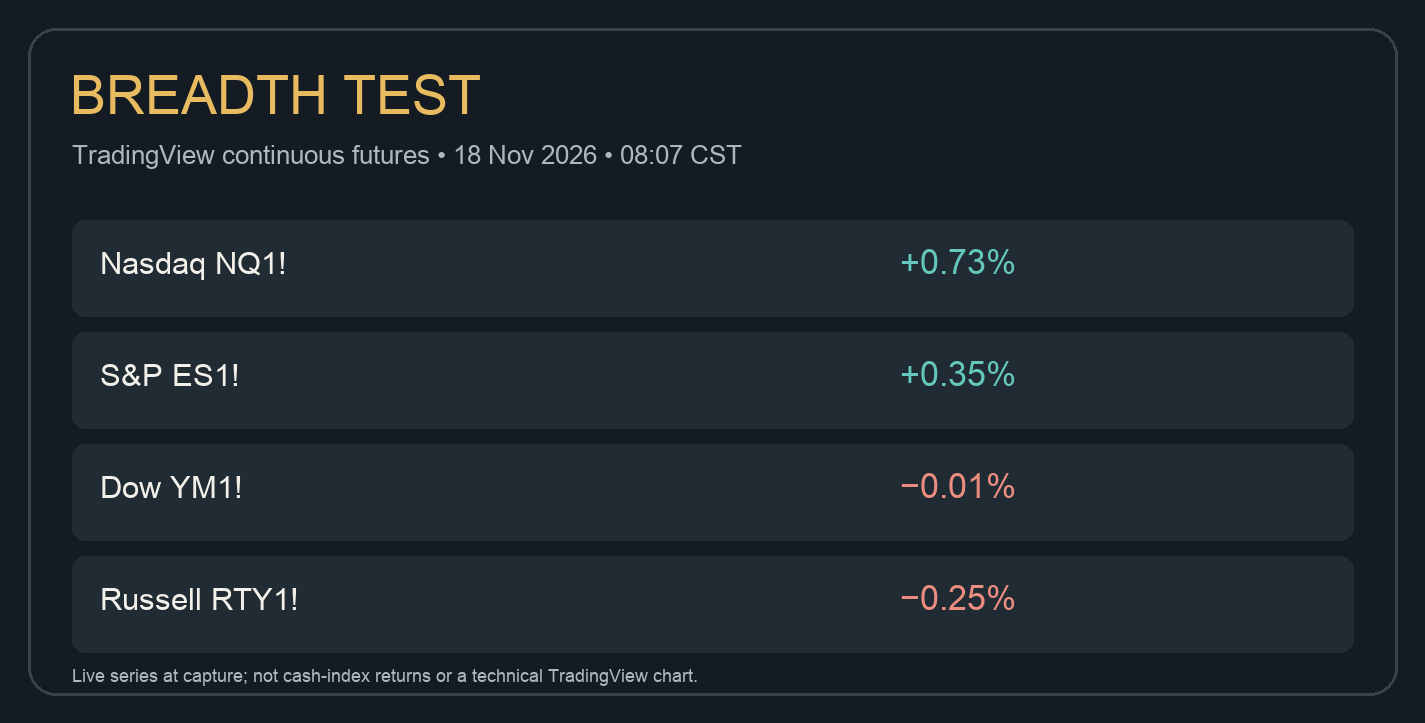
November 18, 2026, 08:07 CST source cutoff. The October housing release is public, but the 08:30 CST U.S. cash open had not happened. The quotes here are TradingView continuous futures at 08:07, not today’s cash-index returns.
The new read is whether the early technology rebound can recruit the rest of the market. NQ1! was 27,273.25 (+0.73%) and ES1! 7,384.75 (+0.35%). YM1! was 50,809 (−0.01%) and RTY1! 2,704.5 (−0.25%). Nasdaq minus Russell was 0.98 percentage point. That is a meaningful pre-open participation gap: the headline is green, but the smaller-company proxy was still red. The next useful observation is the cash-market breadth after 08:30, not another extrapolation from the overnight board.
MACRO | ONE HOUSING PRINT, THREE DIFFERENT STAGES
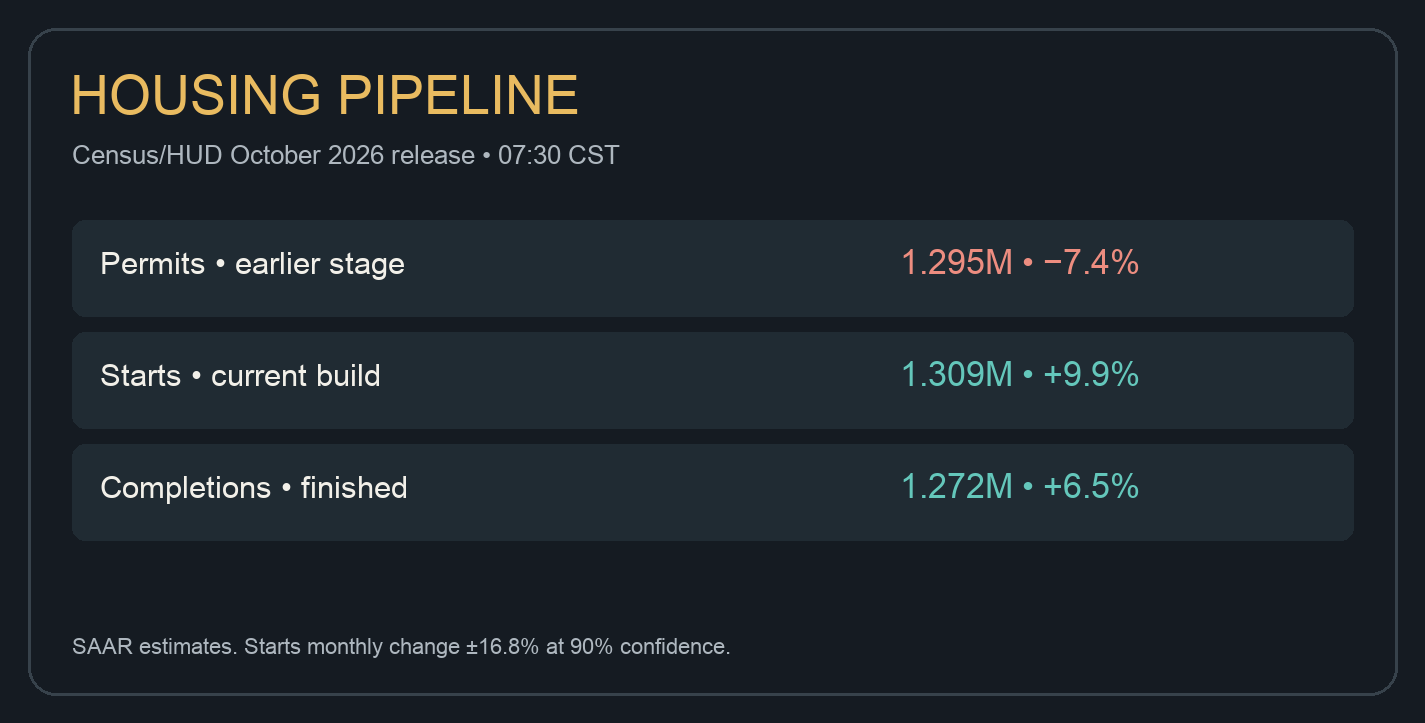
Census and HUD’s October New Residential Construction release (CB26-187) put permits at 1.295 million seasonally adjusted annual rate, down 7.4% from revised September 1.398 million. Starts were 1.309 million, up a printed 9.9% from revised 1.191 million, while completions were 1.272 million, up a printed 6.5% from revised 1.194 million. The starts monthly change has a ±16.8% margin of error and the completions change ±13.2%; neither printed monthly gain is statistically distinguishable from zero at the agency’s 90% confidence threshold. Permits are earlier in the project chain, starts represent initiation, and completions represent finished supply. The weaker authorization pipeline argues against calling one better starts estimate a durable housing acceleration. Today’s Fed October 27–28 minutes are scheduled for 13:00 CST and remained unreleased at this cutoff.
FUNDAMENTAL | WHERE THE STORIES DIVERGE
A higher starts estimate can be relevant to near-term demand for construction products and labor, but builders’ order books, financing and margins still need company evidence. Lower permits could matter to later starts if sustained. Meanwhile Nvidia’s November 17 fiscal-third-quarter report showed $115.8 billion revenue, including $107.6 billion in Data Center revenue. That is company-reported AI infrastructure demand, not a direct measure of U.S. housing or smaller-company earnings. The market is weighing separate fundamental stories; it is premature to treat Nasdaq futures strength as proof of economy-wide improvement.
TECHNICAL / DECISION ROUTE | WAIT FOR CASH CONFIRMATION
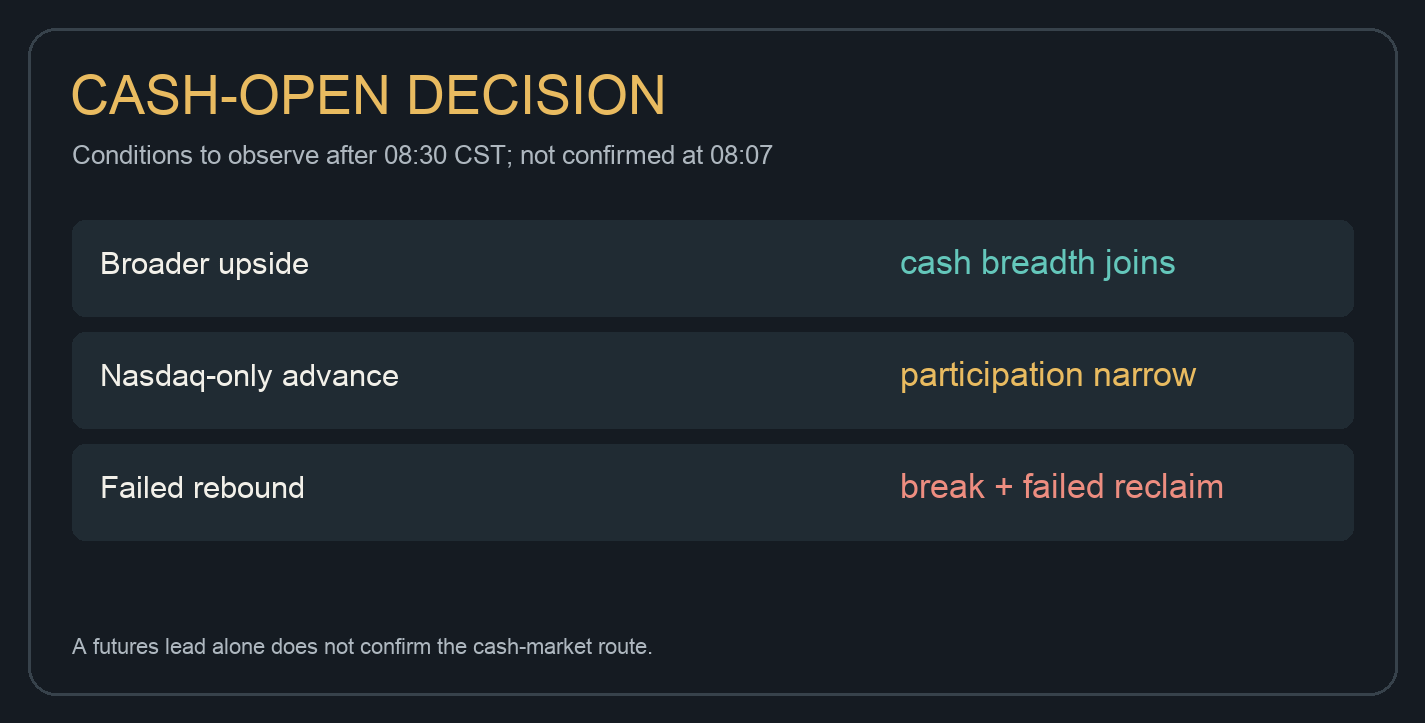
My lean is selectively bullish for technology and neutral for the whole market until cash breadth joins. The bullish case requires a chosen instrument to break and close above an observed opening swing, then separately hold a retest. Better participation in Russell, Dow and relevant housing groups would strengthen that read. Losing the held retest is local invalidation; a sustained loss through the prior cash-session range is wider invalidation. The bearish case needs a break and close below an observed pullback swing, followed by a failed reclaim. Neither a red Russell futures comparison nor the housing permit decline alone completes that sequence. No specific cash-session swing prices are claimed before the open.
The required technical six-level map is unverified here: Tanuki’s authenticated put/call-wall definitions and expiry scope and two upside/two downside checkpoints were not validated. The figures are sourced-data and explanatory panels, not native TradingView technical captures, verified option walls or trading signals.
What would change your read first after the open: broader cash participation, or a failure of Nasdaq’s lead?
Sources: TradingView NQ1!, ES1!, YM1!, RTY1! at 08:07 CST November 18; Census/HUD October New Residential Construction release CB26-187 at 07:30 CST; Federal Reserve November 2026 calendar; Nvidia November 17 investor release. No position, fill or trade result is asserted.