November 18, 2026 cash-session update. The ETF comparison below uses latest trades between 08:58 and 08:59 CST from a delayed market-data feed, reviewed at 09:15 CST. It is a time-stamped sample, not a claim about the live 09:15 tape. Fund prices are proxies for their segments, not a count of advancing stocks. The Federal Reserve’s October 27–28 minutes are scheduled for 13:00 CST and had not been released at this cutoff.
MARKET | THE SMALL-CAP LIFT HAS EXTENDED
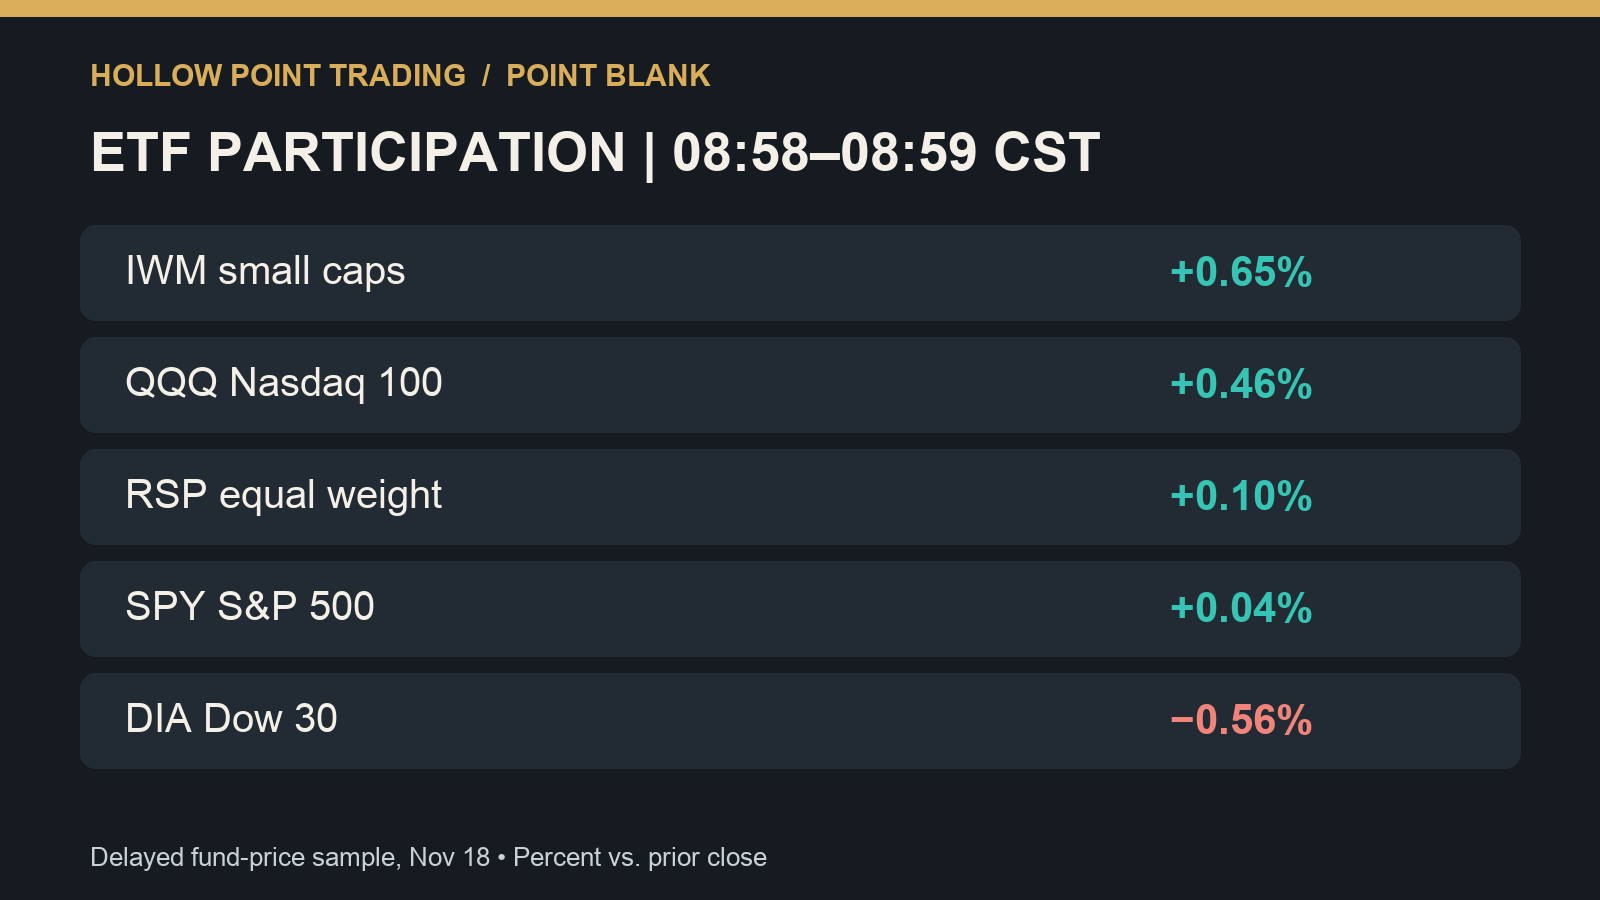
At 08:42 CST, an Alpaca IEX ETF sample showed IWM up only 0.10% against Tuesday’s close, while QQQ was down 0.14%, SPY down 0.22% and DIA down 0.70%. In the later delayed sample, IWM was $270.81, up 0.65%, QQQ $660.00, up 0.46%, SPY $732.70, up 0.04%, and DIA $504.48, down 0.56%. RSP, the equal-weight S&P 500 fund, was $215.97, up 0.10%. That change is evidence of a firmer small-cap and Nasdaq bid in the sampled window. It does not prove that the average stock is advancing or that the move will hold after the data cutoff. The Dow proxy still lagged. The first question is whether IWM, RSP and cyclicals remain aligned on a fresh read.
SECTORS | TECHNOLOGY RECOVERS WHILE FINANCIALS AND ENERGY LAG
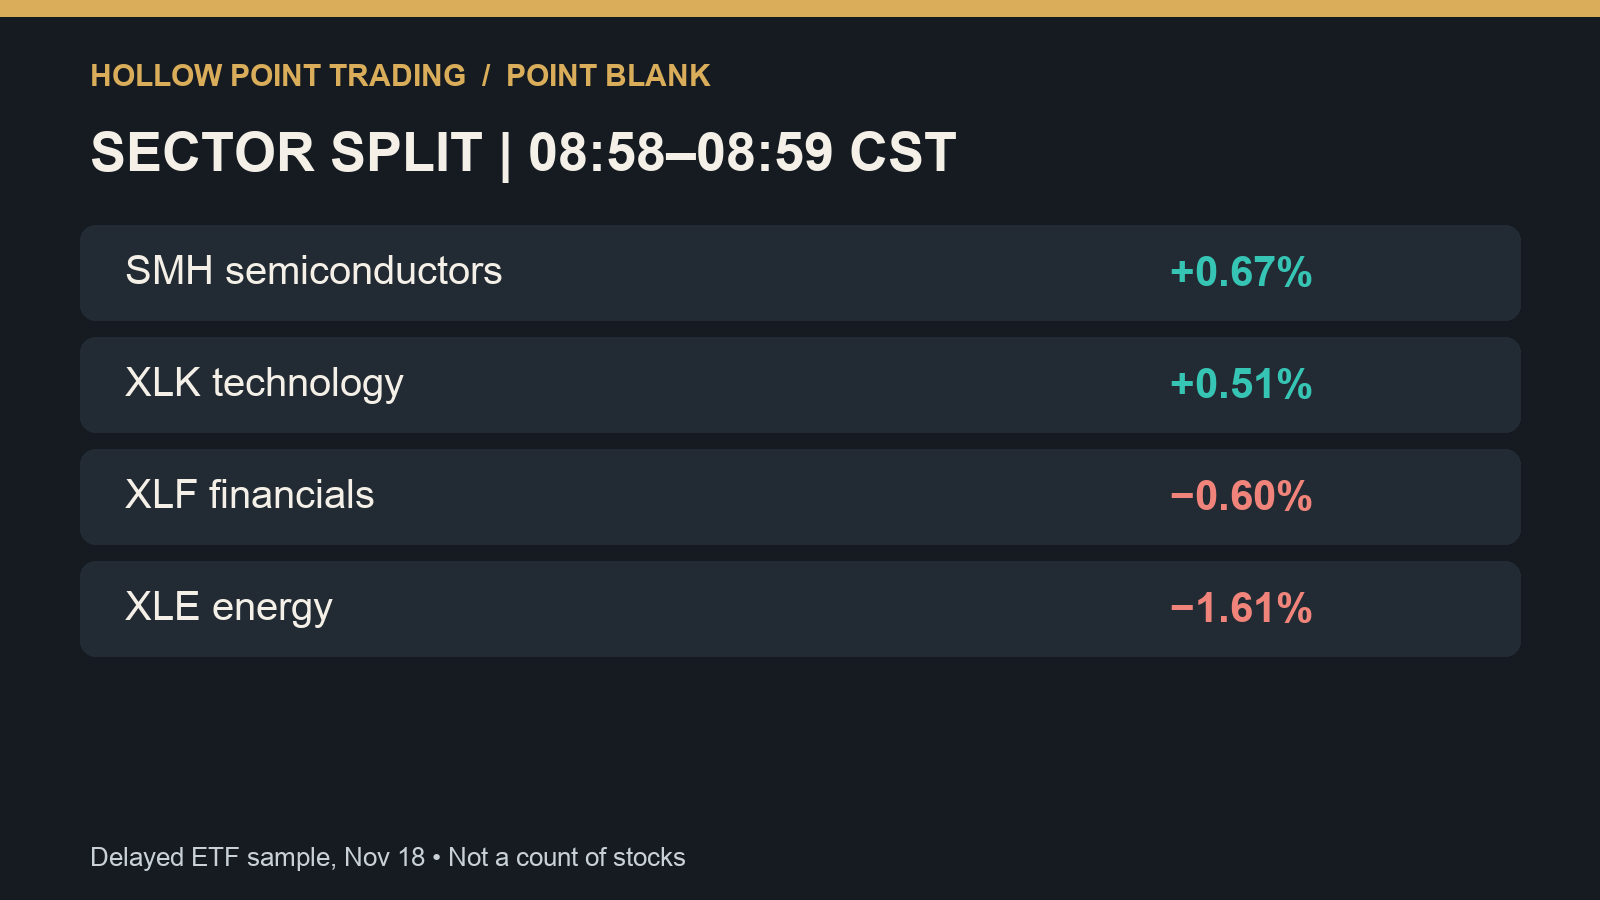
The same 08:58–08:59 CST sample put SMH, the semiconductor fund, at $463.16 (+0.67%) and XLK at $164.09 (+0.51%). XLF was $56.73 (−0.60%) and XLE $62.34 (−1.61%). The divergence matters: Nasdaq and small-cap gains alongside weak financials are narrower than a synchronized cyclical advance. Nvidia’s November 17 fiscal-third-quarter release reported revenue of $115.8 billion, including $107.6 billion from Data Center. Those are Nvidia results, not proof that every semiconductor company has stronger earnings or that Nvidia alone caused the fund move.
MACRO | HOUSING PERMITS AND STARTS DIVERGE
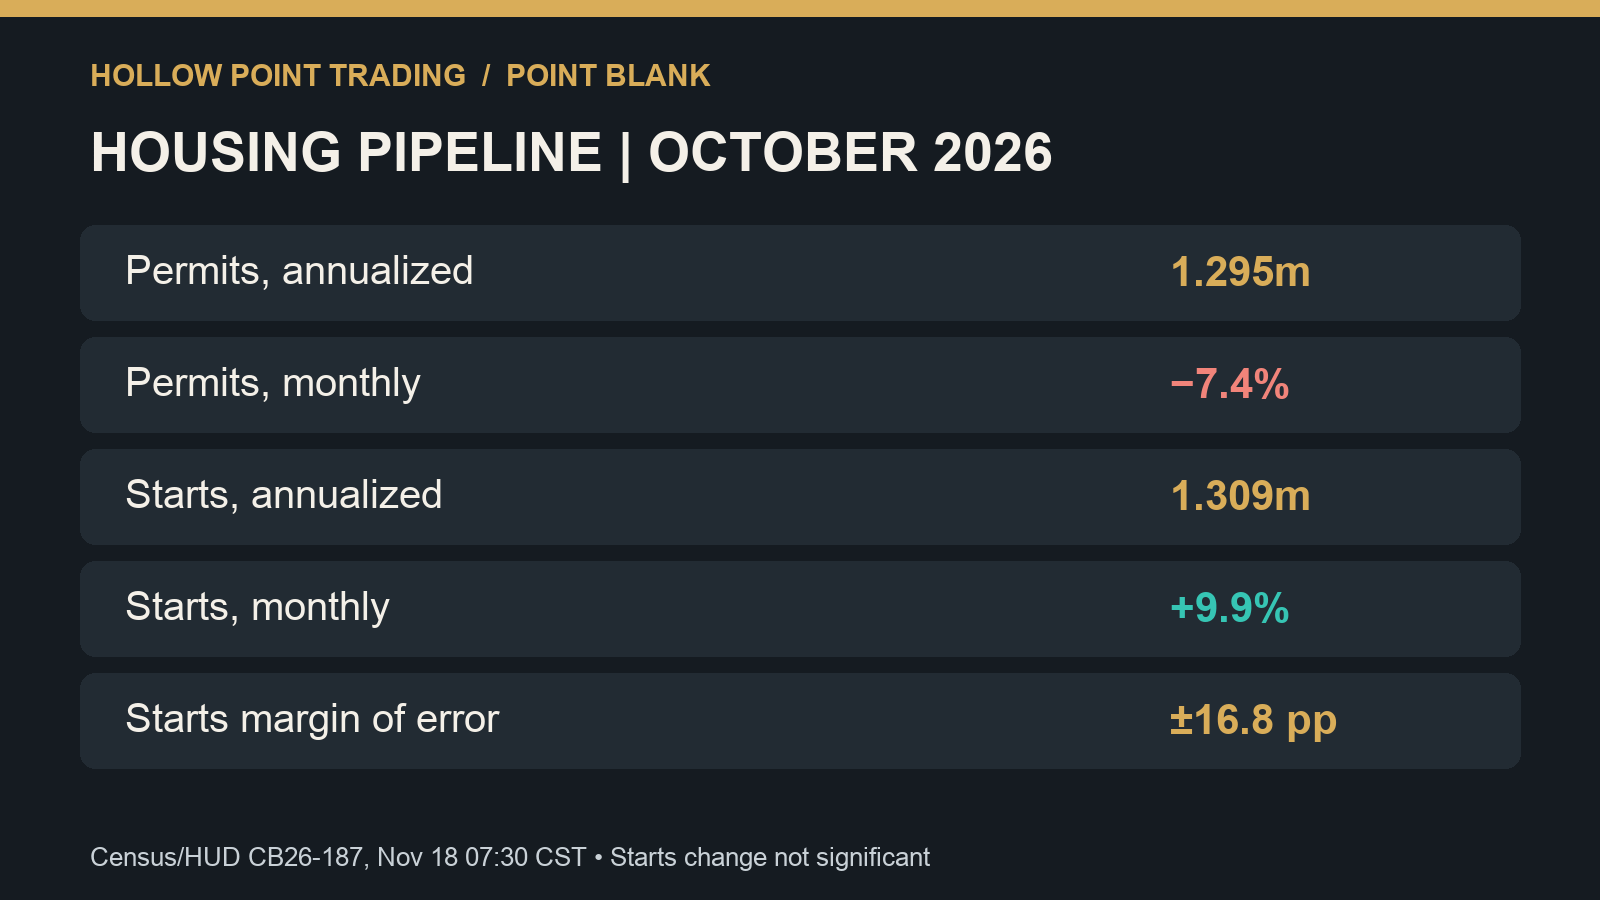
At 07:30 CST, Census and HUD reported October housing permits at a 1.295 million seasonally adjusted annual rate, down 7.4% from revised September. Starts were 1.309 million, a printed 9.9% monthly gain with a ±16.8% margin of error at the agency’s 90% threshold. That monthly starts estimate is not statistically distinguishable from zero. Permits are an earlier authorization stage; starts are work beginning. For builders and building suppliers, the release is a research input, not company-level evidence of orders, margins or financing conditions.
CROSS ASSETS | KEEP EACH MARKET ON ITS OWN CLOCK
The TradingView symbol pages reviewed around 09:14 CST displayed a US 10-year yield of 5.089%, front-month continuous light crude at $83.44 and continuous gold futures at $3,760.8. Those pages did not establish a common last-trade timestamp, so these are display observations, not synchronized intraday comparisons. Do not infer that one caused the ETF moves. The Fed minutes remain a separate scheduled catalyst until they are released.
TECHNICAL DECISION | DEMAND TWO-STEP CONFIRMATION
My lean is cautiously constructive for the small-cap and technology bid, but neutral for the broad market while the Dow and financials lag. A bullish shift requires a break and close above an observed opening swing, followed by a separate held retest; a green print alone does not satisfy either step. A loss of that retest invalidates the local bullish attempt. Wider invalidation requires a sustained loss of the prior full cash-session range on its own timeframe. A bearish route requires a break and close below observed opening support, then a failed reclaim. These are process tests, not claims that a specific price level has triggered.
The six-level technical map is incomplete: verified Tanuki put/call walls, matching expiry scope, two upside checkpoints and two downside checkpoints were not established for this edition. No wall or gamma value is inferred from ETF prices. The accompanying panels are sourced-data graphics, not native TradingView technical captures. No position, fill or result is asserted.
What would change the breadth read first: a fresh IWM/RSP advance joined by financials, or a failed reclaim while the Dow remains weak?
Sources: market-data fund quotes and latest-trade timestamps reviewed November 18 at 09:15 CST; TradingView US10Y, CL1! and GC1! symbol-page display reviewed around 09:14 CST; U.S. Census Bureau/HUD, October New Residential Construction, CB26-187, November 18 at 07:30 CST; Nvidia November 17 fiscal-third-quarter release; Federal Reserve November 2026 calendar.
09:25 CST review of newer delayed quotes (latest trades 09:09–09:10 CST): IWM remained up 0.50% and QQQ up 0.42%, while SPY slipped to −0.15%, RSP to −0.26%, and DIA to −0.93%. SMH was up 0.26%, XLF down 1.17%, and XLE down 1.70%. This later sample narrows the breadth case further: equal weight no longer joined small caps. Both snapshots are historical feed observations, not a live 09:25 quote.