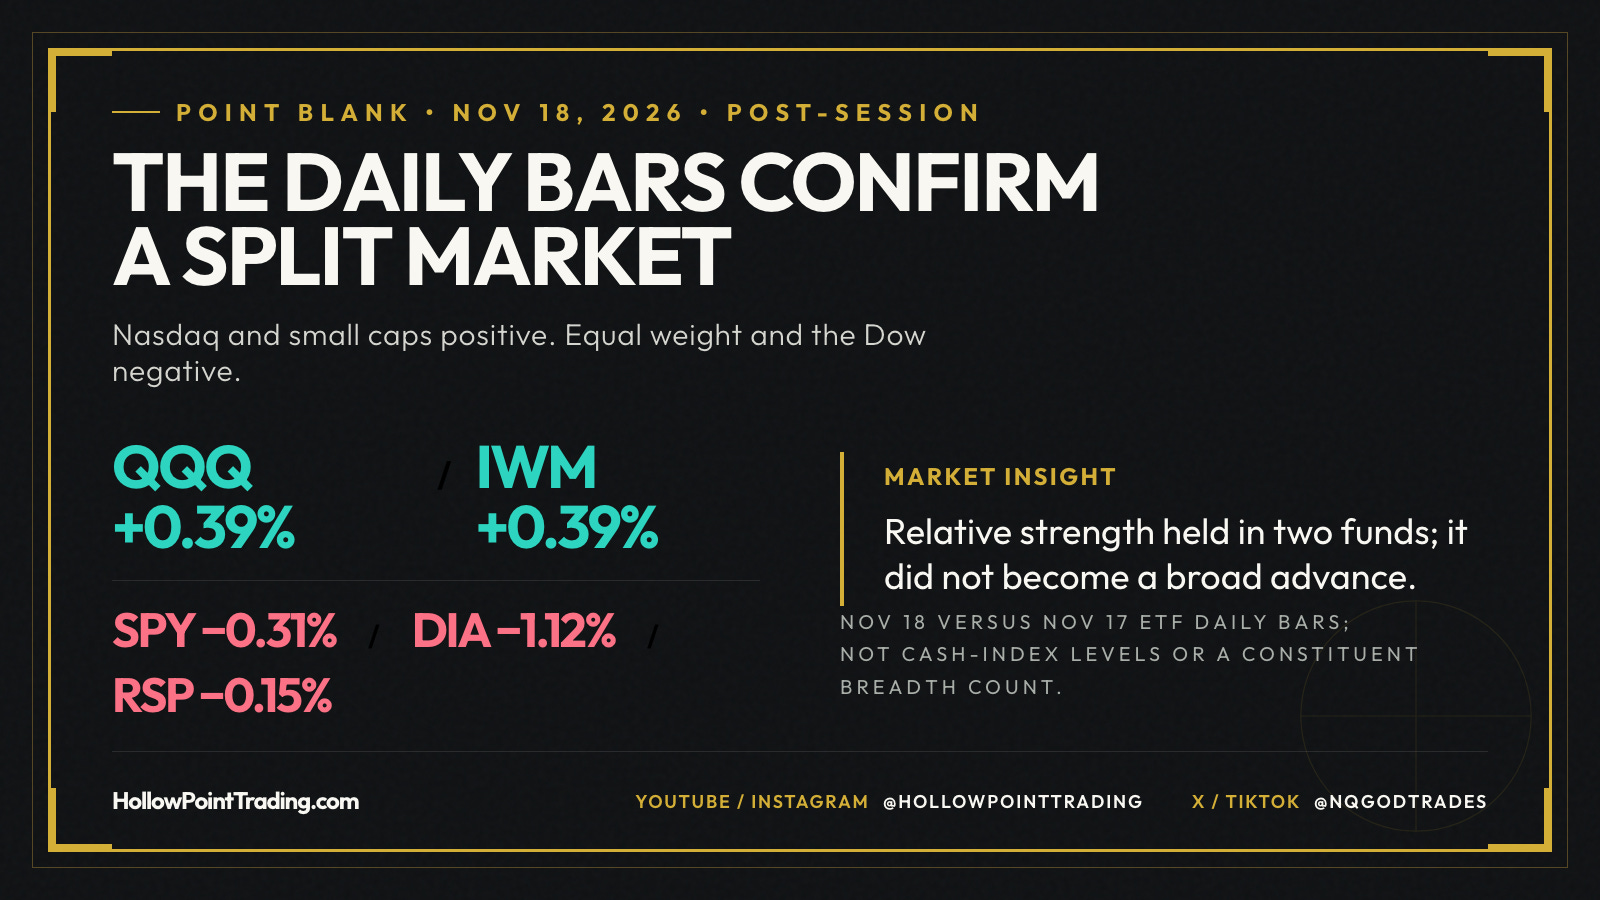
POINT BLANK | THE DAILY BARS CONFIRM A SPLIT MARKET
November 18, 2026 post-session review. November 18 ETF daily bars returned after the regular U.S. equity session are compared with November 17 daily bars. These are fund prices, not cash-index levels, a constituent breadth count or options positioning. Later extended-hours trades can differ.
MARKET | RELATIVE STRENGTH WAS NOT A BROAD ADVANCE
QQQ ended at $659.51, +0.39%; IWM $270.11, +0.39%. SPY ended $730.20, −0.31%; DIA $501.64, −1.12%; equal-weight RSP $215.43, −0.15%. Nasdaq and small-cap gains survived in the daily bars, but SPY, the Dow proxy and equal weight finished lower. RSP’s decline does not count individual decliners; it shows the basket failed to confirm QQQ’s gain. The next session needs fresh evidence before extending this split into a trend.
MACRO | CATALYST, NOT A CAUSAL LABEL
The Federal Reserve released minutes of its October 27–28 meeting at 1:00 p.m. Central. The committee voted 10–2 to hold the 3.75%–4.00% target range. Both dissenters preferred a quarter-point increase. The October discussion was not a new November decision or a promise about December. Mixed ETF returns cannot isolate how much the minutes contributed.
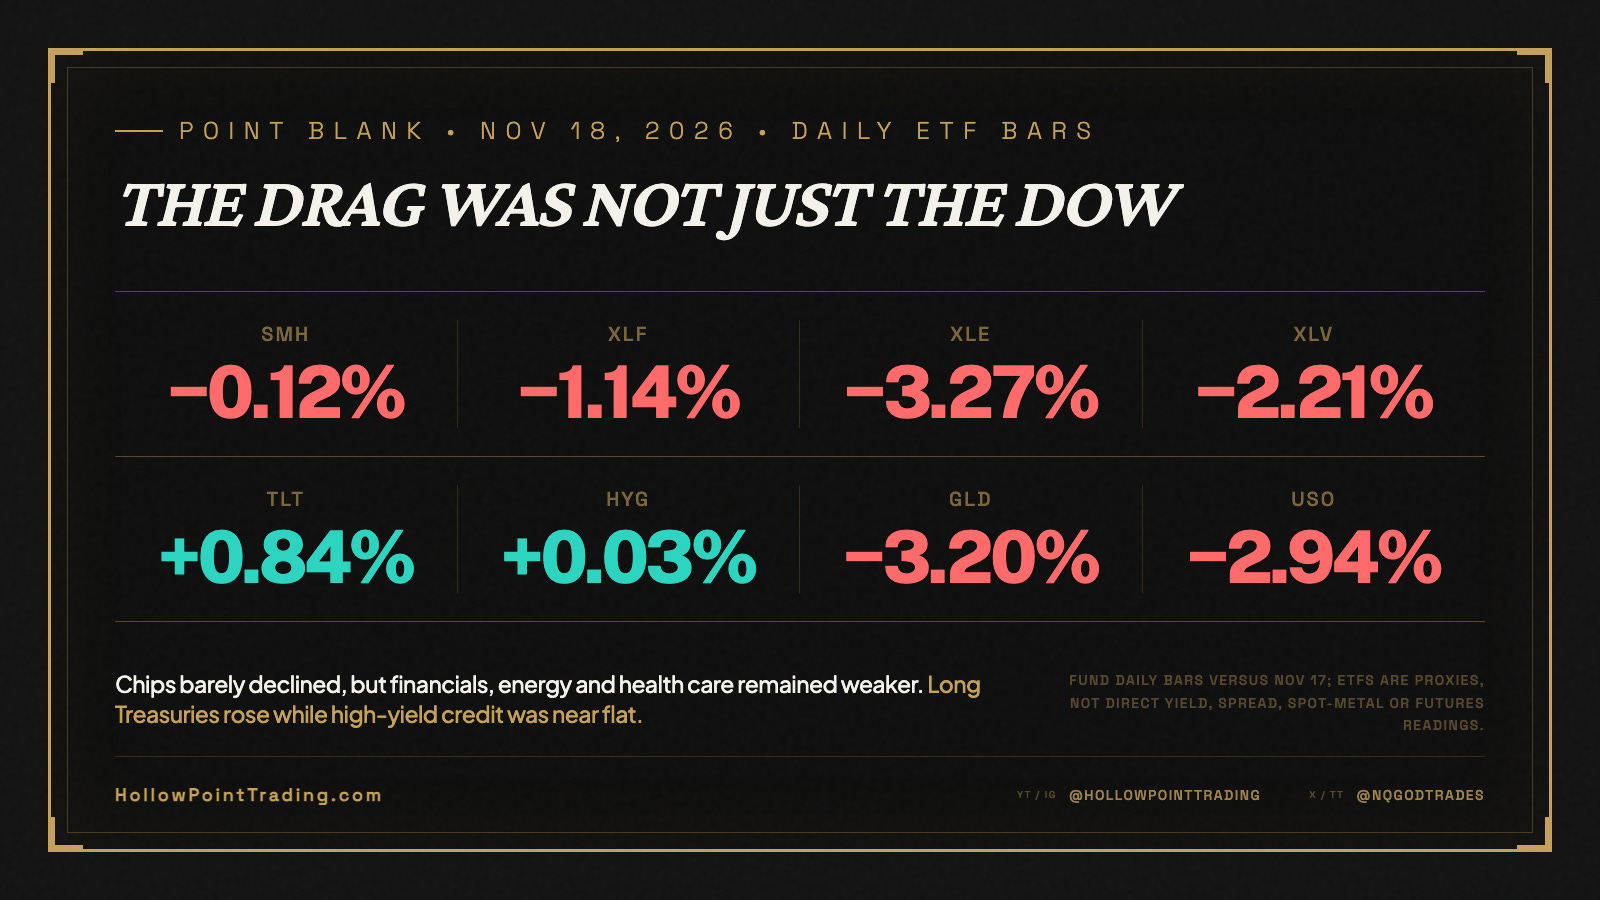
TLT ended $80.22, +0.84%; HYG $76.65, +0.03%; GLD $341.19, −3.20%; USO $136.11, −2.94%. These ETF bars are not direct Treasury yields, credit spreads, spot gold or futures settlement. TLT’s gain is consistent with a duration bid, but this set does not prove why it happened or establish a uniform risk regime.
SECTOR AND FUNDAMENTAL CHECK
SMH ended $459.54, −0.12%; XLF $56.42, −1.14%; XLE $61.29, −3.27%; XLV $181.15, −2.21%. Chips barely declined relative to energy and health care, but did not confirm QQQ’s positive bar. A sector ETF does not mean every constituent moved alike. Nvidia’s November 17 fiscal-third-quarter release reported $115.8 billion revenue including $107.6 billion from Data Center. That is company-level AI-demand evidence, not a sector-wide explanation for SMH or QQQ.
DECISION ROUTE
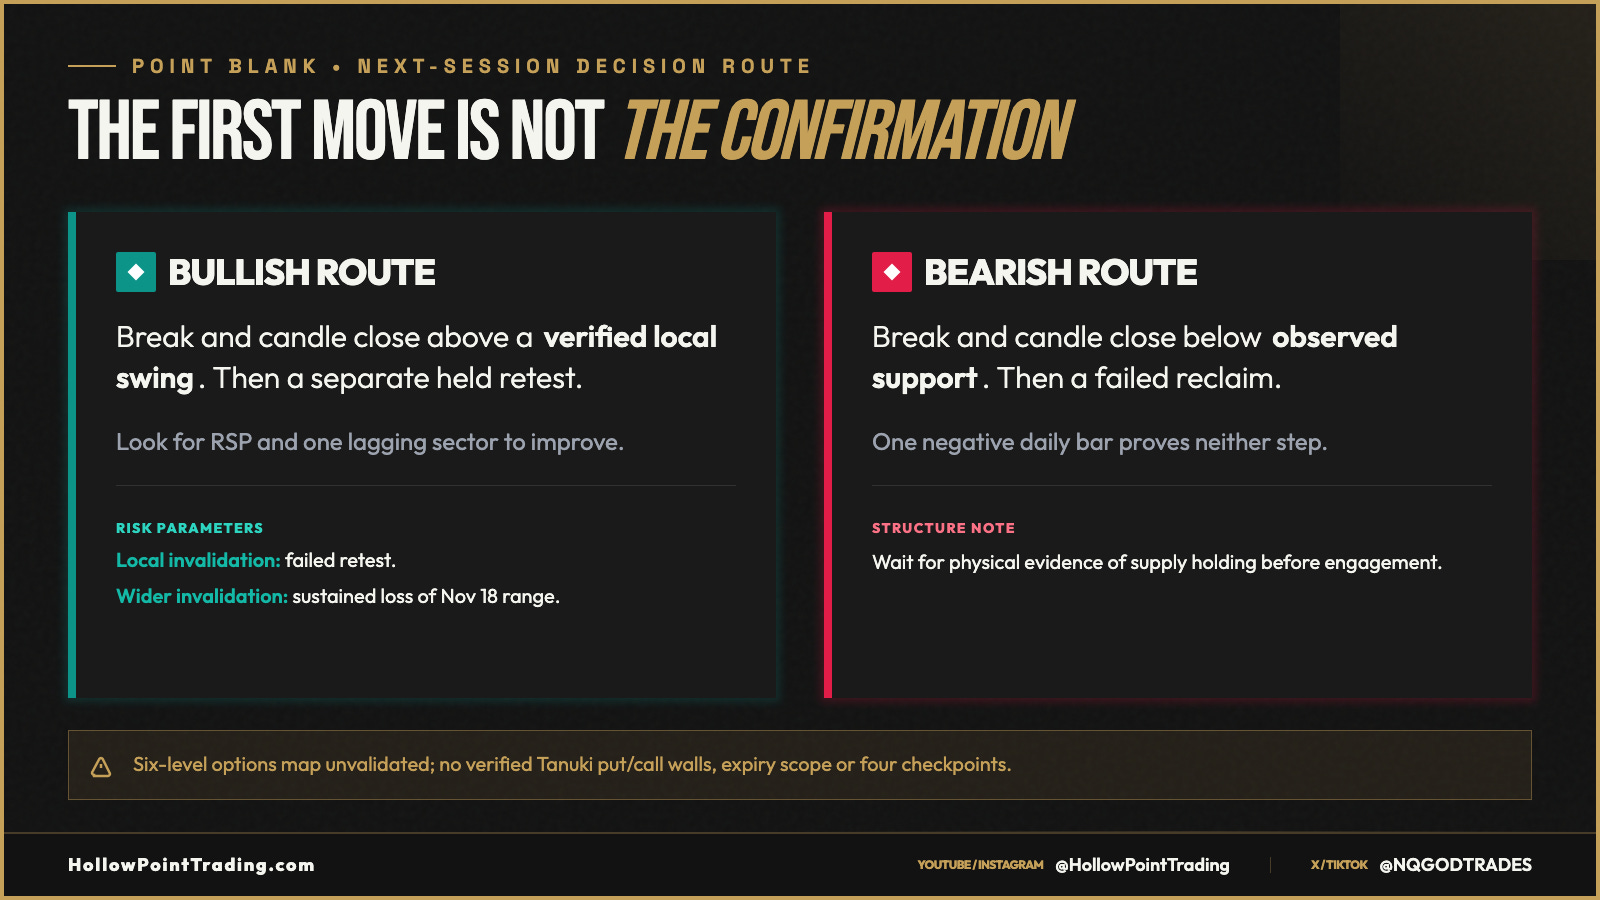
My lean is cautious with selective upside present. A constructive route needs a break and candle close above a verified local swing, then a separate held retest. RSP and at least one lagging sector improving would strengthen it. Failed retest is local invalidation; a sustained move below the broader November 18 range is wider invalidation. A bearish route needs a break and close below observed support, then a failed reclaim. One negative daily bar proves neither sequence. These attached cards are editorial market and decision visuals, not technical TradingView chart captures.
The six-level options map is unvalidated. Tanuki put/call wall definitions, symbol and expiry scope, underlying timestamp, and two upside and two downside checkpoints were not established. Fund prices cannot substitute for those walls. No gamma flip is claimed.
Question: Which next-session confirmation matters most: RSP joining QQQ, SMH turning positive, or the Dow and financials reclaiming prior bars?
Sources and cutoff: Alpaca delayed SIP stock snapshots retrieved November 18 after 3:30 p.m. Central; Nov 18 and Nov 17 daily ETF bars for the named funds; rounded percentages. After-3:00 p.m. latest trades in the response were excluded from daily-bar comparison. Federal Reserve October FOMC minutes released November 18 at 1:00 p.m. Central; Nvidia fiscal-Q3 investor release dated November 17. Daily bars can be revised and extended-hours prices differ.
HollowPointTrading.com | YouTube/Instagram: HollowPointTrading | X/TikTok: NQGODTRADES | Reddit: r/HollowPointTrading | Substack:
HollowPointTrading