
Point Blank | The Fed Minutes Meet an Uneven Market A post-release read: Nasdaq and small caps hold green while the Dow, chips and energy lag
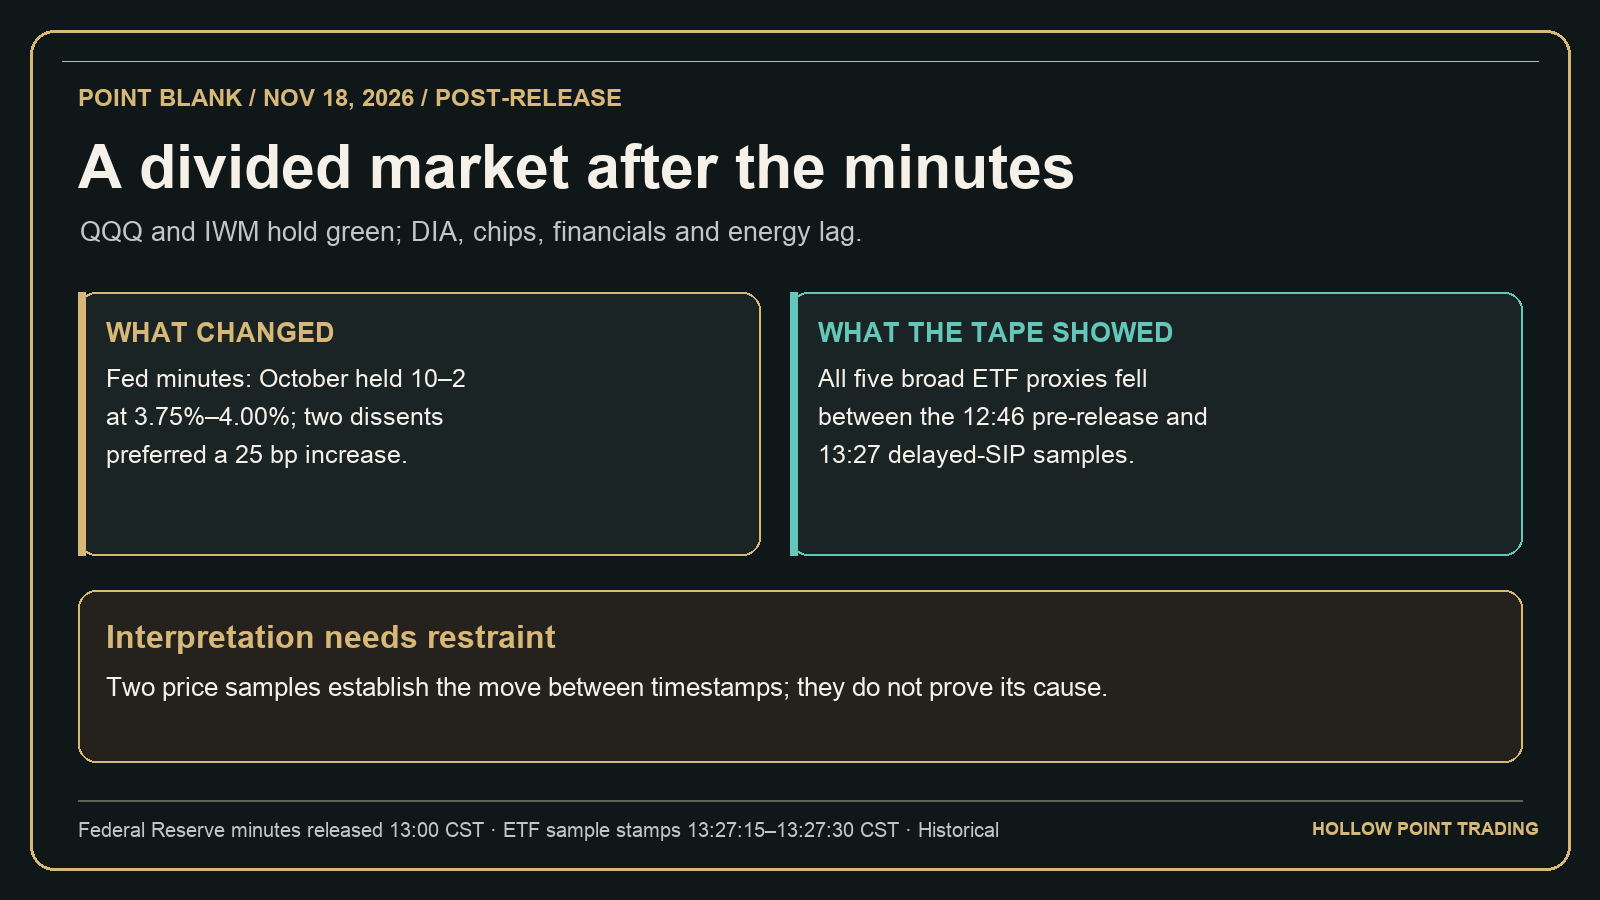
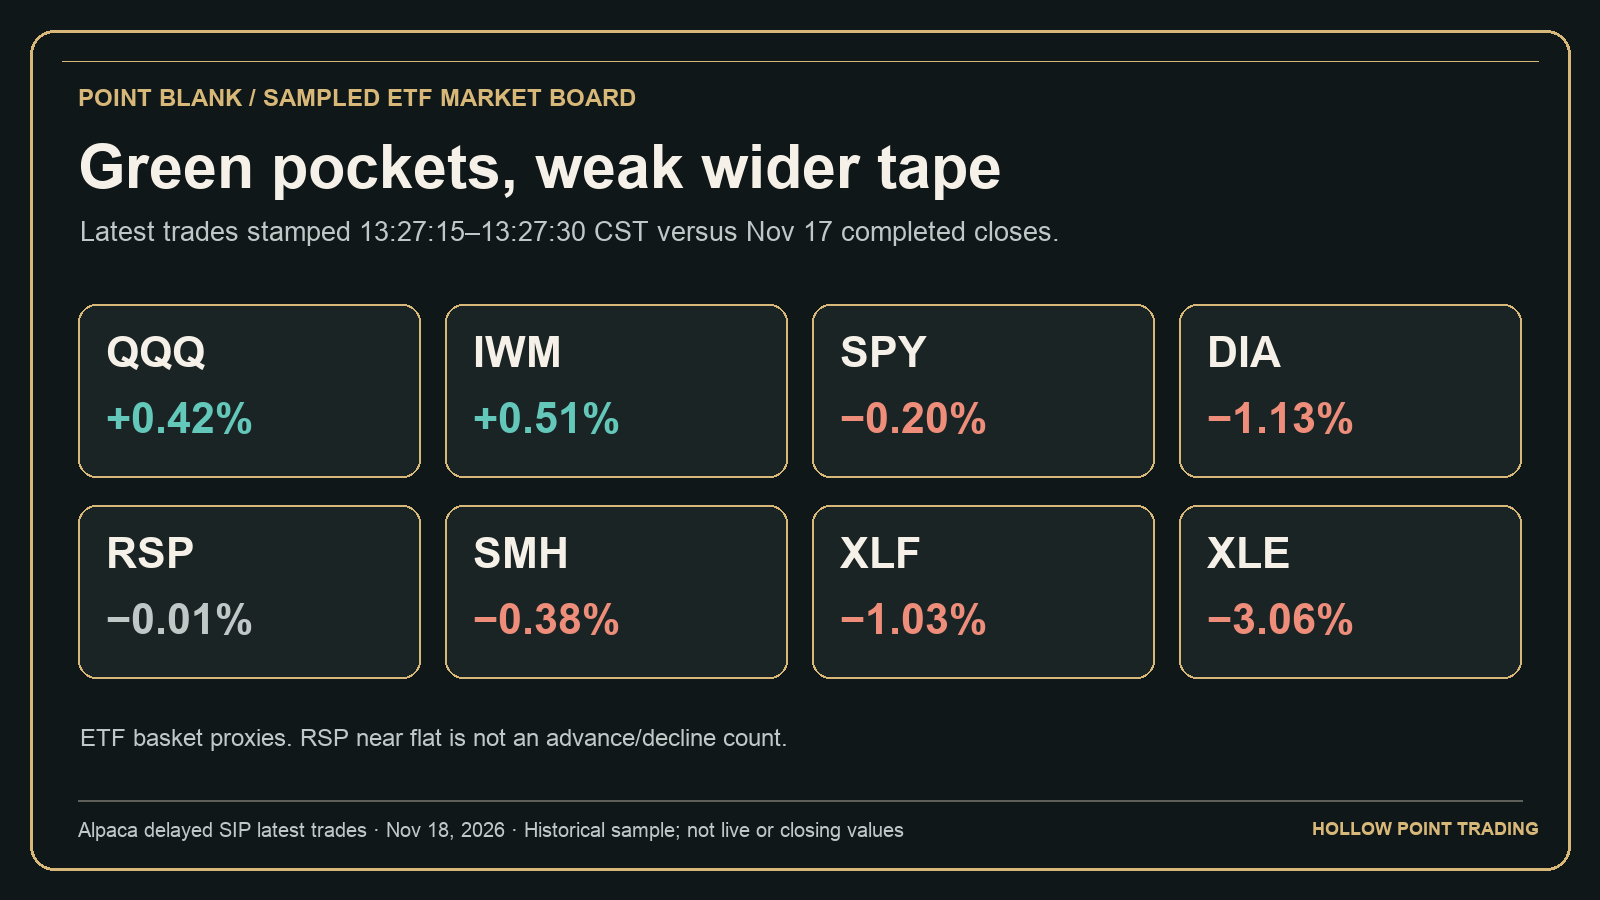
November 18, 2026. This edition follows the 1:00 p.m. CST release of the Federal Reserve's October 27–28 meeting minutes. The market board below uses Alpaca delayed SIP ETF latest trades stamped 1:27:15–1:27:30 p.m. CST, measured against November 17 completed closes. The sample is historical, not a live quote at publication or the final cash close. ETFs are proxies for baskets and assets, not cash-index values or advance/decline counts.
MARKET | THE HEADLINE DID NOT MAKE THE BOARD UNIFORM
At the sampled cutoff, QQQ traded at $659.71 (+0.42% versus its previous close), IWM at $270.41 (+0.51%), SPY at $730.99 (−0.20%), DIA at $501.60 (−1.13%) and equal-weight RSP at $215.74 (−0.01%). The Nasdaq and small-cap funds were positive, but the S&P fund slipped and the Dow proxy was much weaker. RSP near flat does not prove that half the index's constituents advanced; it says the equal-weight basket was near its preceding close. This is selective resilience, not a verified market-wide breakout.
Before the release, the separate sample around 12:46:29–12:47:01 CST had SPY $733.61, QQQ $661.93, IWM $271.96, DIA $503.85 and RSP $216.58. Every one of those five fund prices was lower by the 1:27 sample. That two-point comparison establishes a decline between observations. It does not establish that the minutes alone caused it, measure the immediate first-minute reaction, or describe every intervening swing.
MACRO | WHAT THE OCTOBER MINUTES ACTUALLY SAY
The October committee voted 10–2 to hold the federal funds target range at 3.75%–4.00%. Both dissenters preferred a 0.25 percentage-point increase at that meeting. The released minutes say almost all participants expected another increase under their baseline outlooks for inflation and employment. This is the October discussion released today, not a new rate decision or a commitment about the size and date of the next move. Incoming data and the next meeting can change the path.
The 1:27 sample gives a mixed cross-asset check. TLT, a long-Treasury ETF, was $80.18 (+0.80% versus its previous close); HYG, a high-yield bond ETF, was $76.66 (+0.03%). GLD, a gold ETF rather than spot bullion, was $341.55 (−3.10%). TLT's gain cautions against saying that longer-duration bonds uniformly sold off after the minutes. These ETF prices are not a live Treasury yield curve, and the mixed set does not identify a single driver of the equity move.
Earlier today the Census Bureau and HUD released October housing construction data. Permits were 1.295 million at a seasonally adjusted annual rate, 7.4% below revised September. Starts were 1.309 million; the reported 9.9% monthly rise carried a ±16.8 percentage-point margin of error at the agency's stated 90% standard, so it was not statistically distinguishable from zero. Permits and starts measure different stages of the pipeline. Neither release by itself explains the sampled afternoon ETF split.
FUNDAMENTAL | TECHNOLOGY IS NOT THE SAME AS SEMICONDUCTORS
XLK, the broad technology-sector fund, was $163.69 (+0.26%), while semiconductor fund SMH was $458.33 (−0.38%). Industrials fund XLI was $164.80 (+0.03%), but financials XLF was $56.48 (−1.03%) and energy XLE was $61.42 (−3.06%). Health care XLV was $181.22 (−2.17%). That makes the QQQ gain less convincing as a broad growth signal: the chip fund and several economically sensitive sectors were below their prior closes.
Nvidia's November 17 fiscal-third-quarter release reported $115.8 billion of revenue, including $107.6 billion in Data Center revenue, evidence of company-level AI infrastructure demand. That fundamental result cannot be projected onto every semiconductor or used to explain today's SMH decline without further evidence. Watch whether the broad technology fund's relative strength spreads to chips and the equal-weight basket, or remains concentrated in a narrower set of names.
TECHNICAL DECISION ROUTE | CONFIRMATION MUST COME AFTER THE FIRST MOVE
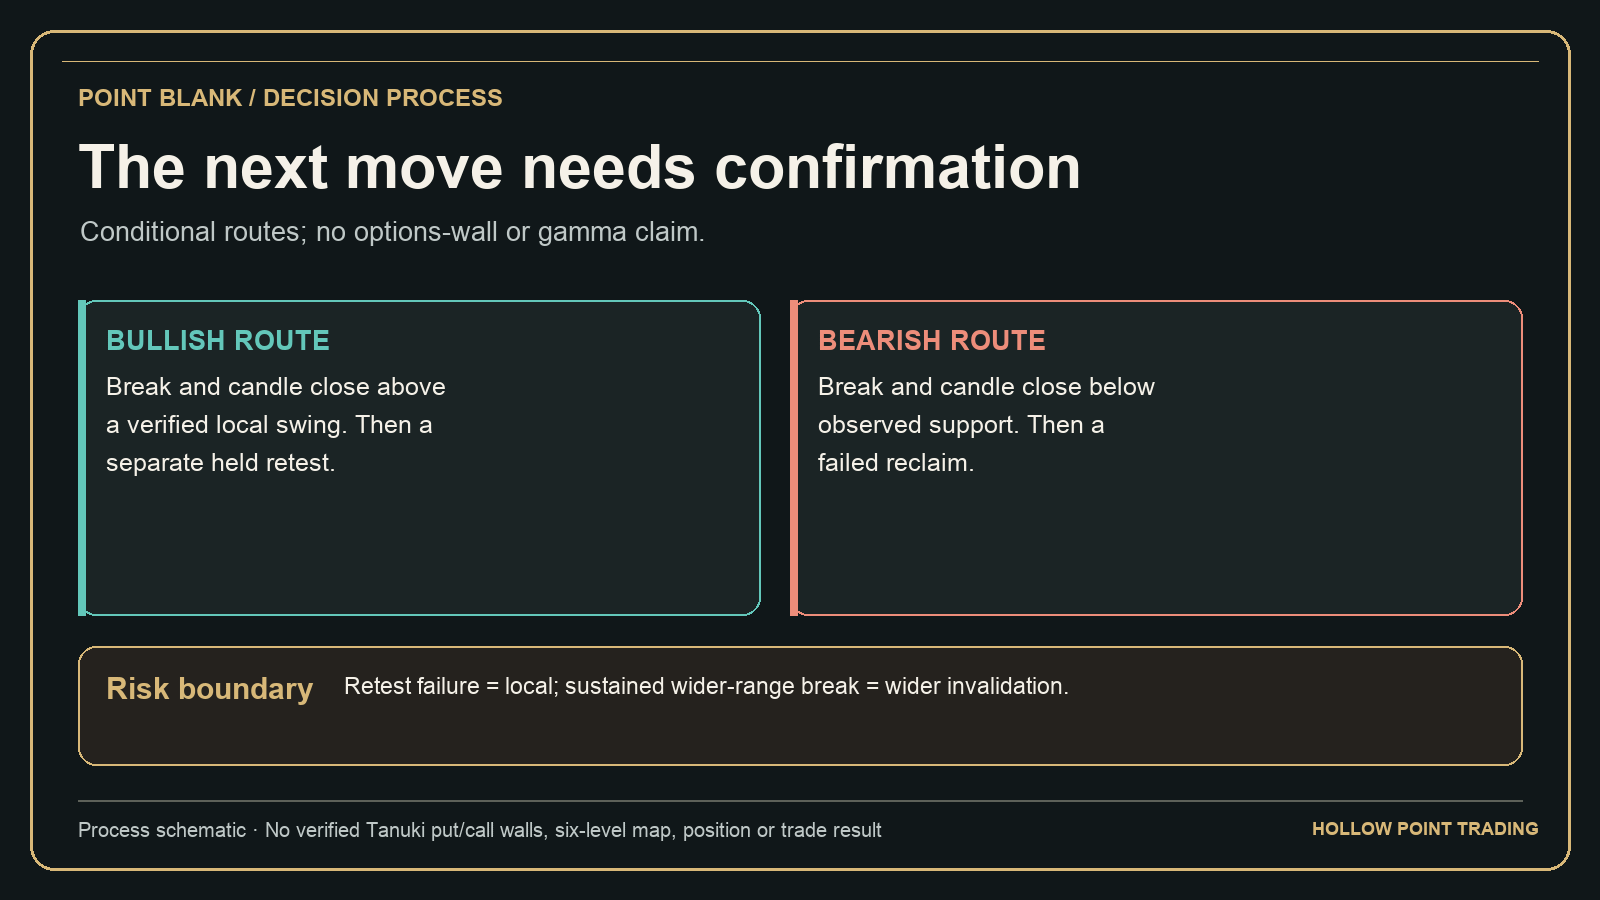
My directional lean from this sample is cautious and selectively constructive, with a weak wider tape. QQQ and IWM remained above their preceding closes, but SPY, DIA, SMH, XLF, XLE and XLV were below theirs. A bullish route requires a break and candle close above a verified local swing, followed by a separate held retest. Improvement in RSP and a lagging sector such as chips or financials would make that case more credible. A failure of the held retest is local invalidation; a sustained break below the broader completed cash-session range is wider invalidation.
A bearish route requires a break and candle close below observed support, followed by a failed reclaim. One sharp headline candle, or two sampled fund prices, establishes neither sequence. Position size and stop placement need to account for event-driven gaps and spreads, especially near the close.
The six-level options map is not validated for this edition. I have not established authenticated Tanuki put-wall and call-wall definitions, expiry scope or source timing, nor two verified upside and two downside checkpoints. Fund prices, Fibonacci marks and generic support lines are not substitutes for those walls. The accompanying panels are market-data and decision-process graphics, not native TradingView price-chart captures or a claim of a verified gamma flip.
Question: To judge whether the post-minutes weakness is spreading, which confirmation matters most to you before the close: equal-weight RSP, semiconductor SMH, financials XLF, or the long-bond response?
Source and timing: Federal Reserve October 27–28 FOMC minutes, released November 18 at 13:00 CST; Alpaca delayed SIP ETF snapshots with individual latest trades stamped 13:27:15–13:27:30 CST on November 18 and November 17 completed closes; separate pre-release sample stamped 12:46:29–12:47:01 CST; U.S. Census Bureau/HUD October New Residential Construction released November 18 at 07:30 CST; Nvidia fiscal-third-quarter investor release November 17. Percentage changes here are calculated from the sampled latest ETF trade and previous completed daily close, rounded to two decimals. The comparison is historical, not a live quote or closing value.