POINT BLANK | THE PARTICIPATION TEST AFTER A SPLIT CLOSE
November 18, 2026, evening post-session review. All ETF prices below are the completed November 18 regular-session bars, compared with November 17, from the authenticated market-data pull recorded at 4:51 p.m. Central in the earlier original. This is a fresh interpretation of that completed session, not an intraday update or an extended-hours quote. The same source cutoff applies to every ETF number in this post.
THE WHOLE-MARKET MAP
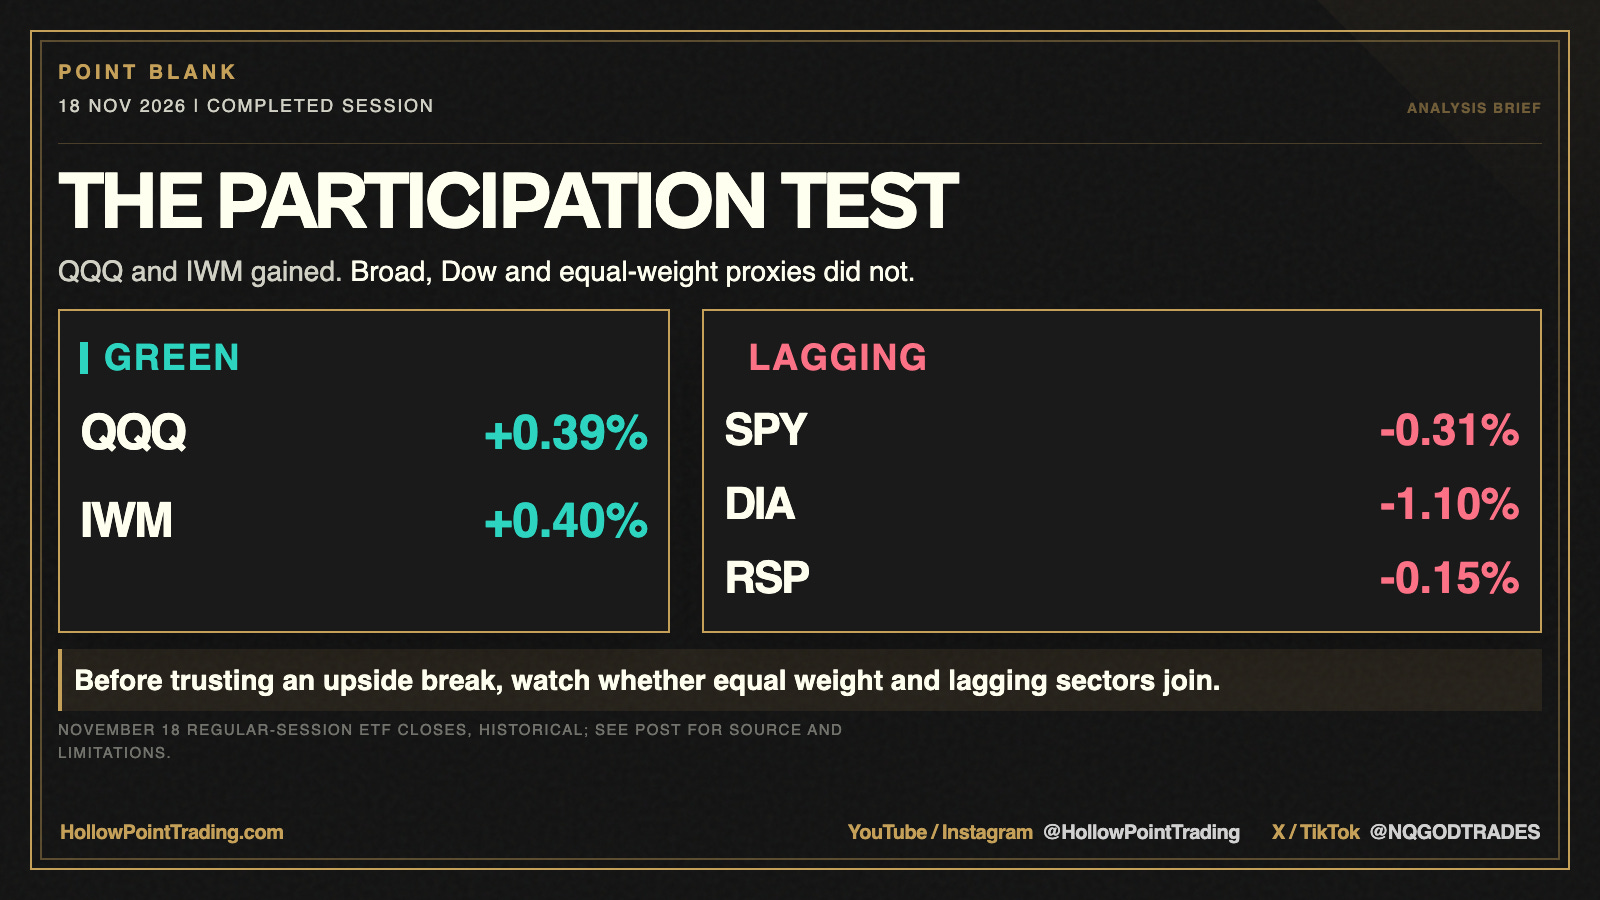
The large-cap growth proxy QQQ closed at $659.51 (+0.39%), and small-cap proxy IWM at $270.12 (+0.40%). That apparent two-sided strength did not carry the broad proxy SPY, which closed $730.20 (−0.31%), the Dow proxy DIA at $501.73 (−1.10%), or equal-weight RSP at $215.43 (−0.15%). The first question for the next session is therefore not whether QQQ finished green. It is whether strength can broaden beyond the green funds while the laggards stop losing ground.
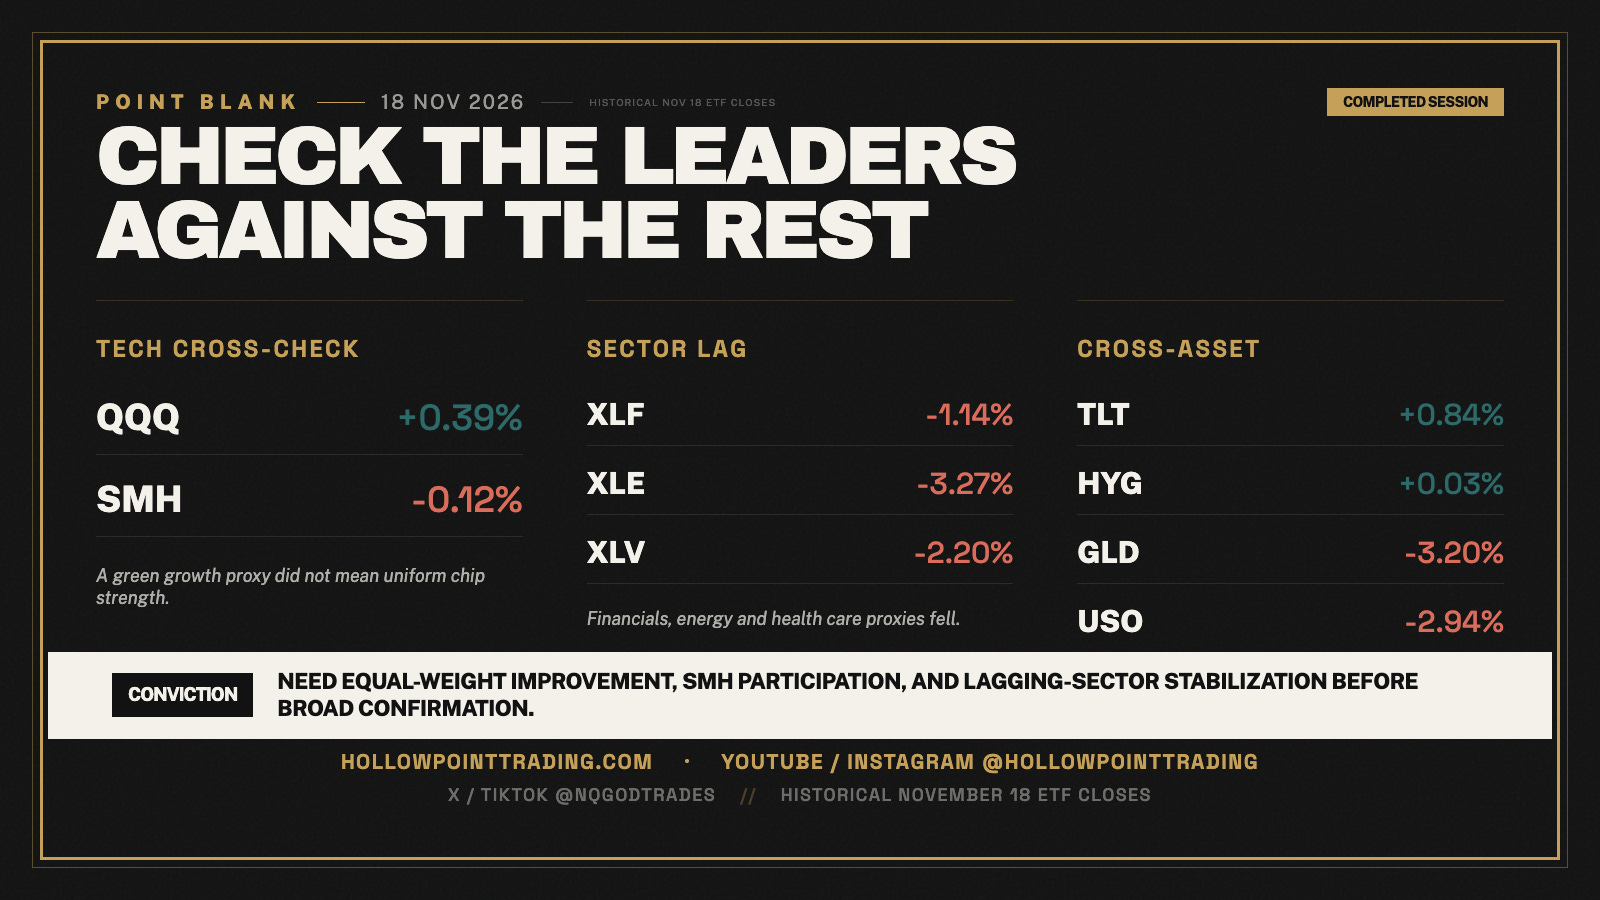
The sector cross-check makes that distinction sharper. SMH was $459.54 (−0.12%) despite QQQ’s gain. XLF fell to $56.42 (−1.14%), XLE to $61.29 (−3.27%) and XLV to $181.17 (−2.20%). This selection does not constitute a constituent advance/decline count or a complete sector ranking. It does show why one green index or ETF cannot stand in for uniform participation.
Cross-asset funds were mixed as well. TLT ended at $80.22 (+0.84%), HYG at $76.65 (+0.03%), GLD at $341.19 (−3.20%) and USO at $136.11 (−2.94%). These are fund closes, not Treasury yields, credit spreads, spot gold or spot crude. The apparent bond-fund firmness alongside energy- and gold-fund weakness makes a single risk-on/risk-off label too blunt.
WHAT CHANGED IN THE INTERPRETATION
Earlier today, the headline was the Fed minutes and their AI-financing discussion. This evening’s decision problem is narrower: which part of the market must confirm a growth-led move before I treat it as a broader advance? My first check is RSP versus SPY, then whether SMH stops lagging QQQ, then whether financials, energy and health care stabilize. RSP is an equal-weight portfolio; it is not a count of advancing stocks. I will not call its price a verified breadth statistic.
The dated macro catalyst remains the Federal Reserve’s November 18 release of the October 27–28 FOMC minutes. The minutes discussed AI-related debt, off-balance-sheet leasing and circular financing as potential financial-stability amplifiers if returns disappointed. That discussion is a risk map, not evidence that losses have already materialized, and it does not prove the minutes caused the ETF closes.
THE NEXT-SESSION ROUTES
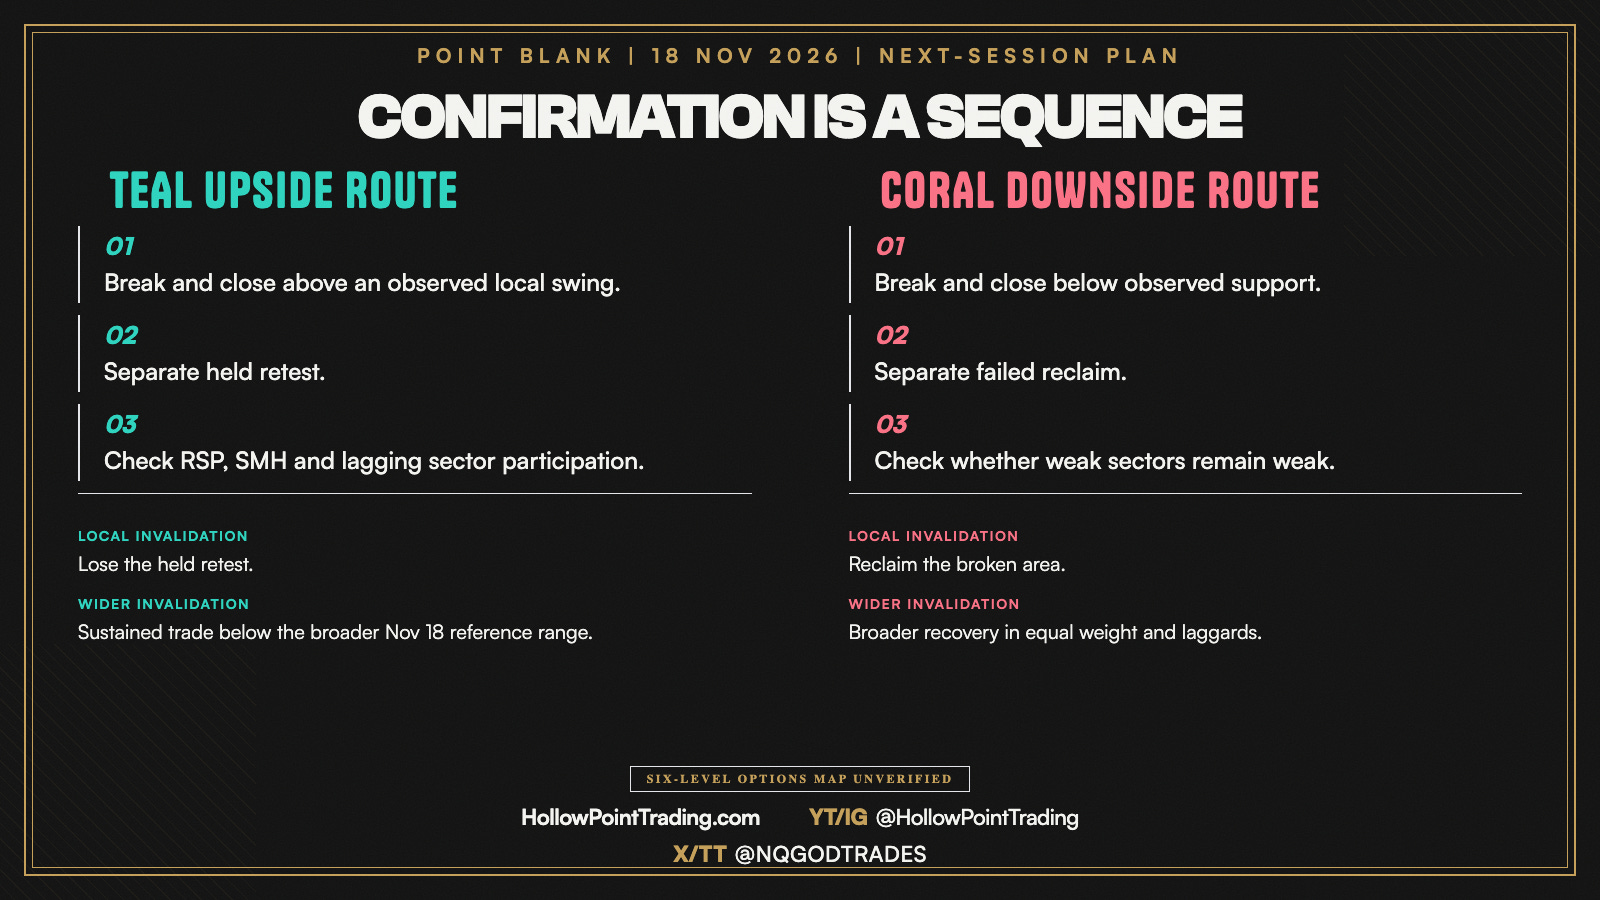
My directional lean is cautious until participation improves. A bullish route needs an observed break and close above a local swing, then a separate held retest; a greener RSP and a firmer SMH would improve the case. A close above a level without the held retest is an incomplete sequence. Losing the retest invalidates the local bullish idea; sustained trade back below the wider November 18 reference range challenges the broader advance thesis.
A bearish route requires a break and close below observed support followed by a failed reclaim on a separate test. A weak opening print alone does not satisfy that sequence. Reclaiming the broken area would invalidate the local bearish read, while a wider recovery across equal weight and the lagging sectors would challenge the broader bearish thesis. Because no genuine native TradingView technical chart or verified Tanuki option-wall map is attached here, I am deliberately describing the route conceptually rather than inventing exact price triggers or six decision levels.
The six-level options map remains incomplete: the verified put wall, call wall, two upside checkpoints and two downside checkpoints require authenticated Tanuki definitions, exact symbol and expiry scope, underlying data timestamp and independent level validation. Fund closes and Fibonacci lines cannot stand in for those walls.
Question for the next session: would you need RSP to join QQQ, SMH to reclaim relative strength, or both before trusting an upside break?
Sources and time: November 18 and November 17 ETF daily bars from the authenticated market-data pull at 4:51 p.m. Central, previously recorded in this thread’s 18:00 original; Federal Reserve, October 27–28 FOMC minutes, released November 18, https://www.federalreserve.gov/monetarypolicy/fomcminutes20261028.htm. The market observations are historical completed-session values and can revise. No current intraday or live options reading is implied.
HollowPointTrading.com | YouTube/Instagram @HollowPointTrading | X/TikTok @NQGODTRADES | Reddit r/HollowPointTrading | Substack @HollowPointTrading