
Pool Corporation’s second-quarter sales grew while its gross margin narrowed. Removing CEO transition costs improved the operating-profit comparison, but it did not remove the pressure higher in the income statement. Ahead of the company’s newly announced October 22 earnings release, that distinction gives investors a more useful question than whether one adjusted earnings number beats another.
Hollow Point Trading research · October 9, 2026. The current catalyst is the company’s October 8 reporting-date announcement. Financial comparisons below are historical June-quarter results released July 23. The genuine daily chart was exported October 9 at 14:03:11 America/Chicago during the regular U.S. cash session; its daily candle is still forming. These clocks describe different evidence, rather than a new earnings report today.
Macro — distribution demand and pricing have different tests
The sector lens is consumer spending; the narrower theme is wholesale swimming-pool and backyard distribution. Pool Corporation supplies a network of trade customers rather than selling a single financial exposure to housing activity. Its October announcement describes approximately 455 sales centers and roughly 125,000 wholesale customers. That scale establishes the type of business being studied, rather than the strength of demand in any particular week.
Existing equipment and a new discretionary project create different purchasing decisions. Routine upkeep can continue when a household postpones a larger improvement, but that possibility is not a measurement of current maintenance volume. Weather, financing costs and the mix of customer orders can affect the amount and timing of sales. This edition has no verified new economy-wide pool-demand series or product-level volume split, so it does not assign the quarter’s growth to one of those channels.
The useful macro question is consequently specific: can the distributor retain sufficient gross profit when the composition and cost of what it sells change? Revenue includes both quantities and prices. An increase in sales dollars alone cannot establish that more units moved, that new construction recovered, or that an installed customer base insulated margins. Those conclusions need their own comparable evidence.
Fundamental — the adjustment does not reach every line
Pool’s July 23 release reports second-quarter sales of $1.823 billion, up 2%, and gross profit of $540.8 million, up 1%. Gross margin fell from 30.0% to 29.7%, a 30-basis-point decline. Management identified higher inbound freight costs and customer mix, partly offset by supply-chain initiatives. These are company explanations for that historical quarter; they are not a forecast of the next quarter’s result.
Reported operating income was $267.7 million, down 2%. Excluding $8.3 million of CEO transition costs produced adjusted operating income of $275.9 million, up 1%. The reported and adjusted figures answer different questions. The adjustment helps isolate that identified expense, while the gross-margin comparison still describes the spread between sales and cost of sales. It would be incorrect to say the CEO adjustment erased the 30-basis-point gross-margin decline.
Here is an explicitly hypothetical illustration of the distinction. A distributor sells $100 of goods and retains $30 after their cost; later it sells $102 and retains $30.30. Gross-profit dollars increased, but the retained percentage fell from 30% to approximately 29.71%. A separate office expense can change operating profit without changing either of those gross-profit calculations. These invented amounts teach the denominator; they are not additional Pool results.
For October 22, compare the same period definitions before drawing a conclusion. A constructive business reading would need evidence that comparable demand and gross-profit economics hold together, with any adjustments explained consistently. The cautious reading would strengthen if a larger sales total continued to carry a thinner gross spread or depended on an unverified mix improvement. Neither outcome is known in this edition.
The next research checkpoint is concrete: the company says third-quarter results will arrive before the market opens October 22, with a conference call at 10 a.m. Central that day. Record sales, gross margin, the operating-expense bridge and management’s explanation separately. If the presentation changes, reconcile the definitions. An attractive adjusted comparison can be useful without being a complete explanation of the underlying economics.
Technical — a small bounce inside a larger decline
The native TradingView export identifies POOL on the NASDAQ listing, observed through the BATS:POOL / Cboe One feed, on the daily timeframe. Its forming October 9 candle reads open $158.71, high $159.14, low $156.59 and captured latest $159.14. The established 55 EMA is $176.76; RSI(14) is 34.91 in the sole lower panel. The candle legend and latest-price scale agree in the saved pixels.
The visible July-to-October sequence shows a summer rebound followed by renewed lower prices into October. The latest bar is positive relative to its previous reference, yet it remains below the declining average. RSI has recovered from a recent lower reading but remains below 50. Together these observations describe an early bounce within weak daily structure; they do not confirm a completed reversal or identify the reason investors bought shares.
Constructive branch: a later completed daily close above the captured $159.14 high, followed by a retest that holds, would provide a first narrow continuation test. The nearby $160 area is a round-number reference, not a proven supply boundary. A move through it that quickly fails back below would weaken that immediate interpretation. The much farther $176.76 average supplies trend context and changes with subsequent prices; it is not a promised target.
Pullback branch: a test of the captured $156.59 session low followed by a reclaim could preserve the immediate bounce question. A sustained loss and failed reclaim would challenge it. These are unfinished daily-candle boundaries, not established multiweek support or fixed stop orders. The broader low region around $152–155 is approximate visible historical context, and it would need a fresh price response before being called defended support.
Base branch: price stays between its recent low area and the declining average while the earnings evidence remains unresolved. That is a valid research state. Improving price action cannot establish stronger distribution margins, and an encouraging margin explanation cannot confirm a price breakout. Require the business and chart to meet their respective tests instead of allowing either to substitute for the other.
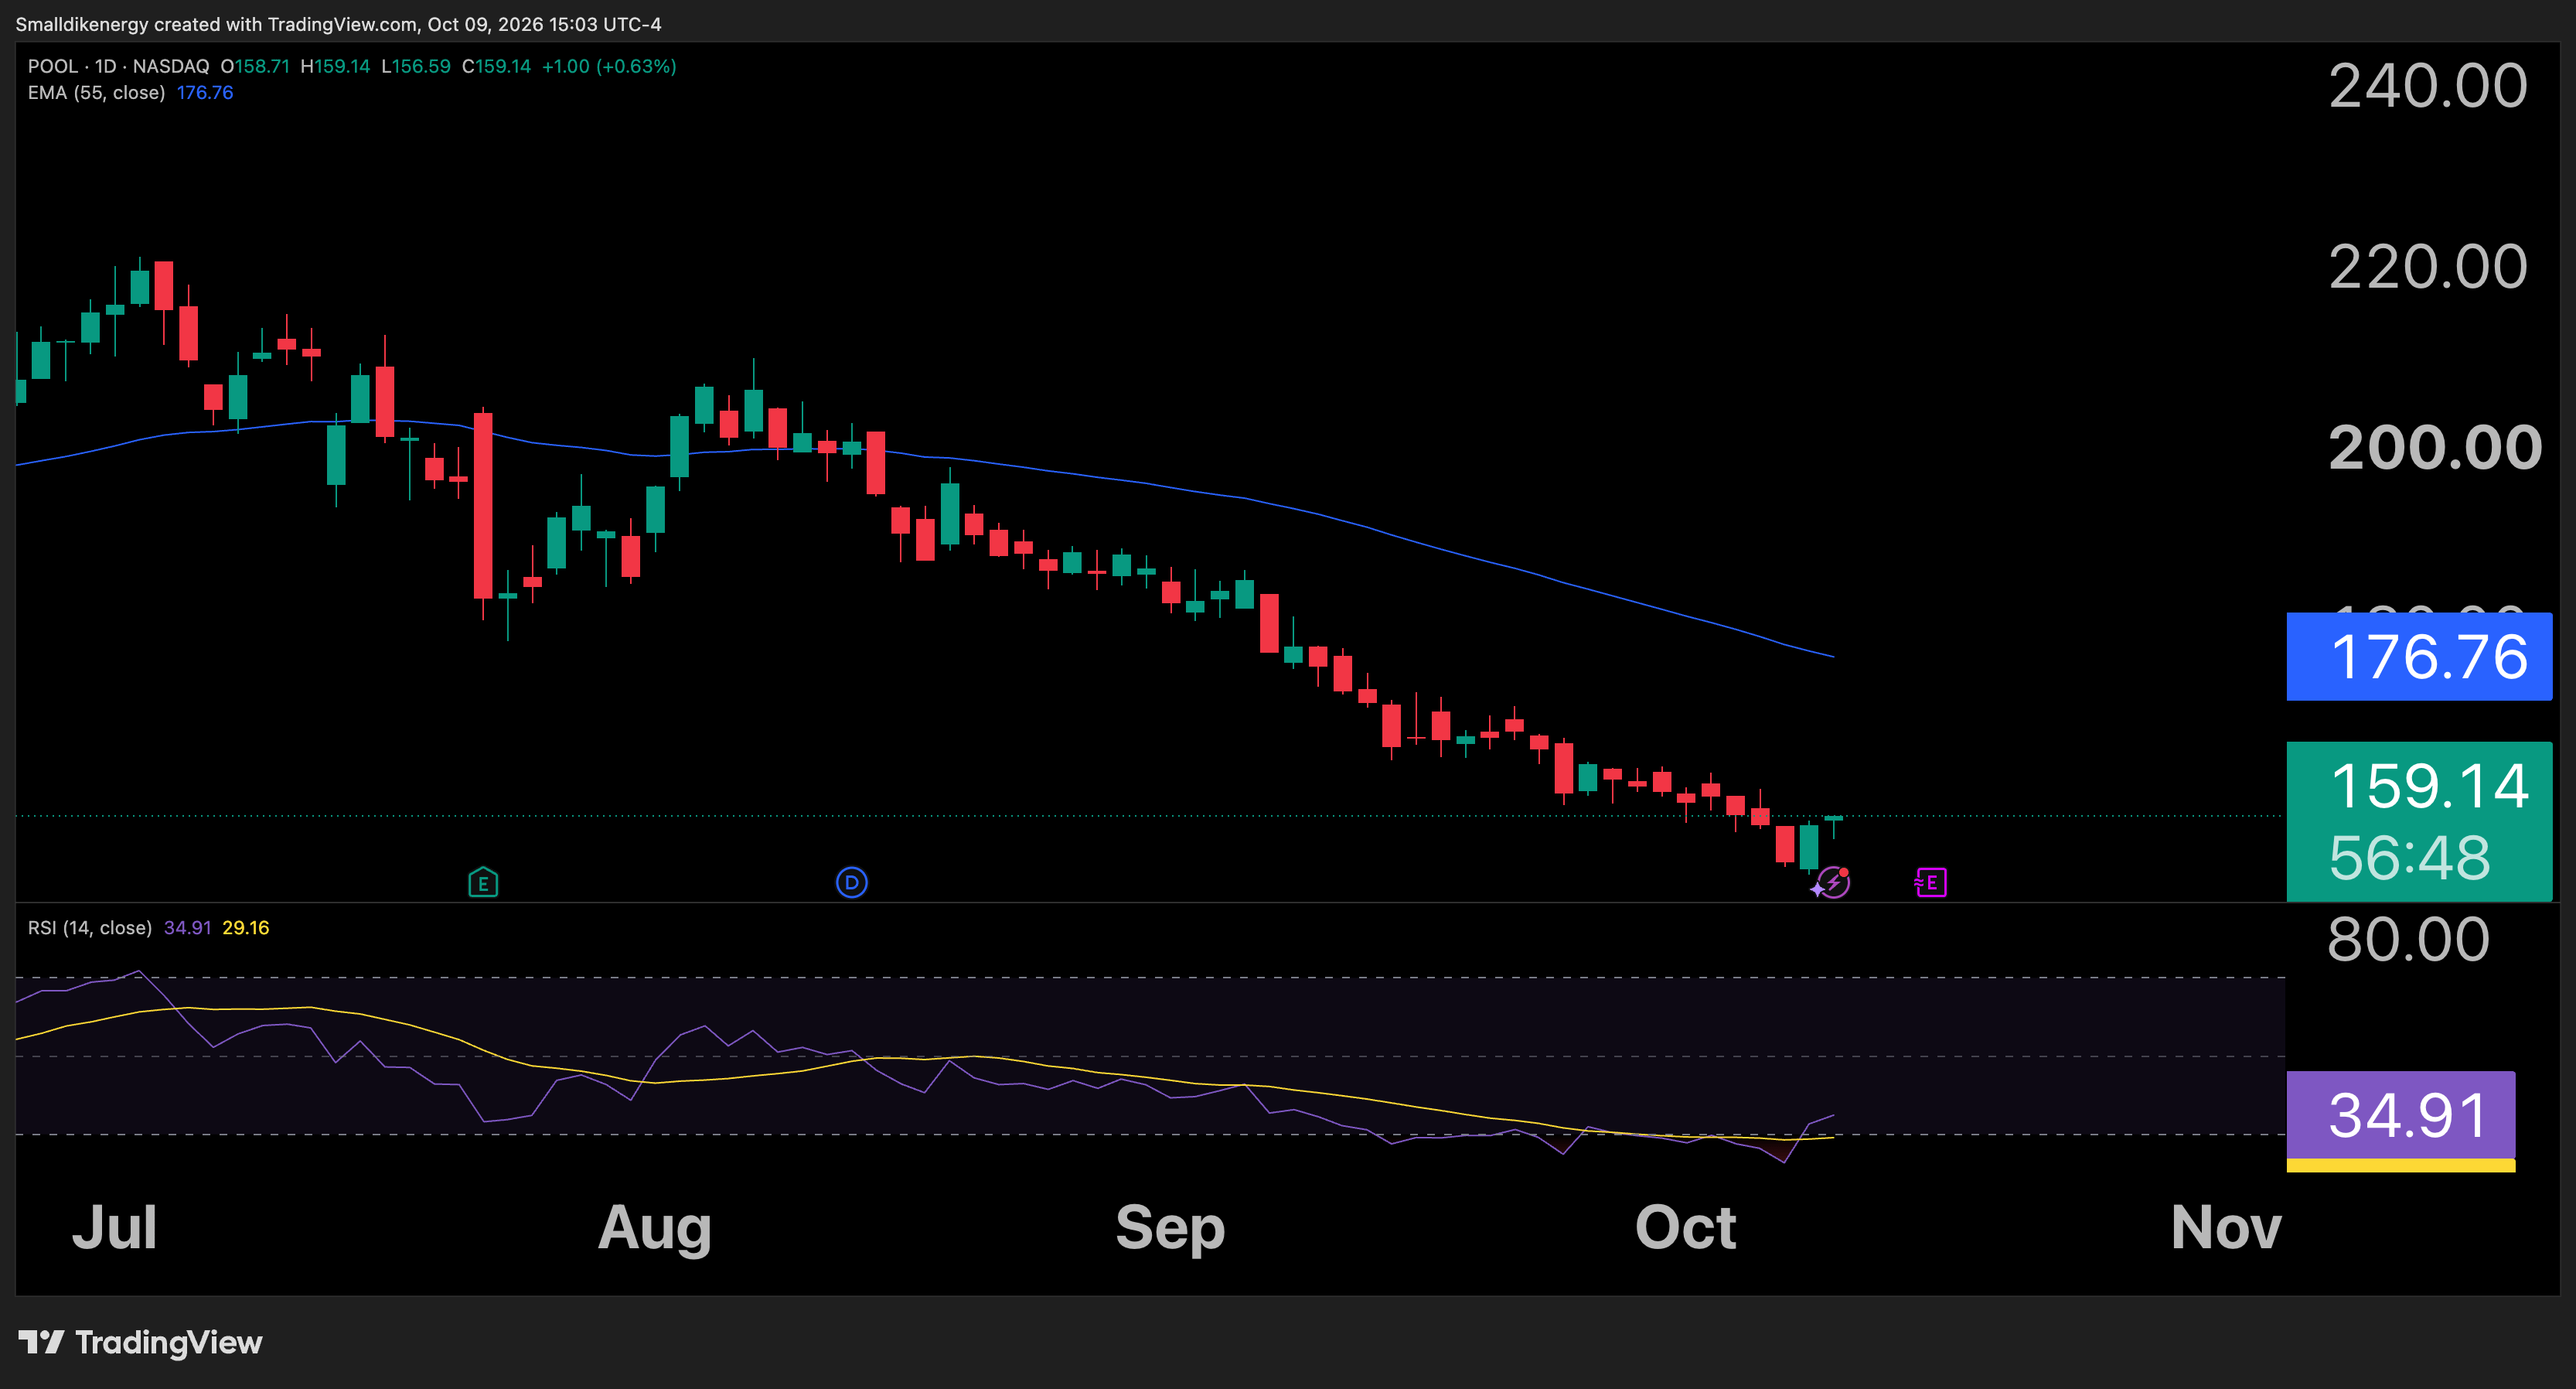
Genuine native TradingView POOL 1D export, NASDAQ listing / observed BATS:POOL Cboe One feed, October 9, 2026 at 14:03:11 America/Chicago. Forming regular-session candle O/H/L/latest $158.71/$159.14/$156.59/$159.14; 55 EMA $176.76, RSI(14) 34.91, RSI-only lower panel. Candles and scale agree. Static intraday reference, not a completed close, executable quote or guaranteed outcome.
Risk and the next evidence checkpoint
October 9’s completed daily bar is the next chart checkpoint; October 22 is the announced financial checkpoint. Earnings gaps, market repricing and company-specific news can carry shares through a static reference before a planned order fills. This analysis supplies no holding, transaction, valuation target or personalized allocation. Educational research only; trading involves substantial risk, and neither a moving average nor a financial adjustment limits loss.
The practical takeaway is to keep three records distinct: the amount sold, the gross spread retained, and expenses adjusted below that spread. Then judge the stock on its own completed price response. A small rebound becomes more informative when its confirmation and failure conditions stay visible beside the dated business question.
Primary sources
Pool Corporation · July 23, 2026 second-quarter release and reconciliation
Pool Corporation · October 8 announcement of October 22 results and call
For Pool’s October 22 update, which would change your view first: the gross-margin explanation, a held daily reclaim, or a failed bounce—and what would invalidate your interpretation?