
QQQ gained 0.88% on October 5, but semiconductors barely moved. Software and biotech did more of the work. That is the useful question behind tonight’s market recap: is leadership spreading enough to support the breakout, or are the winners simply taking turns?
Watch the full HPT market recap with the live chart walkthrough.
The index levels come first
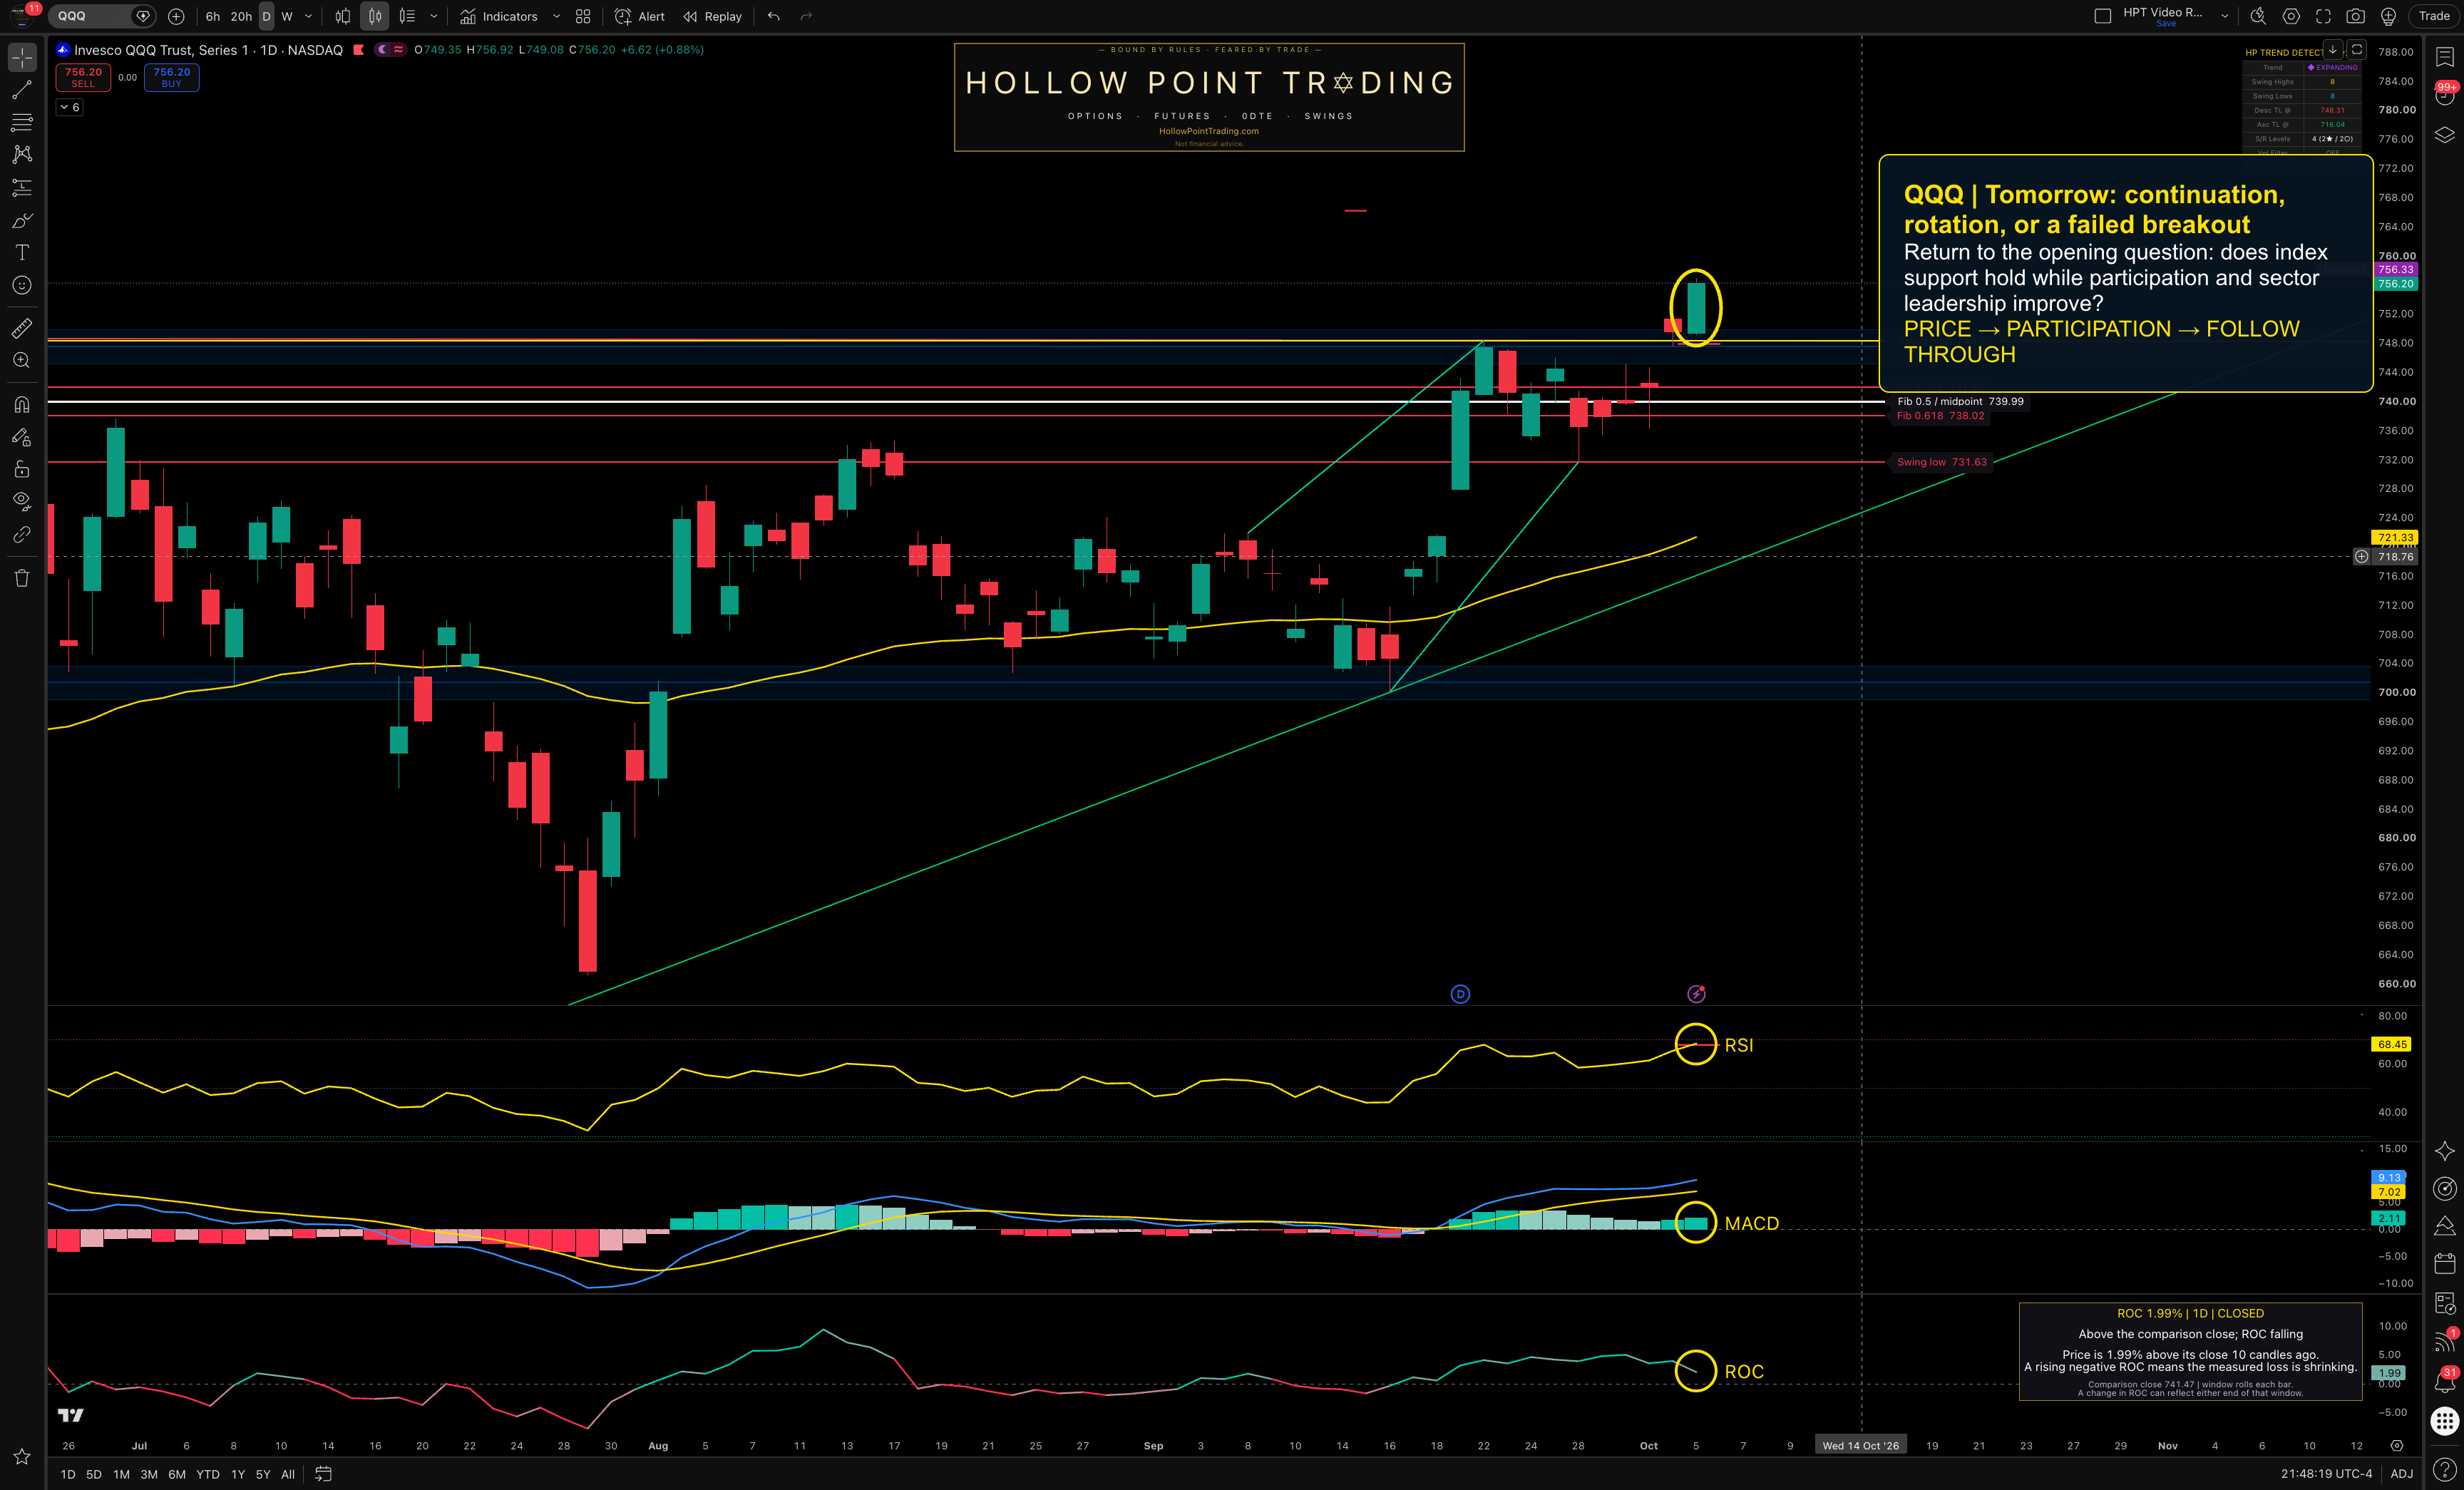
QQQ closed at $756.20. The first upside test is $756.92, today’s high. Break that level and hold above it, and buyers are extending the move. A quick push through followed by a rejection is a different result.
Underneath, $749.08 is today’s low. The older $748.35 swing high adds context to that nearby support area. A pullback that finds buyers there can be constructive. Losing the area and failing to reclaim it weakens the breakout case. These are price references, not independently verified options walls.
SPY gained 0.67% and closed at $774.83. Its matching range is $776.61 above and $769.63 below. Keep the decision simple: reclaim and hold the high for improvement; lose the low and fail to recover for deterioration. An intraday wick is not the same as sustained acceptance.
Participation improved without fully repairing
RSP, the equal weight S&P 500 fund, rose 0.66%, almost matching SPY’s 0.67%. Today’s result therefore does not support the claim that only a handful of giant companies advanced. It does not erase earlier relative weakness either. RSP closed at $211.12, with a $211.45 high and $208.92 low.
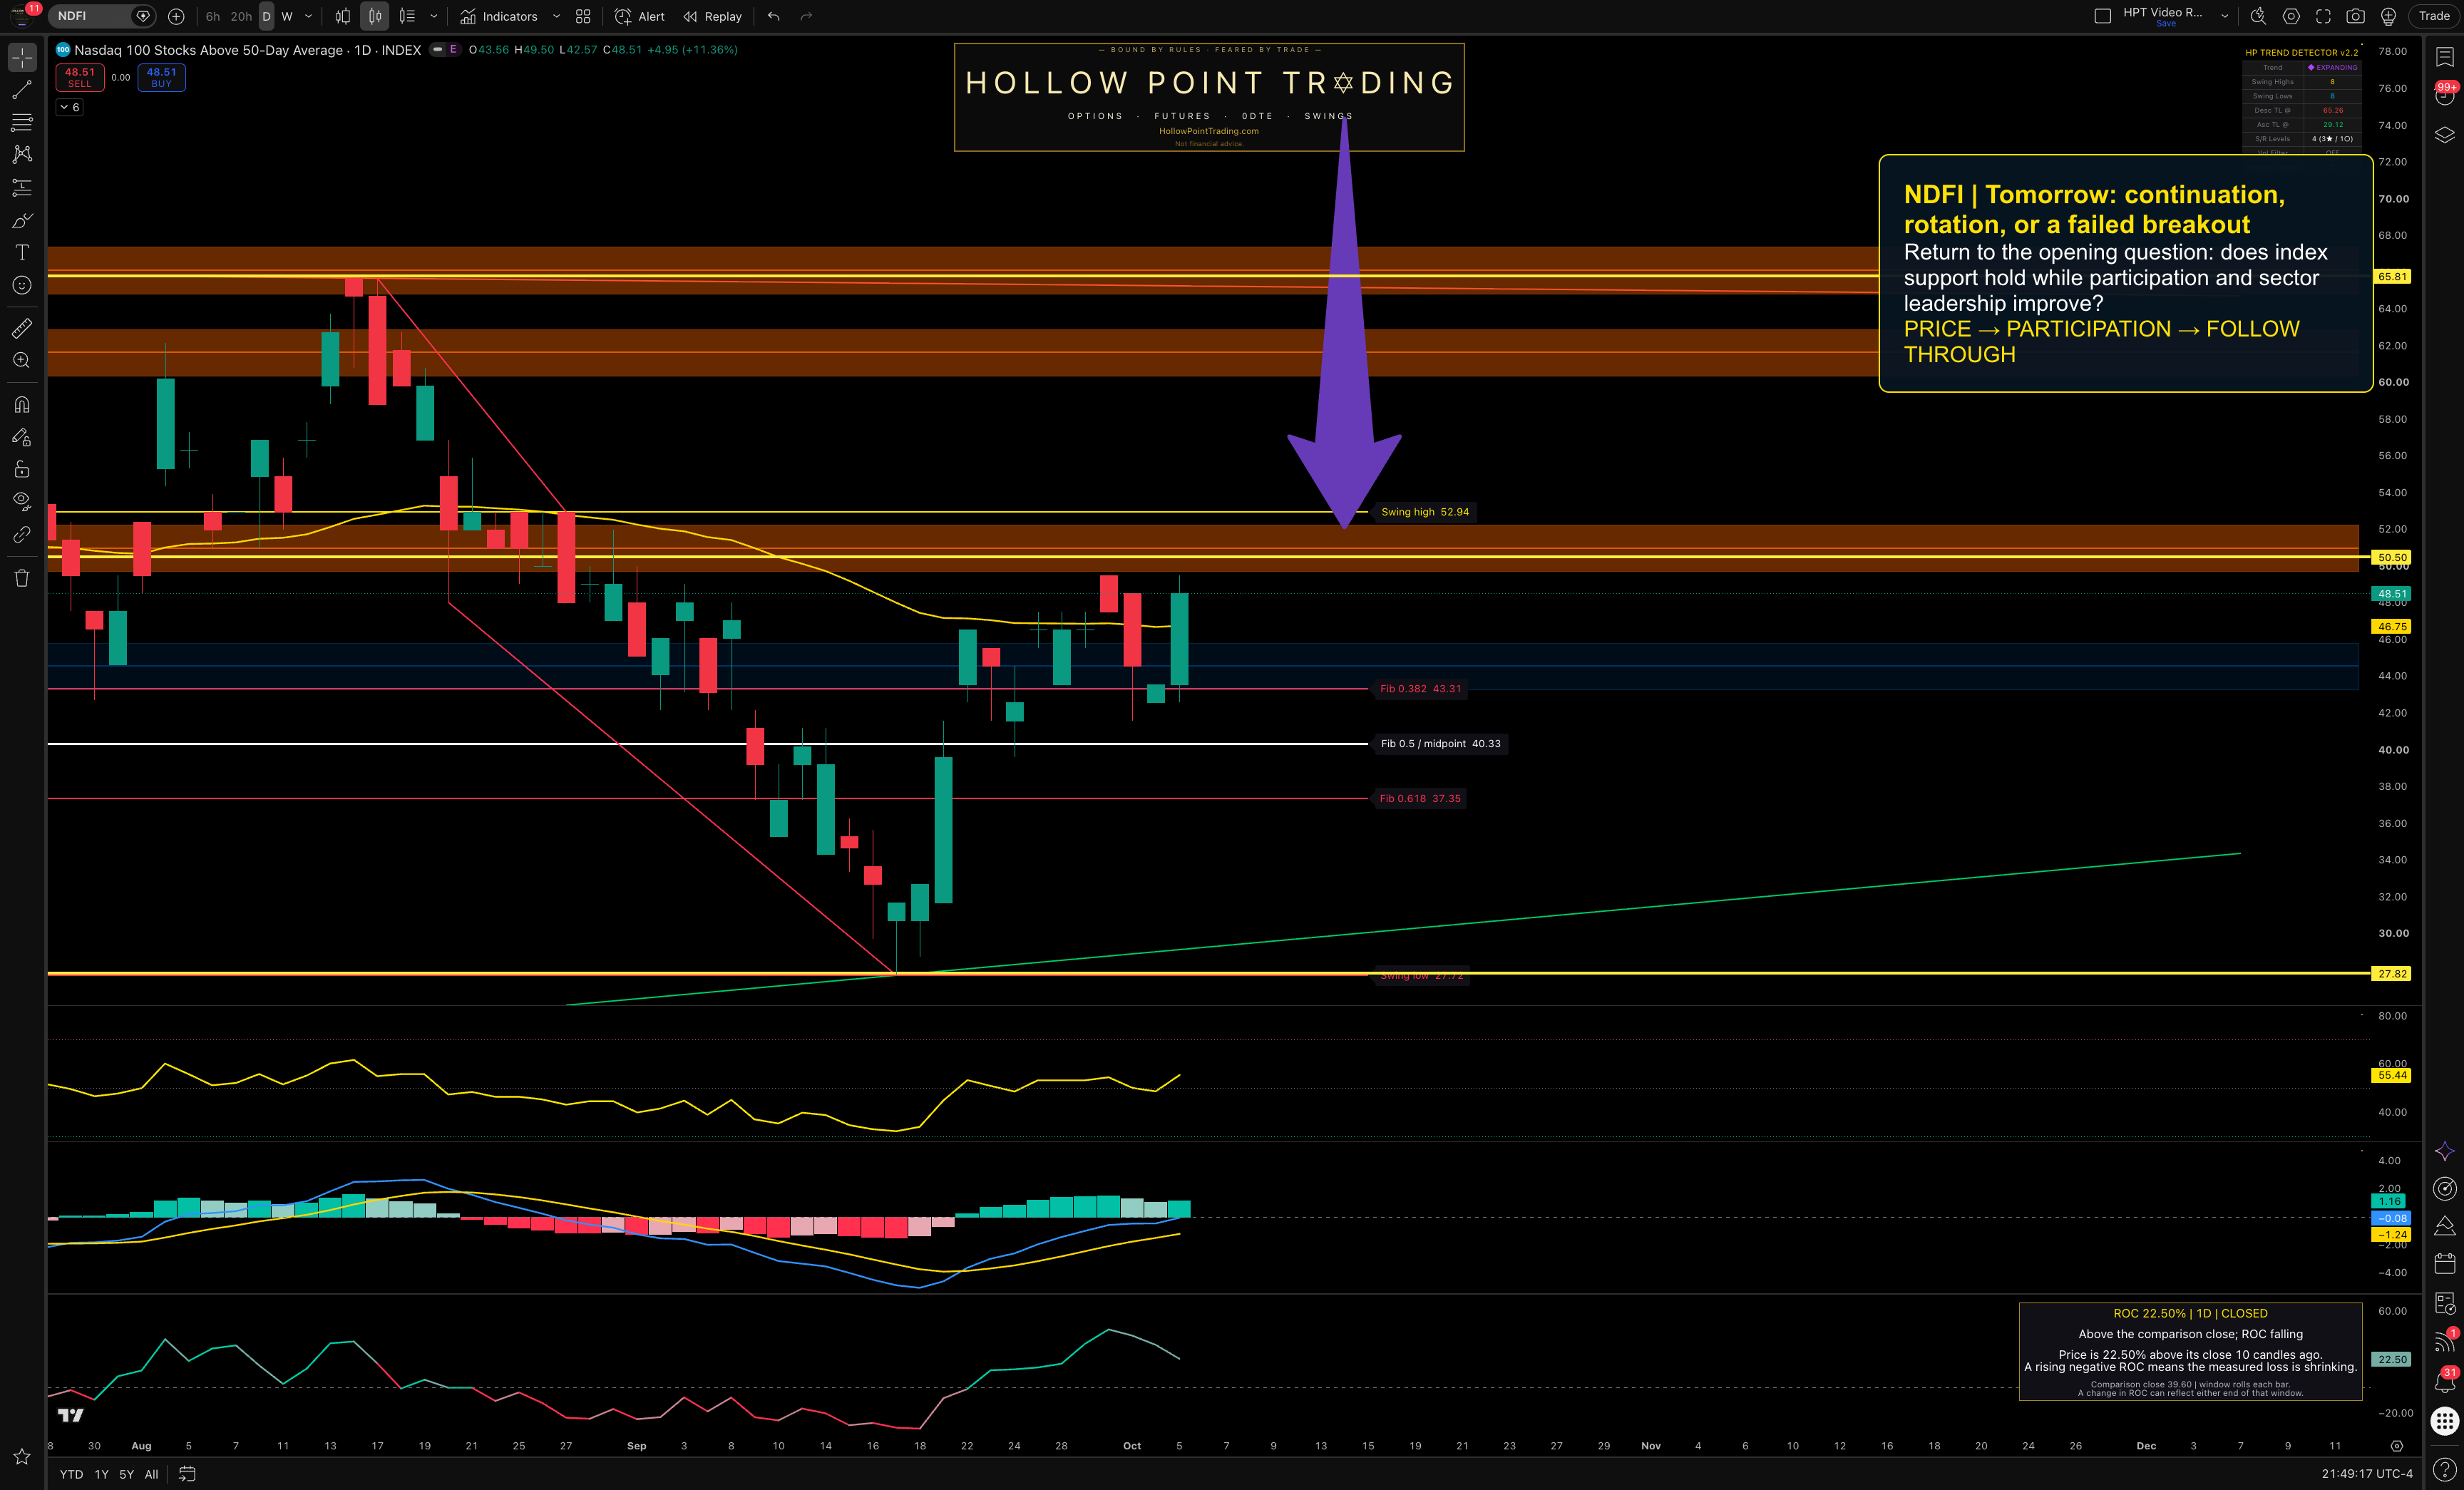
NDFI ended at 48.51%, an improvement of 4.95 percentage points. S5FI ended at 26.83%, up 2.18 percentage points. These measures count members above their 50 day averages. They are not the percentage return of the Nasdaq or S&P 500.
The Nasdaq cohort is closer to majority participation. The S&P cohort remains much less healthy on this measure. Both improved, but neither reading is above 50%. That is a split, not a reason to claim that every breadth measure is collapsing.
The stronger continuation would combine index support, a strengthening RSP/SPY comparison and improving participation. If prices rise while participation rolls over, the breakout has less support underneath it. That warning does not tell us the exact day a reversal will happen.
Money found different leaders
Materials gained 1.31%, communication services 1.17% and energy 1.00%. Real estate fell 0.34%. Financials rose 0.73%, healthcare 0.72%, staples 0.63%, technology 0.56%, discretionary and utilities each 0.35%, and industrials 0.09%.
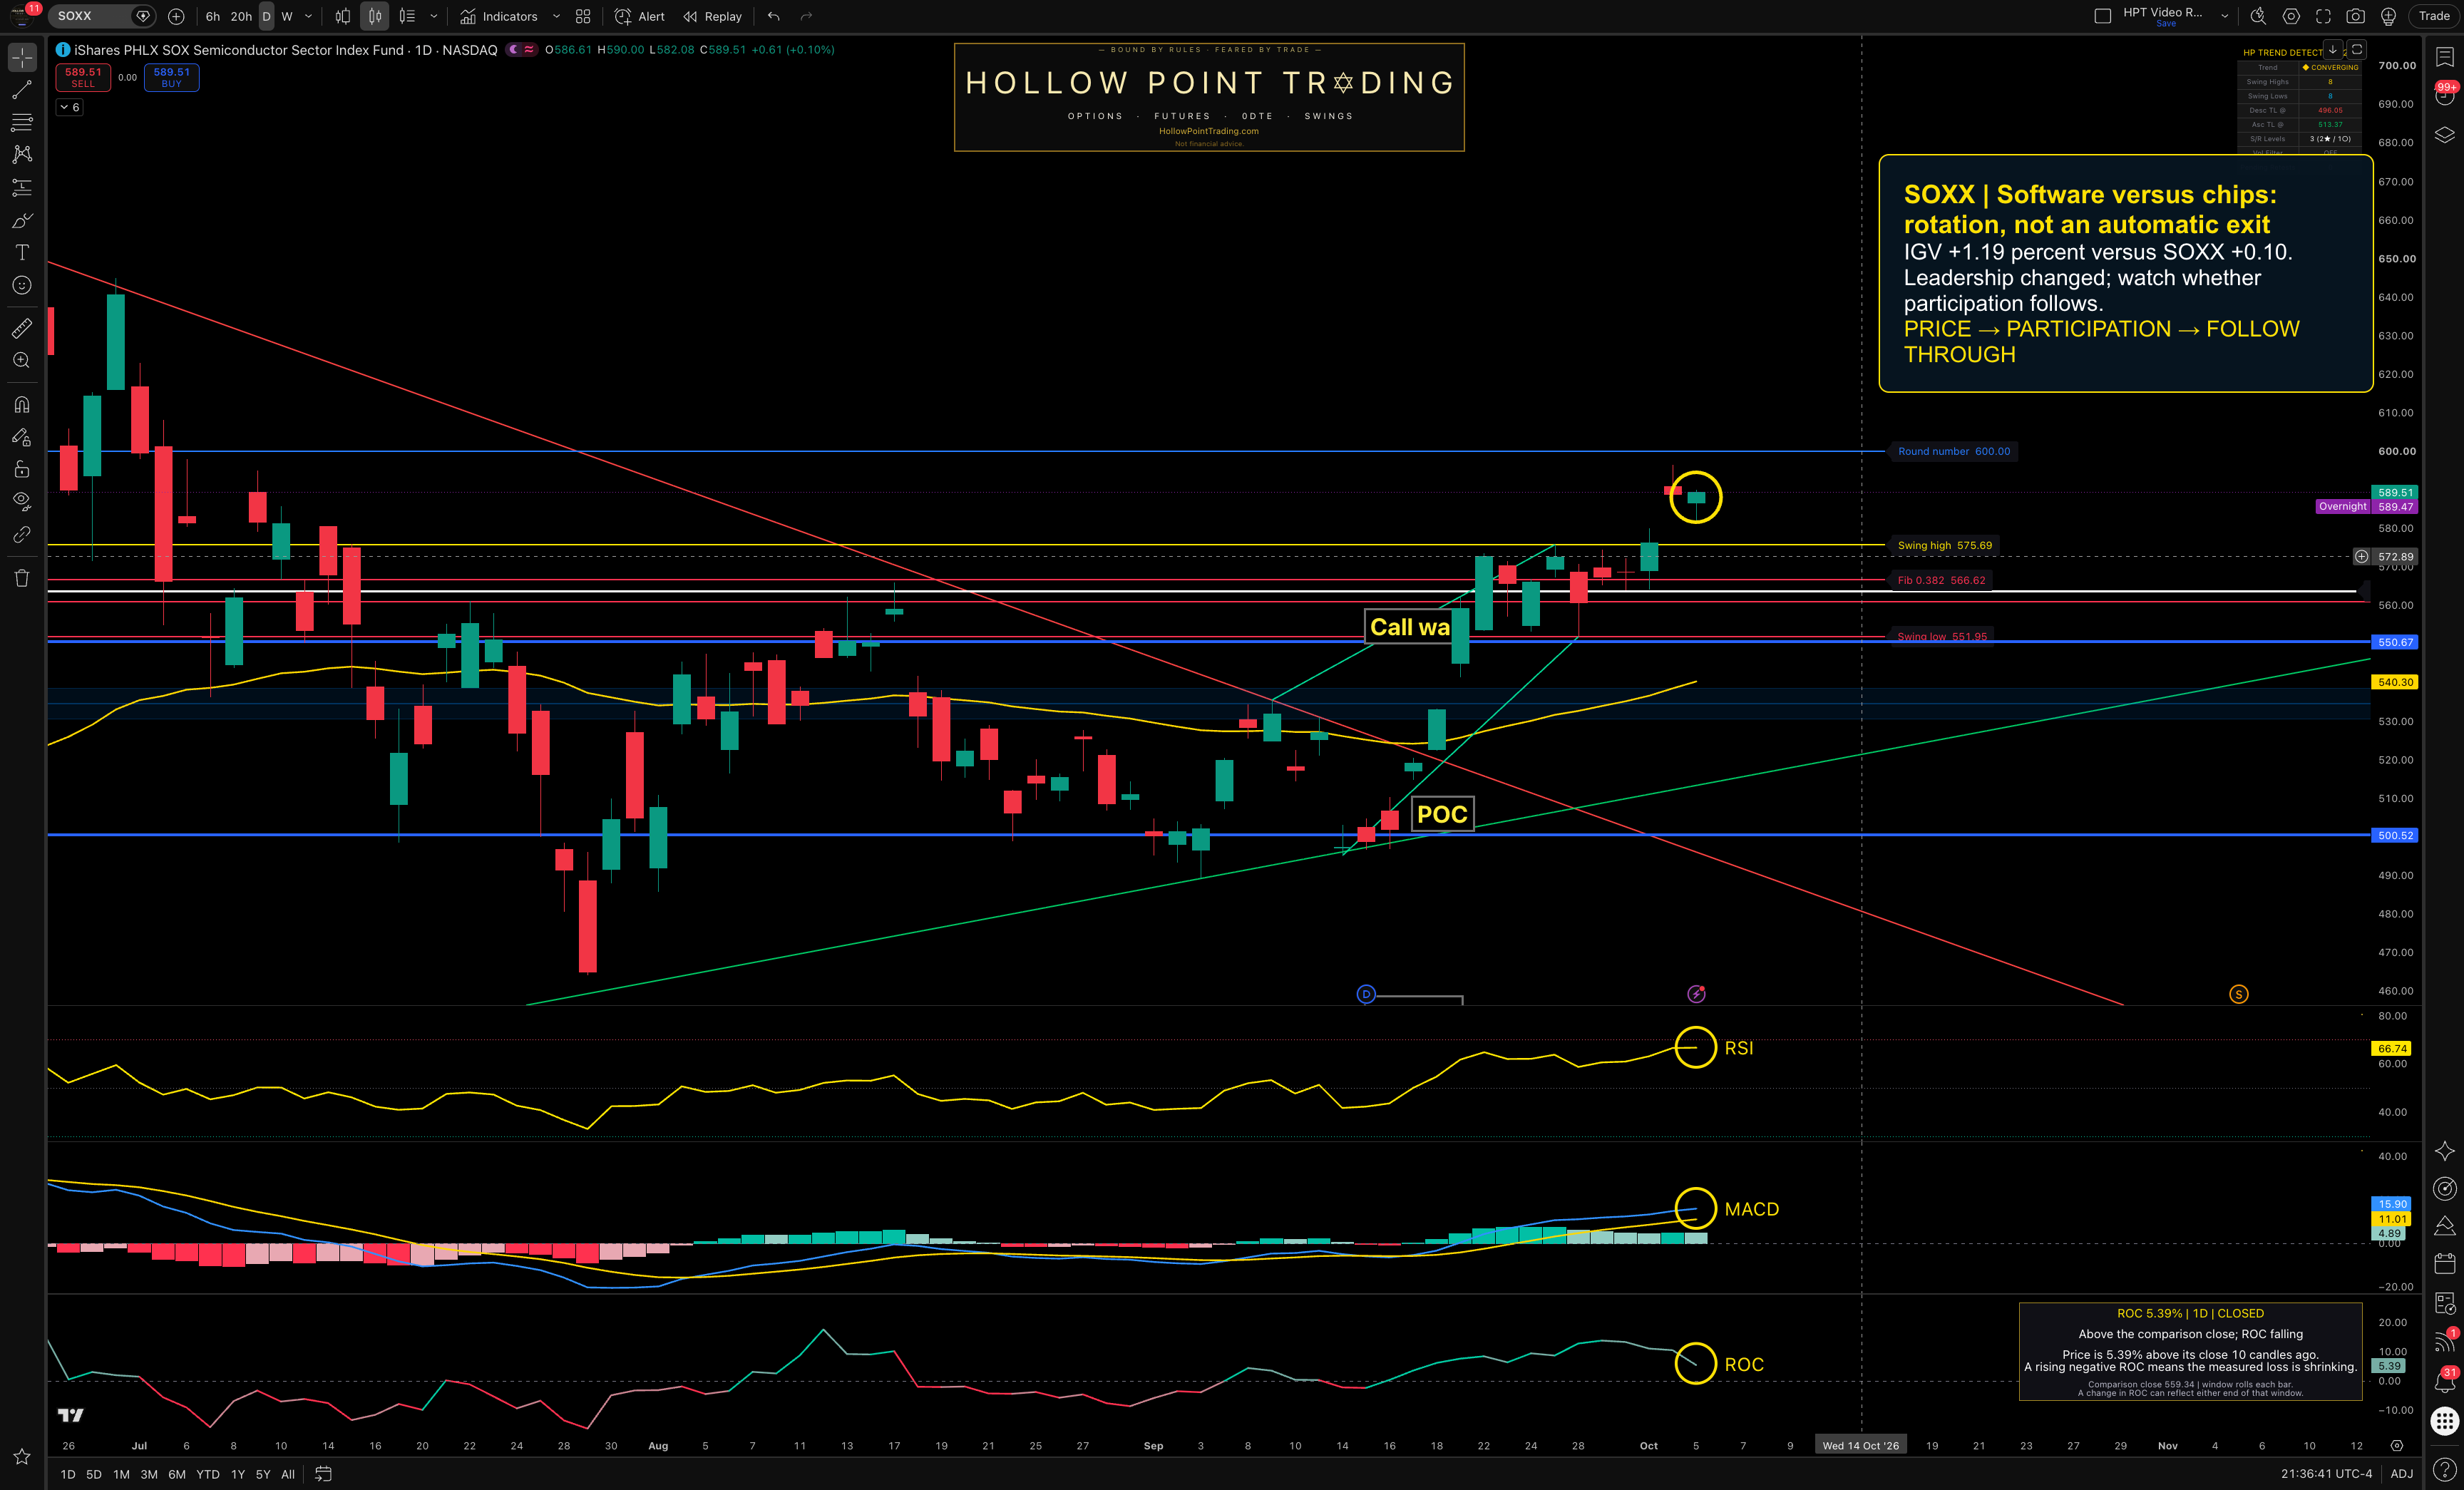
Within the growth comparison, IGV gained 1.19% while SOXX gained only 0.10%. The larger biotech fund IBB rose 1.30%; equal weight biotech XBI rose 1.14%; ARKG rose 5.13%. Looking only at chips and software would miss part of today’s leadership.
Think of rotation as a relay handoff. A different runner can keep the team moving, but the runner resting still needs to remain healthy. For the market, that means new leaders improving while the previous leaders preserve support. If the resting groups break down and the new leaders cannot carry the move, the interpretation changes.
The IGV/SOXX and SOXX/QQQ ratios help compare relative performance. A rising ratio means the numerator outperformed the denominator over the measured interval. It does not identify who bought, prove institutional rebalancing, or tell us how much leverage anyone used.
Micron separates business strength from stock response
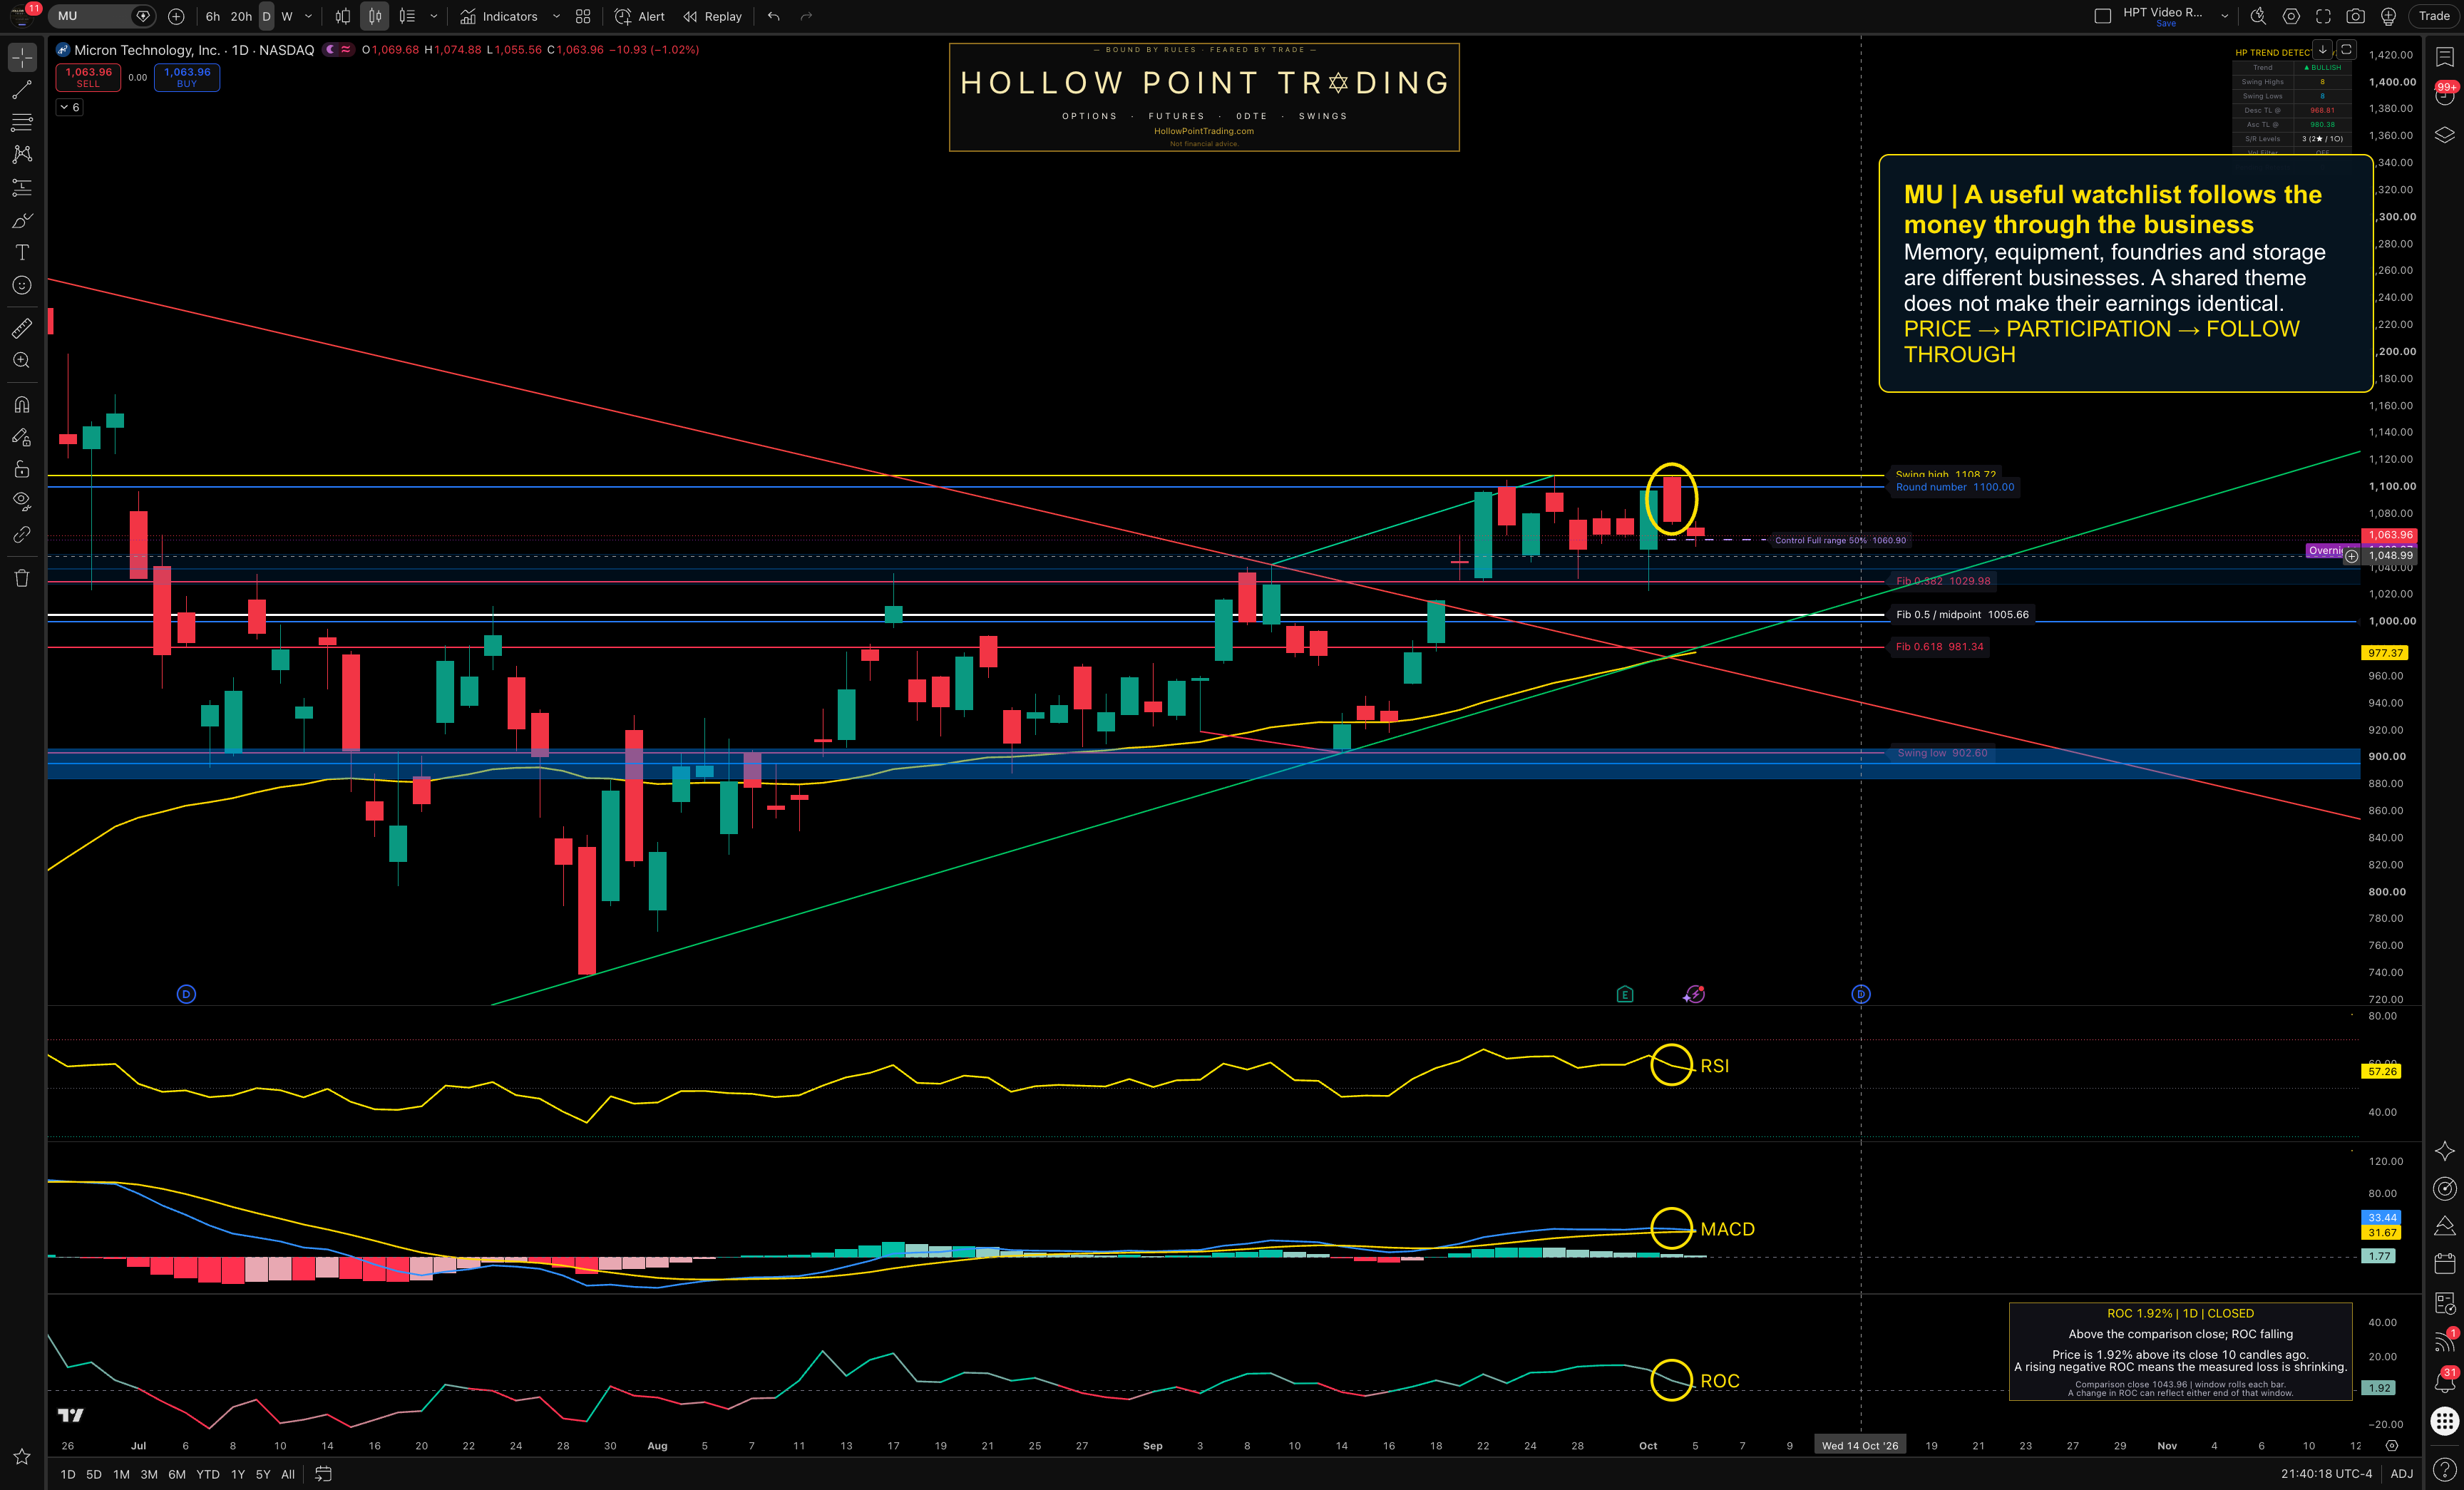
Micron closed at $1,063.89, down 1.02%. Its September 30 report delivered $54.23 billion in quarterly revenue and $33.42 in adjusted earnings per share. Management’s next quarter revenue outlook was $61.5 billion, plus or minus $1.5 billion. Micron’s results and outlook.
Strong results do not guarantee a positive stock reaction. The report competes with expectations already reflected in the price. Profit taking and position adjustments are possible explanations, not a verified diagnosis of every seller.
The matching chart tests are $1,074.88 above and $1,055.56 below. Recover the high and hold, and the stock is showing repair. Lose the low and fail to reclaim it, and the earnings headline is not protection against further weakness.
The related watchlist follows the business: MU for memory; TSM for foundry manufacturing; NVDA for accelerators and computing demand; LRCX and AMAT for manufacturing equipment; SNDK for flash storage; STX and WDC for hard disk storage; MRVL for data infrastructure semiconductors. Shared themes do not imply identical demand, margins or earnings benefits. Each name still needs its own setup.
Yields and the dollar raise the hurdle
The afternoon observations used in the recap were a 10 year Treasury yield of 5.311% and DXY at 102.151. These are timed snapshots, not settlement claims. Higher yields can raise financing costs and the discount rate applied to future profits. A stronger dollar can affect translated overseas earnings, while also reflecting broader capital flows.
Neither variable decides the next QQQ candle by itself. The practical question remains whether buyers hold support and participation improves despite the backdrop. When the background is less friendly but price holds, that resilience matters. When price fails too, the story becomes weaker.
Oil and gold are not one trade
The afternoon WTI futures reading was $89.18, down 2.12%; gold futures were $4,168.10, up 0.14%. These are not verified final settlements. Oil responds to supply, demand and risk premiums. Gold also responds to real yields, the dollar and demand for protection. They can move differently without a contradiction.
Lower oil can relieve some cost pressure, but it can also reflect weaker demand. The candle alone cannot choose the explanation. Energy stocks gaining while crude falls is another reason to separate commodity prices from the business and expectations of the companies.
The data and next catalysts
September services PMI was 54.9, down from 55.4, while its prices index increased to 74.0 from 72.6. Activity was still expanding while cost pressure remained uncomfortable. A prices index of 74 is not a 74% inflation rate. ISM services release.
Friday’s employment report showed payroll growth of 29,000 and unemployment of 4.2%. The labor report and services survey measure different things; together they describe a mixed backdrop rather than settling the next Fed decision. BLS employment report.
For October 6, watch the trade report scheduled at 8:30 a.m. Eastern, Marvell’s investor day at 9 a.m. Eastern and Lamb Weston’s earnings call at 9 a.m. Eastern. A call time is not necessarily the release time. BEA trade data, Marvell events and Lamb Weston investor relations.
TSMC’s September sales release is scheduled for October 8. Monthly sales are not earnings, and even strong sales must be compared with expectations. TSMC calendar.
Tomorrow has three useful paths
Continuation: index support holds, the high is cleared and participation improves. Constructive rotation: new groups lead while the resting leaders defend support. Failed breakout: index support breaks, breadth weakens and the resting leaders deteriorate together.
The goal is not to win an argument about bullish or bearish labels. Know the levels that change the narrative. Watch whether the first reaction holds. Bring the sector and breadth evidence back to the index, then let the next session decide how much confidence the story deserves.
Explore HPT’s free education and resources.
Regular session chart observations are dated October 5, 2026 and taken from native TradingView. Educational analysis only, not personalized investment advice. Trading involves substantial risk. Past results do not guarantee future results.