
Macro: expansion is intact, but its inflation mix is less comfortable
The U.S. regular equity session is open for this noon CT edition. The Institute for Supply Management’s September services report, released at 10:00 a.m. ET on October 5, is the fresh catalyst. Its headline Services PMI registered 54.9, down from 55.4 in August but still above the 50 threshold that signals expansion in the surveyed sector. Calling that a collapse would overstate the data. Calling it an all-clear for inflation would ignore the price component.
Business Activity fell 5.2 points to 56.5 and New Orders eased 1.1 points to 59.8. Both remain in expansion. Employment moved from 47.8 to 50.1, barely crossing back above 50 after two months of contraction. Prices Paid rose from 72.6 to 74.0, ISM’s highest reading since July 2022. These are survey diffusion indexes, not annualized growth, payroll counts or a consumer inflation print. A 74 Prices reading says a large share of respondents reported higher input prices; it does not say service prices rose 74 percent.
This combination matters for the whole market because investors must weigh growth against the cost of capital. Strong orders can support future revenue while sticky input costs can constrain margins and keep rate expectations elevated. The two-year Treasury yield is a useful chart for that policy-sensitive side of the story, but it cannot prove the release alone caused an intraday move. Other headlines and positioning can move yields at the same time.
Fundamental: separate demand, hiring and margin pressure
The service sector spans many businesses, so a single composite number is a poor proxy for every company. ISM said 13 industries reported growth and four contraction. The September New Export Orders index dropped to 46.9 from 56.3, its first contraction reading in eight months; Backlog of Orders rose to 56.6 from 55.6. Supplier Deliveries increased to 53.2 from 51.3. In this survey that means deliveries slowed, a possible pressure point, not an automatic sign of stronger output.
The margin question is more specific than “services are healthy.” A company with firm new orders but little pricing power may absorb rising labor, fuel or input costs; another may pass them on, but that can test customer demand later. ISM’s respondent commentary cited fuel costs and tariffs as prominent supply-chain concerns. These are survey observations, not audited earnings for any listed company. The release does not reveal which firms will gain revenue or lose margin, and no position in an individual stock follows mechanically from the PMI.
For the next checkpoint, compare the October employment and price components with the September mix. A constructive disinflation path would keep orders above 50 while price pressure cools and hiring broadens. A less friendly path would combine still-high Prices Paid with softer activity and hiring. That would complicate both profit estimates and the rate backdrop. Those are conditional scenarios, not reported October outcomes.
Technical: the two-year yield is above its trend average, but below the recent peak
A dedicated TradingView daily chart of the U.S. two-year Treasury yield was captured at about 12:02 p.m. CT. Its October 5 candle was unfinished. The displayed feed showed an open near 4.812%, high near 4.854%, low near 4.785% and indicated yield around 4.850% at capture. These are a static TradingView snapshot, not an official Treasury close, a bond trade or a guaranteed live quote. The established 55-day EMA was about 4.498%; RSI, the only lower panel, was near 63.94. The yield remained above its rising average even after pulling back from the marked 4.960% swing high.
The chart’s 4.836% middle control line is the nearest acceptance test. A completed daily close above it and then a retest that holds would keep the 4.960% high in view. Repeated closes through 4.960% would extend the rate-pressure scenario, a potential headwind to long-duration equity valuations if other conditions stay equal. A completed close below 4.710%, followed by a failed reclaim, would weaken that near-term high-yield case and bring 4.633% into focus. A drop toward the 4.498% average would be a separate, larger trend test. Intraday touches do not satisfy completed-close conditions.
The chart is a map of where the rate market may confirm or reject the survey narrative, not a causal verdict on this morning’s release. Yields can gap on subsequent labor, inflation, fiscal or Federal Reserve news; sizing and exits must account for that risk. This educational analysis is not a claim of an HPT trade, a recommendation or a promised outcome
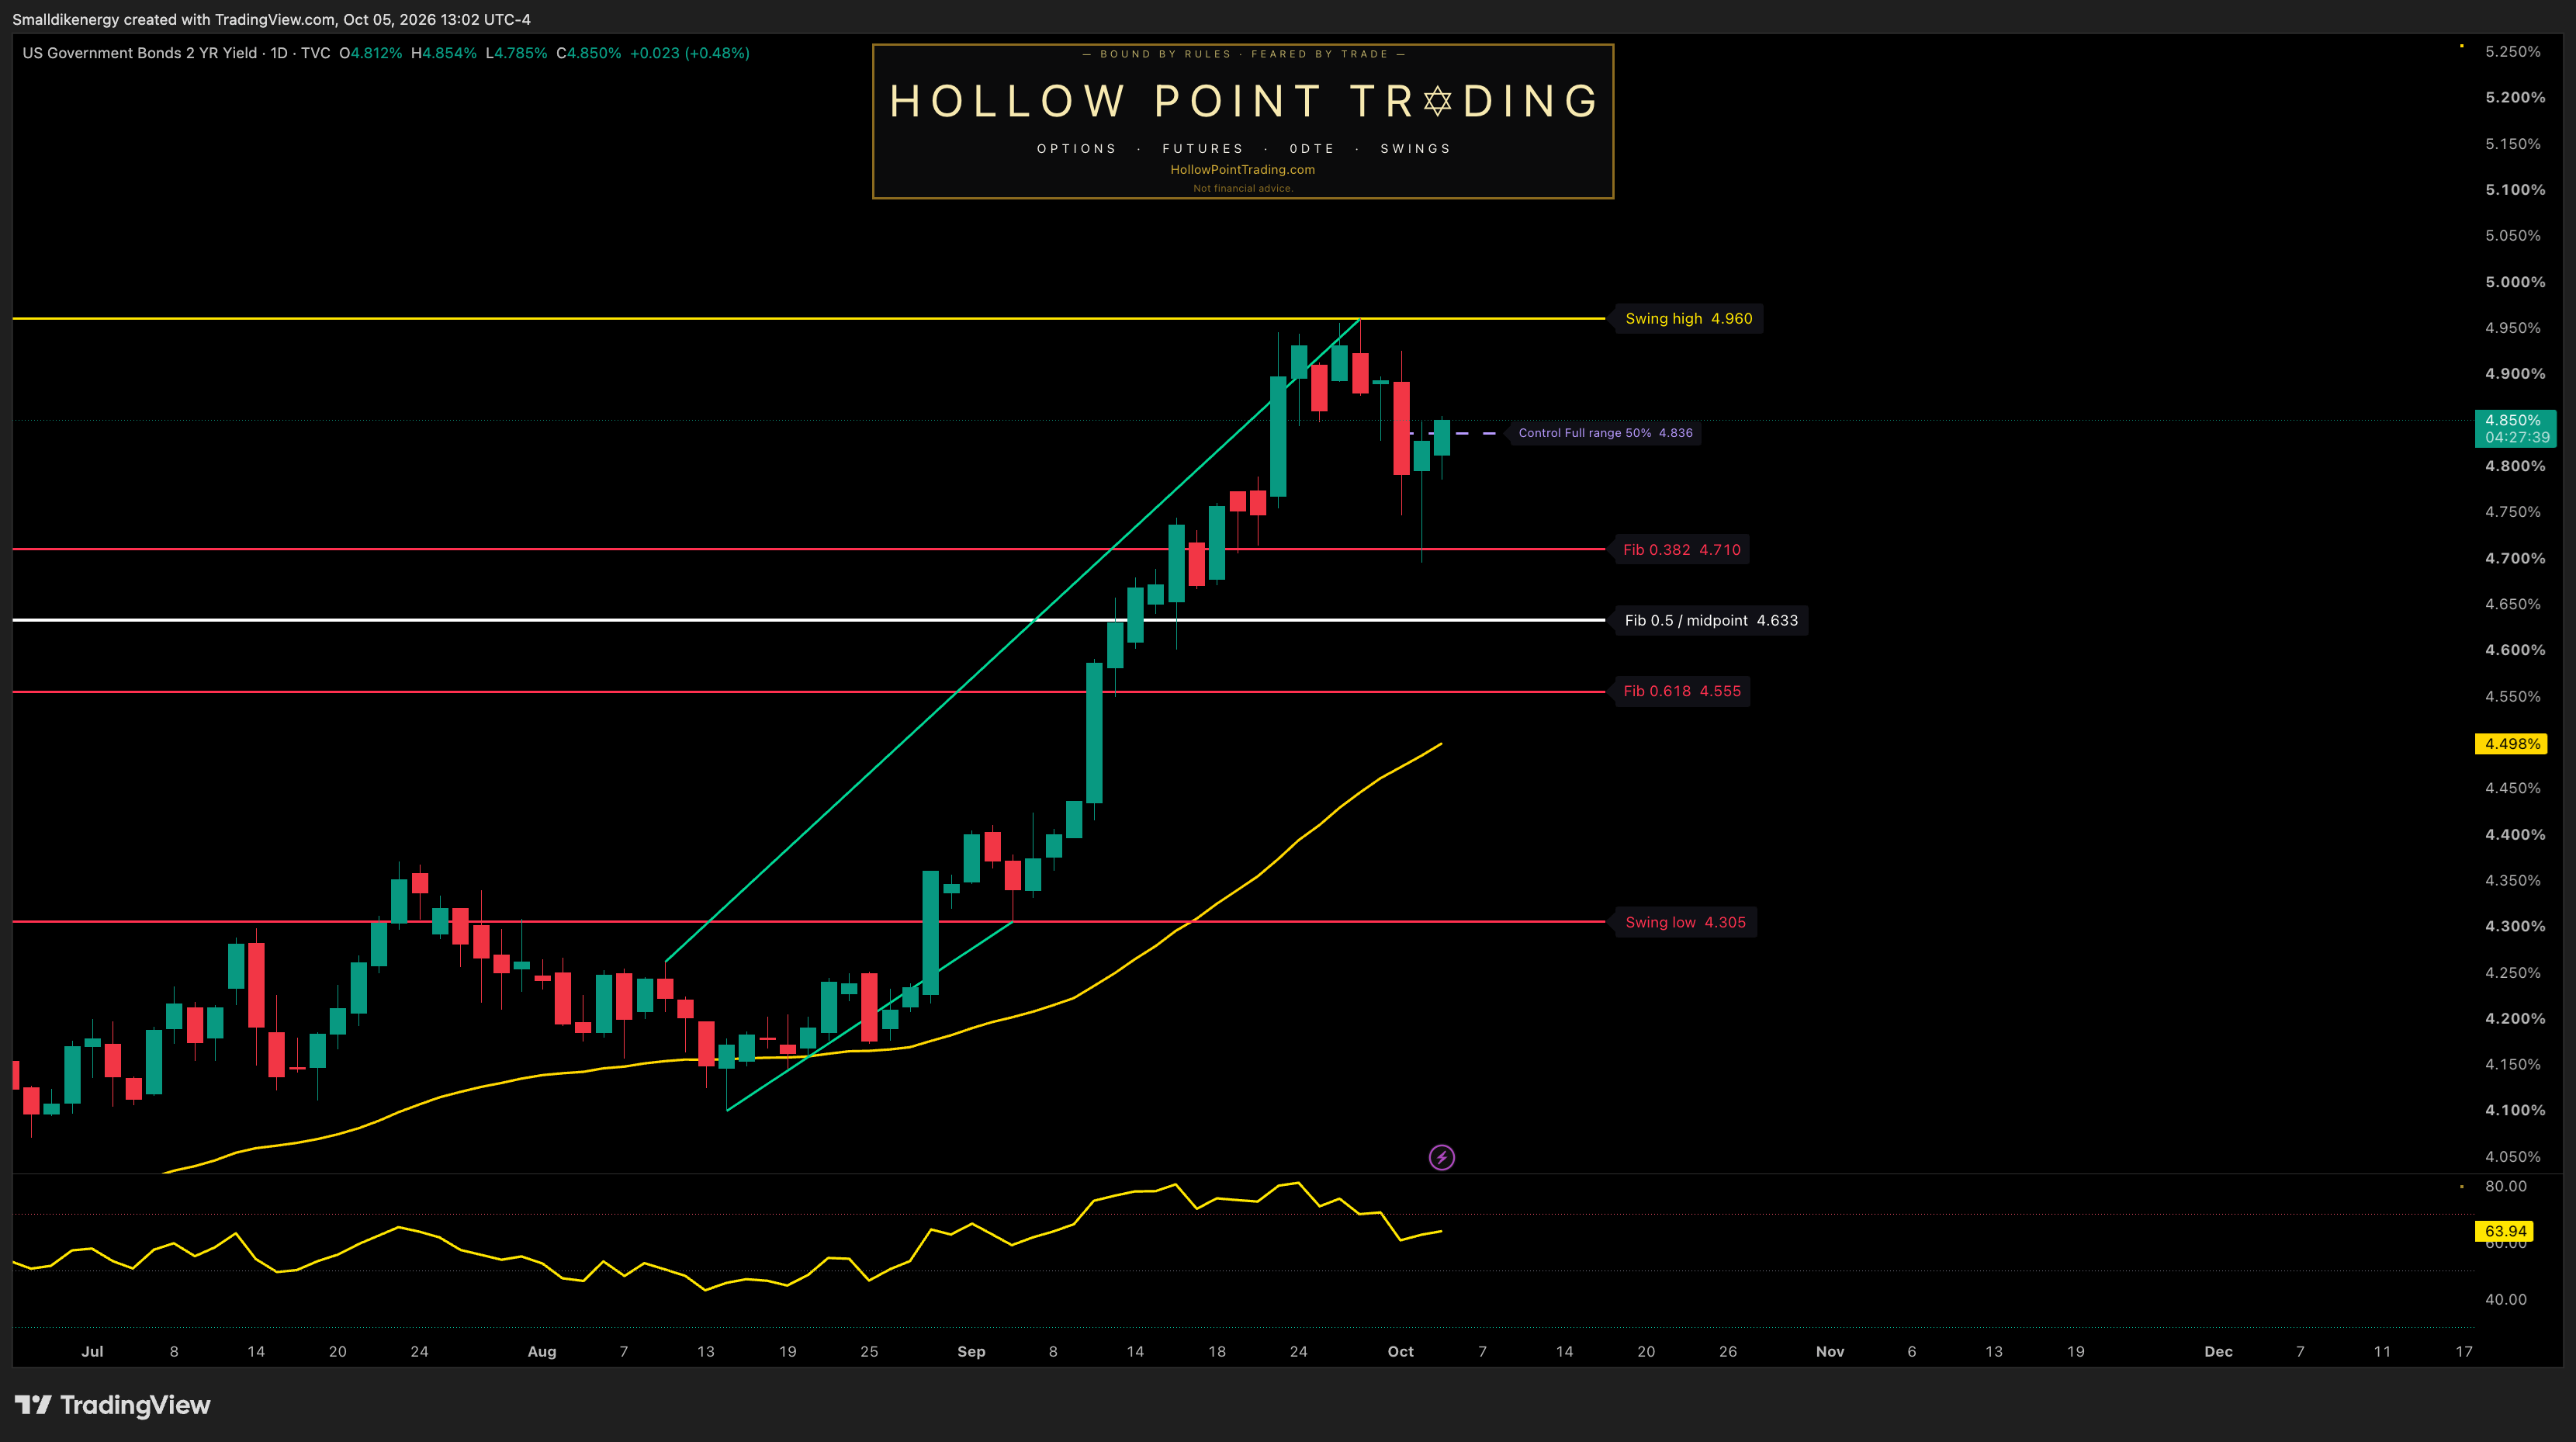
Source: TradingView TVC:US02Y, dedicated HPT publisher-owned chart, 1-day timeframe, captured October 5, 2026 about 12:02 p.m. CT. The October 5 candle is unfinished. 4.850% indicated yield, 4.498% 55 EMA and 63.94 RSI are static feed-specific visual readings; drawn levels are scenario markers, not official closes, guaranteed execution levels or proof the ISM release caused the move.
Sources: ISM September 2026 Services PMI report · ISM report release calendar. All reported survey figures refer to September and were released October 5. Bonds, futures, options and equities carry substantial risk; this is educational research, not personalized financial advice.
If October’s services report keeps new orders strong but Prices Paid above 70, what combination of employment and completed two-year-yield closes would change your market posture?