The bounce is real. The repair is not finished.
Software jumped while semiconductors slipped. That is the most important contrast in Friday’s rebound. A green index tells us buyers showed up. It does not tell us whether the entire market is healthy, whether leadership is spreading, or whether the next earnings report will expose another weak link.
This is the written companion to the October 9 market close and October 10 Saturday deep dive. The central question is simple: can new leaders carry the market while chips repair, or does weakness spread into the groups doing the lifting?
Watch the complete 43 minute HPT Saturday deep dive with annotated charts and the callout examples.
Price references below are the dated TradingView observations used in the video, not live quotes or independently reconciled exchange settlement files. They are chart levels, not verified options walls.
QQQ: the first test comes before the big prediction
QQQ’s Friday observation was $751.27. The first upside test is Friday’s high at $752.87. Clear it and hold, and buyers have improved the immediate structure. The larger test is the weekly high at $762.86. A bounce that stalls beneath that upper edge is not the same as a repaired weekly range.
Below price, $748.37 is the first support reference and $743.23 is the weekly low. Losing the first level and failing to recover weakens the rebound. Losing the weekly low and remaining below it would extend the damage. The daily 55 EMA near $725.74 is a much more distant trend reference, not an excuse to let a short term trade fail all the way down to it.
A breakout needs more than a quick trip above a line. An upper wick followed by a close back underneath shows the initial push was not maintained. A close above resistance followed by a pullback that holds is different evidence. Same line, different behavior. I want the reaction after the excitement.
SPY and RSP: is the whole team helping?
SPY’s observation was $778.57, closer to the top of its weekly range than QQQ. The upside sequence is $779.42, then $781.62. The downside references are $775.14 and the weekly low at $769.63. That relative position matters: the large company basket and the technology heavy basket are not in identical condition.
RSP, the equal weight S&P 500 fund, was $213.04. Its Friday high at $213.29 and daily 55 EMA near $213.70 form the immediate reclaim sequence. Below that, $212.21 is the first range support and $208.92 the weekly base. A green day below the nearby average can be a useful first step without being a completed repair.
Think of SPY as a team whose largest stars have more influence on the scoreboard. RSP gives each constituent a more equal role. If SPY advances while RSP cannot sustain progress, the headline may depend heavily on a smaller group. If both improve and more stocks regain their own trends, the move has more support.
RSP/SPY measures relative performance. A rising ratio can mean RSP rises faster, or falls less. It does not mean both are making money. Keep absolute prices beside the ratio so relative improvement is not confused with an outright advance.
NDFI and S5FI: connect participation to price
NDFI tracks the percentage of Nasdaq 100 members above their 50 day moving average. S5FI asks the corresponding question for S&P 500 members. These are participation measures, not the index’s percentage return and not the RSP/SPY ratio.
The constructive combination is price clearing resistance while participation expands. The fragile version is price moving higher while fewer members support the trend. Neither tells us the exact date of a reversal. Breadth is a quality check, not permission to short every green candle.
That brings us back to the opening: if QQQ rises while chips struggle, another group is doing the lifting. The next question is whether that replacement leadership can stick.
Software versus chips: the handoff to watch
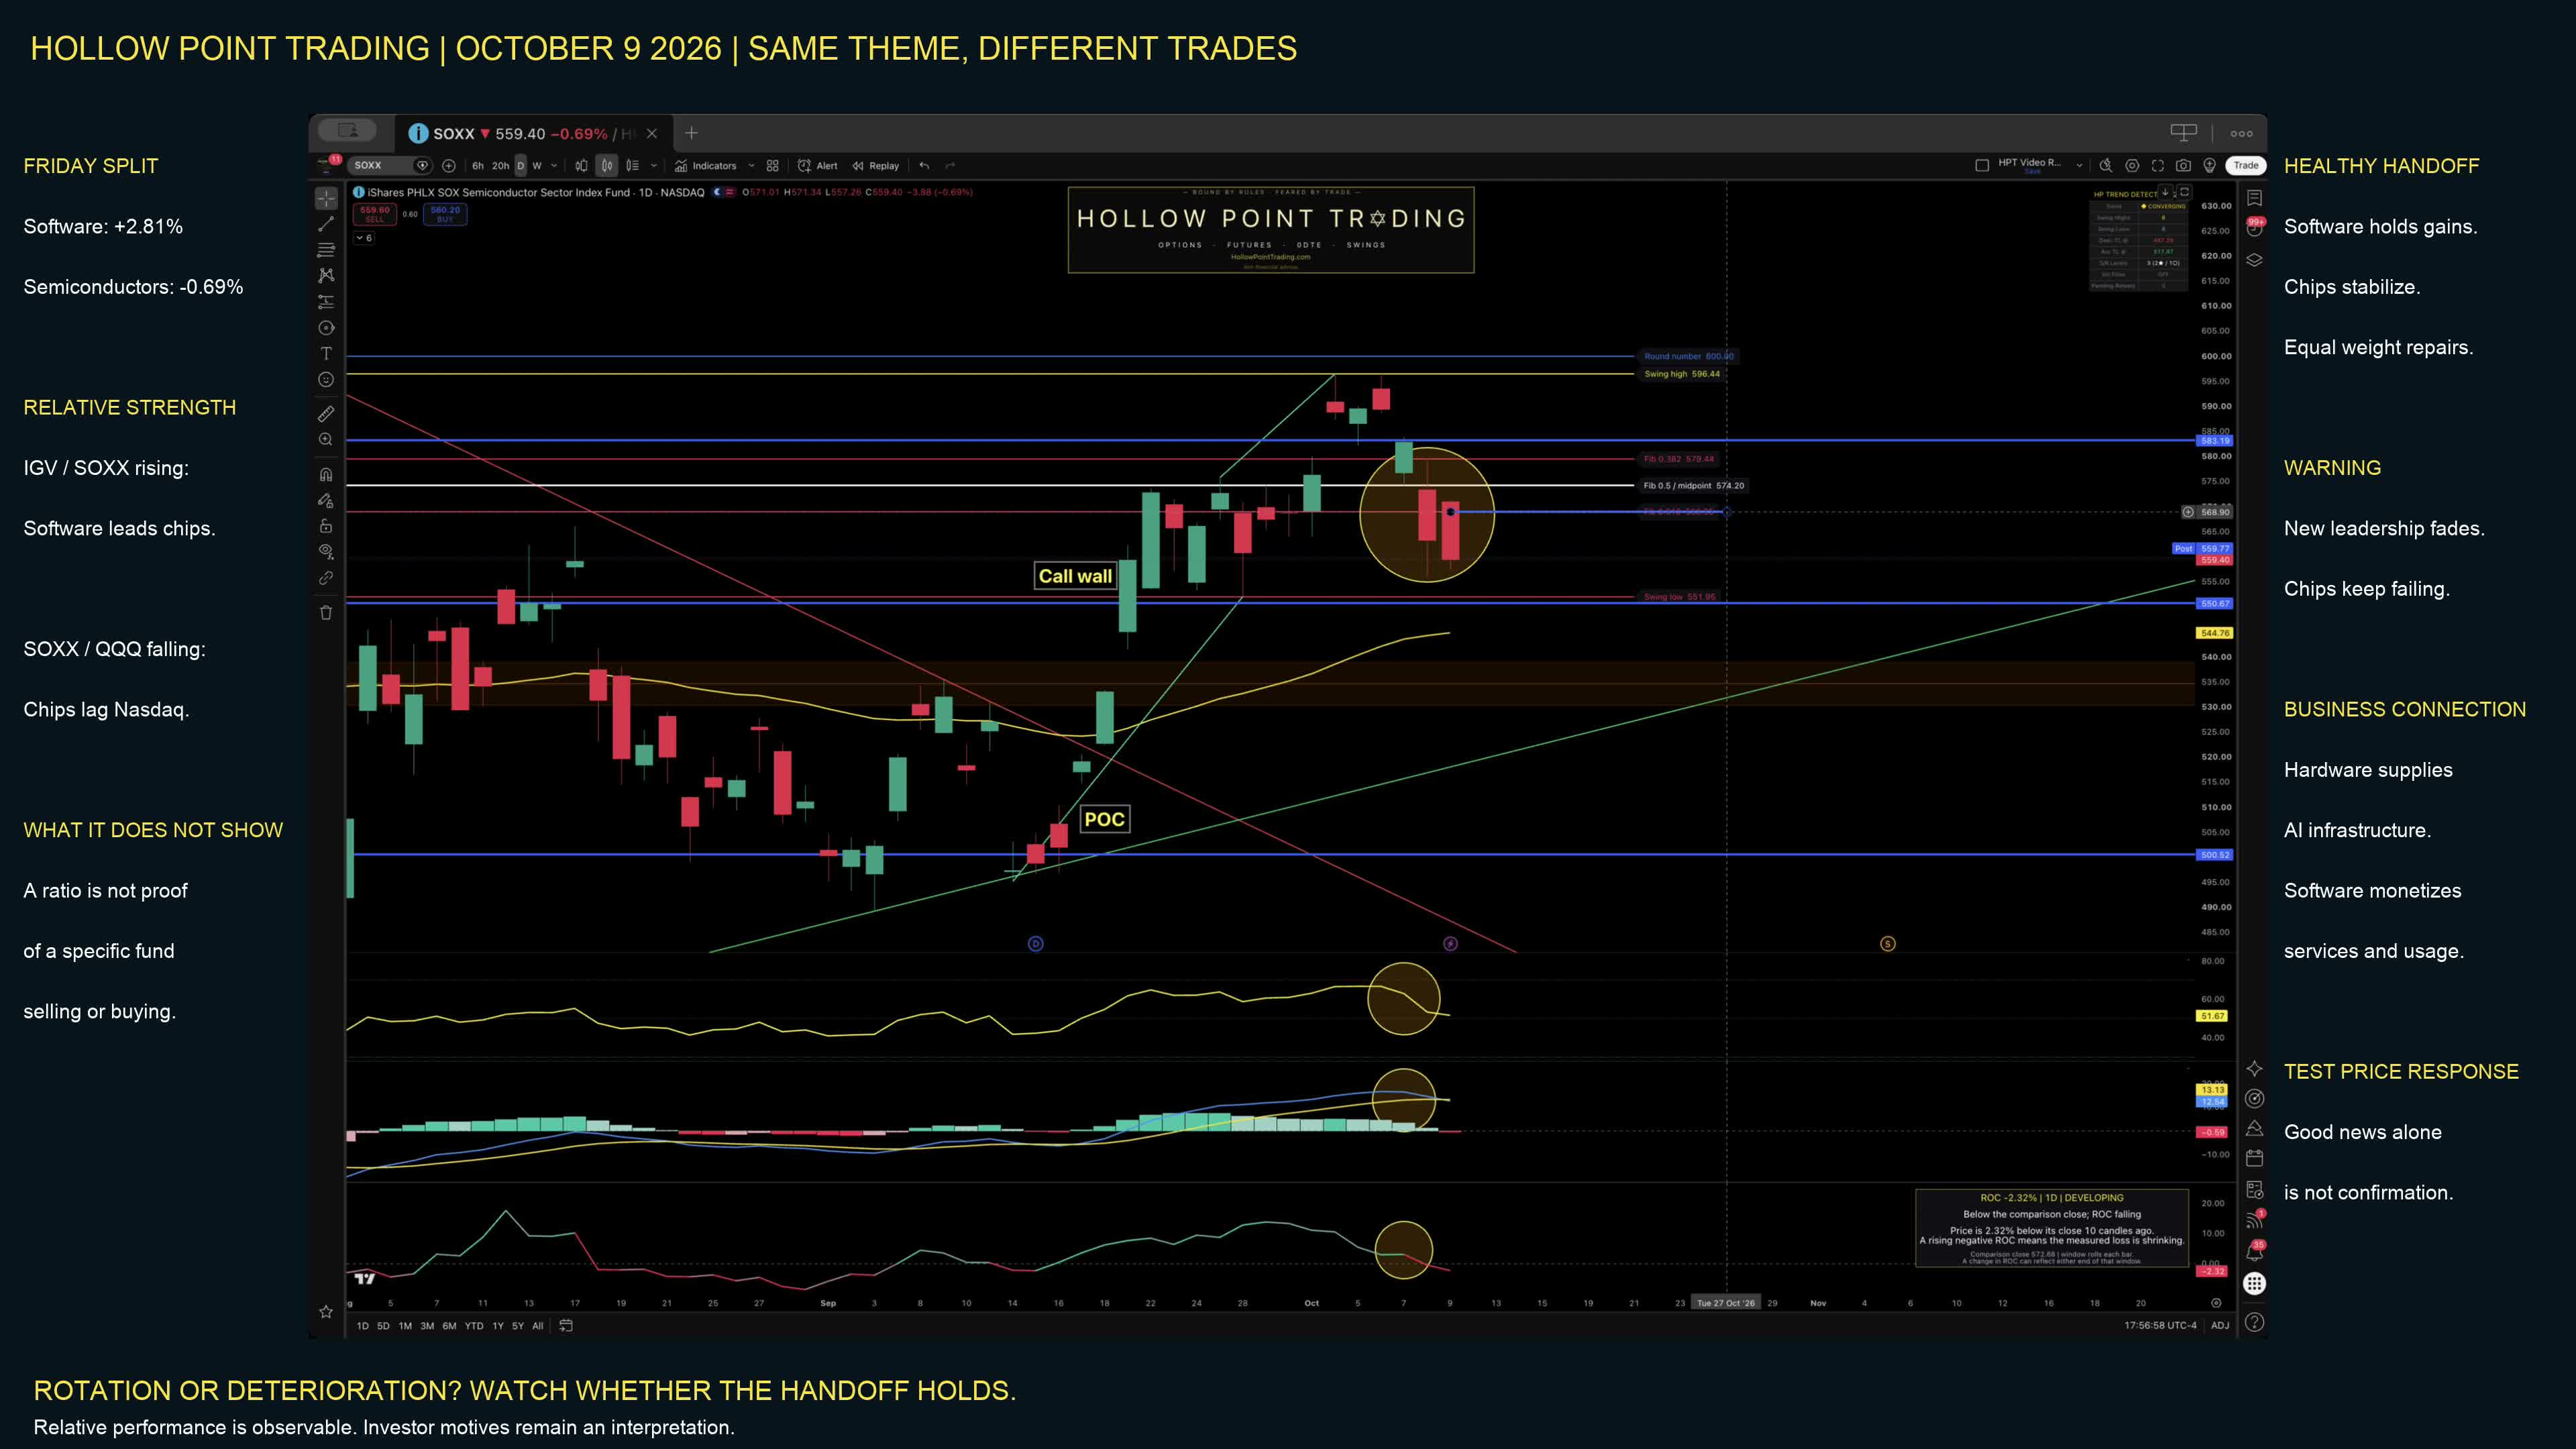
Friday’s selected observations showed IGV up 2.81% while SOXX fell 0.69%. IGV was near the top of its weekly range; SOXX was much closer to the bottom. Calling both simply “technology” hides the distinction that matters.
For SOXX, $557.26 and $555.81 are the immediate daily and weekly support references. Friday’s high at $571.34 is the first repair test. A brief opening pop that sellers immediately fade is weaker evidence than a reclaim that holds.
IGV/SOXX shows whether software is outperforming semiconductors. SOXX/QQQ shows whether chips are helping or lagging the technology heavy index. Neither ratio proves a particular fund sold one position to purchase the other. They show relative behavior, not somebody’s private portfolio.
Three paths matter. In the healthier handoff, software holds its progress, chips stop deteriorating, and equal weight repairs. In the weaker version, software gives the move back while chips keep failing. In ordinary rotation, chips recover while software pauses without breaking its base. The individual charts tell us which version is developing.
AI headlines: demand, funding, supplier revenue, valuation
The useful AI question is not whether every dramatic headline is true or false. It is whether the numbers being compared use the same definition. Annualized revenue extends a recent pace across a year; it is not a full year of cash already collected. Gross customer spending and a company’s receipts after a partner’s share can also differ.
That distinction matters because expectations connect through a chain: customer demand, financing, equipment orders, supplier revenue and the valuation investors are willing to pay. A stock selloff is not itself a canceled purchase order. We need company disclosures to establish whether the operating outlook actually changed.
Hardware suppliers and software businesses share exposure to the buildout but have different economics. Owning the kitchen equipment is not the same as selling profitable meals. The market can reward monetization in one part of the chain while questioning spending or expectations in another.
Micron: read the release and the reaction together
Micron’s September 30 fiscal fourth quarter release reported revenue of $54.23 billion and adjusted earnings of $33.42 per share. Its next quarter revenue guidance was $61.5 billion, plus or minus $1.5 billion. Actual results and the following quarter’s guidance are different periods.
The Friday stock observation was $1,029, down about 0.66%. Its daily range was $1,017 to $1,054.17, with the daily 55 EMA near $987.09. The immediate question is whether support holds and a reclaim survives, ideally with the semiconductor group improving too.
A business can deliver strong results while its stock corrects because investors already paid for an even stronger outcome. Watch demand, pricing, product mix, capacity investment and cash generation. High bandwidth memory and other memory products do not have identical demand drivers.
The sector board: more than one source of support
The selected ETF board ranked XLRE +1.86%, XLV +1.58%, XLY +1.02%, XLF +0.92%, XLU +0.83%, XLK +0.51%, XLI +0.50%, XLB +0.32%, XLP +0.01%, XLE minus 0.23% and XLC minus 1.51%. These are dated ETF observations, not official sector index returns.
That is broader support than a single chip rally. But a strong day does not erase a damaged trend. Real estate, small caps and the Dow still needed repair against nearby moving average references in this dataset.
IWM’s observation was $278.93. Watch $279.88, then $284.64, with the daily 55 EMA near $287.66 above price. Friday’s lower range reference was $277.46. Smaller businesses can be more sensitive to financing costs, but that is a reason to investigate, not a verdict on every small company.
Sector labels also hide company catalysts. Communication services includes telecom businesses as well as internet platforms. Healthcare can respond to reimbursement and regulatory developments. Compare the actual holdings and company news before assigning every sector move to a single macro explanation.
A watchlist organized by the business chain
Memory and semiconductors: MU and SNDK test memory demand and pricing; NVDA and AMD test accelerator demand; MRVL adds custom silicon and infrastructure exposure. LRCX and AMAT provide a window into manufacturing investment. A good industry story still needs a held price test.
Software and monetization: PLTR belongs beside the software leadership discussion. Look for evidence that customer adoption translates into durable revenue and cash generation, then compare the stock’s reaction with IGV. A strong name in a failing group is a different setup from a group confirming together.
The wider buildout: Server, networking, power and industrial suppliers can benefit through different channels. Do not treat a shared AI label as identical margins, balance sheets or customer concentration. The full video follows the broader stock list and its individual chart tests.
For every candidate: why this business, what level must hold or reclaim, and what would make us back off? A watchlist is a set of tests, not twenty automatic buy instructions.
Bonds, the dollar and commodities connect the pieces
The video’s postclose Treasury observations were approximately 4.79% for the two year, 5.24% for the ten year and 5.60% for the thirty year. These are yields, not bond prices. Existing bond prices and yields generally move in opposite directions.
A company’s borrowing cost includes a starting interest rate and an additional premium for credit risk. Higher Treasury yields and widening credit spreads are not the same event. One troubled borrower also does not establish a systemwide funding crisis.
FRED gives useful separate lenses: 10 year real yields, inflation breakevens, the 10 year minus 2 year curve and financial stress. Read their observation dates and units rather than combining unrelated lines into an unlabeled signal.
Crude affects producer revenue, transport costs, household budgets and inflation. WTI and Brent are different benchmarks. Gold can respond to real rates, currencies and demand for protection; it does not require the dollar to fall every time it rises. Silver adds industrial exposure, copper links manufacturing and electrification, and natural gas depends heavily on weather, storage, production and export demand.
That creates a connected chain: energy and materials costs influence margins and inflation; inflation influences rates; rates influence financing and valuations. These are possible channels, not proof that one headline caused every move. Bitcoin trades through the weekend, so Friday’s observation is not a final weekend outcome.
Next week: dates on the uncertainty
The official BLS calendar lists CPI on Wednesday October 14, PPI on Thursday October 15, and import and export prices on Friday October 16, at 7:30 a.m. Central. The Census retail sales schedule adds consumer spending to Thursday’s checklist.
JPMorgan and TSMC are important earnings checkpoints in the video’s calendar. For banks, watch lending, funding and borrower health. For semiconductors, watch demand, margins, capacity plans and the next outlook. A strong report followed by a failed rally deserves a different interpretation from difficult news followed by held support.
Before a release, write down the expectation and the price levels. Afterward, separate the initial reaction from the reaction that holds. Softer inflation with resilient spending is a different backdrop from sticky inflation and weaker demand.
The plan: make both sides earn confidence
The constructive path combines held index support, recovered resistance, improving participation and leadership that survives beyond one session. The weaker path combines failed reclaims, deteriorating breadth and pressure spreading from chips into the groups carrying the rebound.
RSI, MACD and rate of change help organize momentum, but three calculations from price are not three fully independent witnesses. A divergence is a warning to investigate, not a guaranteed reversal. Match the indicator swings and the timeframe before calling the pattern.
That is the discipline behind this deep dive: price gives the test, participation grades the support, business evidence explains the exposure, and catalysts tell us when assumptions face a new challenge. Now connect that process to the preparation and member examples below.
Chart desk: the rotation test
The dated SOXX chart below connects the semiconductor pullback with the relative-strength and participation questions discussed above. Read the marked levels alongside the written plan, rather than treating any line as a guaranteed response
Show the work before the result
A winning screenshot can catch your attention. But it cannot show you how someone got there. What matters to me is the information that existed before the move: the setup, the reasoning, the instructions, and how we respond when the market changes.
That is the standard I want Hollow Point Trading judged on. Not whether every idea works. Whether you can see the preparation, understand the decision, and learn something you can use when the market puts you in a similar position again.
This week: October 5 through October 9
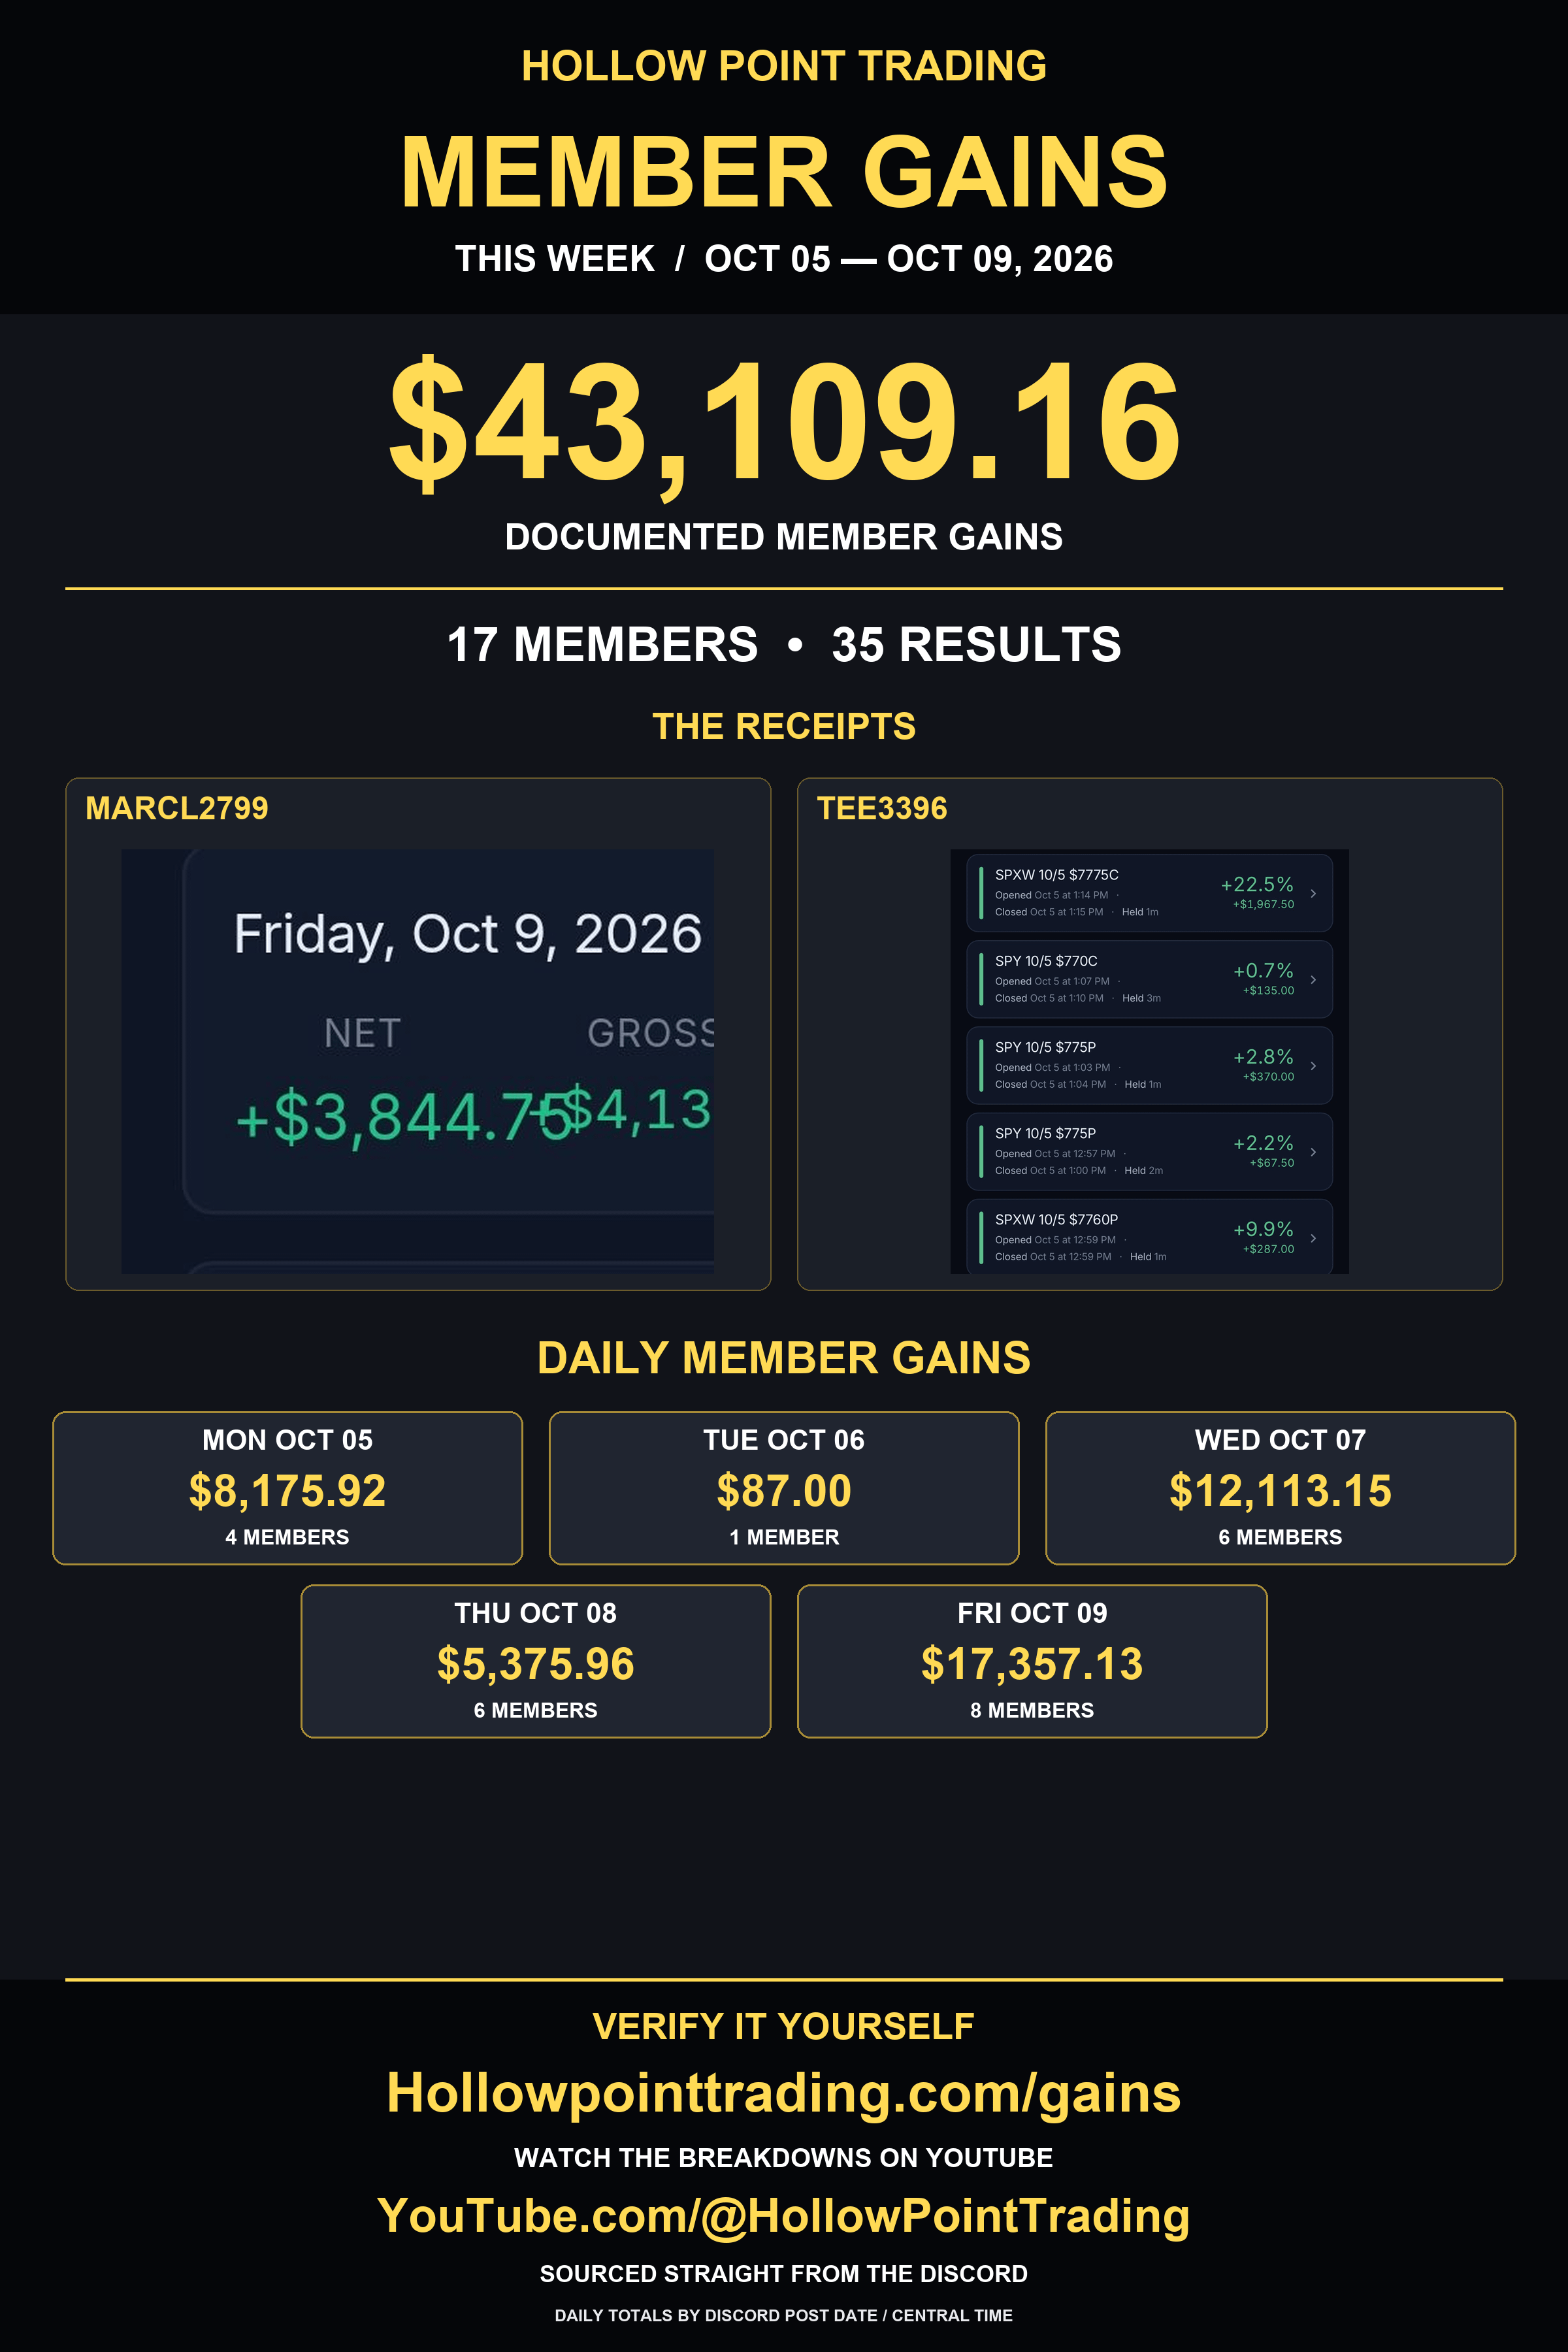
The reconciled source ledger contains $43,109.16 in positive member-submitted results, across 35 counted entries from 17 members. It is a collection of community submissions linked to their original messages, not one person’s account.
Member subtotals include bacchus._ at $8,156.67; sweetz1 at $6,264.55; tee3396 at $5,008.00; jaybob318 at $4,813.43; trader115 at $4,290.30; and marcl2799 at $3,917.85.
Different people have different accounts, experience, risk limits and execution. The point is that the community’s work extends beyond one highlight from one trader.
The past month: a wider view
For September 10 through October 9, the dated ledger contains $193,008.40 across 215 counted positive entries from 29 members. This week’s results are already included in that number, not added twice. The complete reconciled August 20 through October 9 collection totals $350,360.77.
Accounting note: this is a positive-results collection, not aggregate net profits or cash withdrawals. It includes closed records, realized portions, evaluation/simulation results, day or period results that can include marked positions, rounded reports and reconstructed gross results. Standalone losses are excluded under the existing method. Repeated trades and overlapping statements were reconciled where identified; funding certificates and payouts were not added.
PLTR: the callout comes before the screenshot
The October 9 recording in this week’s video shows the Palantir $205 call idea being shared with Discord. That is the part I want people to notice: the idea being communicated with the setup visible, rather than only appearing after it becomes a story.
The RixTrade position screens are simulated. They illustrate the communication sequence, not verified live profits. The member-results ledger is separate; I am not attributing all those results to that PLTR idea.
What are we watching? What needs to happen for the idea to make sense? What tells us we are wrong? What changes when price reacts? A ticker without that context leaves too much for someone else to guess.
One connected process
The Saturday deep dive follows the same process at a larger scale. Start with the indexes. Check whether participation supports the headline. Compare software, semiconductors and the broader sectors. Connect the evidence to individual stocks, funding conditions, commodities and the next catalysts.
A strong stock inside a weak group is not the same setup as an entire group gaining support. A green index with narrow participation is not the same condition as a broad advance. Those distinctions are why I return to price, participation and follow through rather than treating every candle as a prediction.
The public articles explain the reasoning. The videos show it on the charts. The Discord callouts make the communication visible. Member submissions show selected experiences without erasing differences between accounts.
The standard I care about
Trading will never be perfect. The goal is not to find a room where nobody is ever wrong. It is to build a process that helps you prepare, recognize what matters, manage risk and evaluate your own decisions honestly.
Clear education. Transparent communication. Accountability after the idea goes out. Judge the work by whether you can follow it, not just whether a screenshot looks exciting.
Explore the member-results gallery, the free education library and the HPT community.