
Start with three rows, not one headline. A manufacturer generates operating cash, spends on capacity and may collect investment incentives. Put each flow in its proper place before deciding what an improvement in free cash flow says about the underlying business. Texas Instruments offers a useful worked example of why that discipline matters.
This is Hollow Point Trading’s October 3, 2026, 12:30 p.m. Central edition, prepared after its scheduled slot. U.S. equities are closed on Saturday. The market observations below are from the completed October 2 daily candle, captured anew today; they are not live weekend prices.
Macro: factories connect current cash to future capacity
Semiconductor manufacturing sits between two clocks. Customers place orders as their own production needs change, while a manufacturer commits resources to capacity that may serve those customers over a much longer period. A quarterly cash comparison can therefore combine the current demand cycle with decisions taken earlier.
For analog and embedded-processing businesses, the relevant chain runs from end-market production needs through component demand to the economics of manufacturing and supplying those components. That chain is a framework for investigation. It does not prove that any particular customer increased orders, that a factory is fully utilized or that Friday’s stock move was caused by one item of news.
A capacity investment reduces cash available now even when it may support future output. Incentives can alter the cash cost borne by the manufacturer, but their receipt does not establish future customer demand. Separating those questions prevents a funding benefit from becoming an unsupported operating-growth conclusion.
The valuation question is also broader than a single cash total. Investors can place different weights on repeatable operating generation, the timing of capital outlays and an incentive tied to qualifying investment. Those judgments require evidence about duration and timing. A clean reconciliation is the starting point for that assessment, not its conclusion.
Fundamental: preserve the company’s cash-flow definition
TI’s July 22 release defines non-GAAP free cash flow as operating cash less capital expenditures plus CHIPS Act incentive proceeds. For the twelve months ended June 30, it reports $8.667 billion, $3.312 billion and $1.179 billion in those respective rows, producing $6.534 billion. The figures are historical reported results, not a September-quarter forecast.
The same reconciliation notes $433 million of investment-tax-credit benefits already included in trailing operating cash. Thus $8.667 minus $3.312 equals $5.355 billion before the separately added proceeds; adding $1.179 gives $6.534 billion. Adding the $433 million again would double-count a benefit already inside operating cash. This is reconciliation arithmetic, not a new company metric.
The teaching exercise: trace location before adjusting
Think of a cash bridge as an address book. Each number needs a location as well as a name. A benefit labeled as an investment tax credit can affect a tax payment inside operating cash, while a separately reported receipt can appear elsewhere in the statement. Similar policy origins do not make two reported rows interchangeable.
A practical review begins by copying the company’s stated definition and periods. Next, mark which adjustments are separate additions and which amounts are already embedded in a starting subtotal. Only then attempt an alternative analytical view. Otherwise, a well-intentioned adjustment can count the same economic benefit twice.
The subtraction shown above isolates operating cash after reported capital spending before the separately added proceeds. It does not isolate cash generation entirely without incentives: operating cash still contains the disclosed tax-credit benefit. It is therefore a useful intermediate row with a specific limitation. Giving it an unrestricted label would hide the very issue the exercise is meant to reveal.
An analyst considering a broader adjustment would need to define what is being removed, keep the accounting periods compatible and account for how those items entered the original measure. This article does not estimate undisclosed incentives or claim that the company’s non-GAAP definition is wrong. The objective is to understand its construction and avoid presenting a different measure under the same name.
October 21: bring the same bridge to the next report
TI’s October 1 announcement schedules the third-quarter earnings webcast for Wednesday, October 21 at 3:30 p.m. Central. That is the verified upcoming catalyst. The next disclosure will provide new evidence; no third-quarter outcome is assumed here.
At that checkpoint, compare operating cash, capital expenditures and incentive proceeds over matching periods. Check the reconciliation footnotes before carrying a prior adjustment forward. A change in the final subtotal can have several contributors, and a larger number alone cannot tell you which contributor is repeatable.
A strong research note can leave uncertainty visible. Record the disclosed bridge, describe what changed and state which durability question remains unanswered. That approach is more useful than forcing each movement into a single story about demand, factories or policy. The next earnings call may clarify those relationships, but the clarification is future evidence.
Technical: a local reclaim now faces a round-number test
The fresh daily chart shows the October 2 TXN candle opening at $290.00, reaching $297.06, falling to $288.20 and closing at $293.80. Its close-to-close gain is $12.49, or 4.44%, on the captured feed. The established 55 EMA is $273.44, and RSI(14), the only lower panel, is 70.37.
This framing concentrates on the August–September decline toward the selected $248.13 swing low and the later rebound. The marked swing-high reference is $273.33, close to the average’s current value. Price has moved above that cluster. The visible $300 line is a round-number reference; Friday stopped short of it. This is a local recovery test, not proof that every older high has been cleared.
RSI above 70 describes strong recent momentum on this timeframe. It is neither a mandatory sell instruction nor confirmation that a new entry has favorable risk. After a large daily advance, the distance to a nearby invalidation and the possibility of a reopening gap deserve attention. A coherent cash-flow bridge does not remove either issue.
Next-session scenarios: distinguish extension from acceptance
Extension: a sustained move above $297.06 would open a test of $300. Acceptance above that round number, followed by a held retest, would be stronger evidence than a brief touch. A return below it after an excursion would weaken that specific acceptance claim; $300 is not a guaranteed target or exit.
Pause: a range between $288.20 and $297.06 would leave the completed daily candle’s boundaries intact. New bars would show whether that pause retains the advance or loses it. Momentum can cool through time as well as price, but that possibility must be observed rather than promised.
Failure: a sustained loss of $288.20 followed by a failed reclaim would invalidate an immediate thesis built around Friday’s low holding. A deeper return toward the $273.33 swing reference and the updated 55 EMA would then test the larger local reclaim. The capture’s $273.44 average changes with later bars. The $263.70, $260.73 and $257.76 retracement markings are farther context, not automatic support or prescribed orders.
Risk: the cash bridge and price boundary answer different questions
Earnings can reset expectations faster than a daily chart offers an orderly retest. A gap can cross a planned threshold, and options introduce spread, volatility and time-decay exposure beyond this chart’s information. No position size or executed trade is prescribed.
The fundamental discipline is to locate each cash benefit once. The technical discipline is to define the condition that would overturn a setup before treating momentum as confirmation. Both remain conditional on new evidence. This is educational research; no HPT holding, executed transaction or realized performance is asserted.
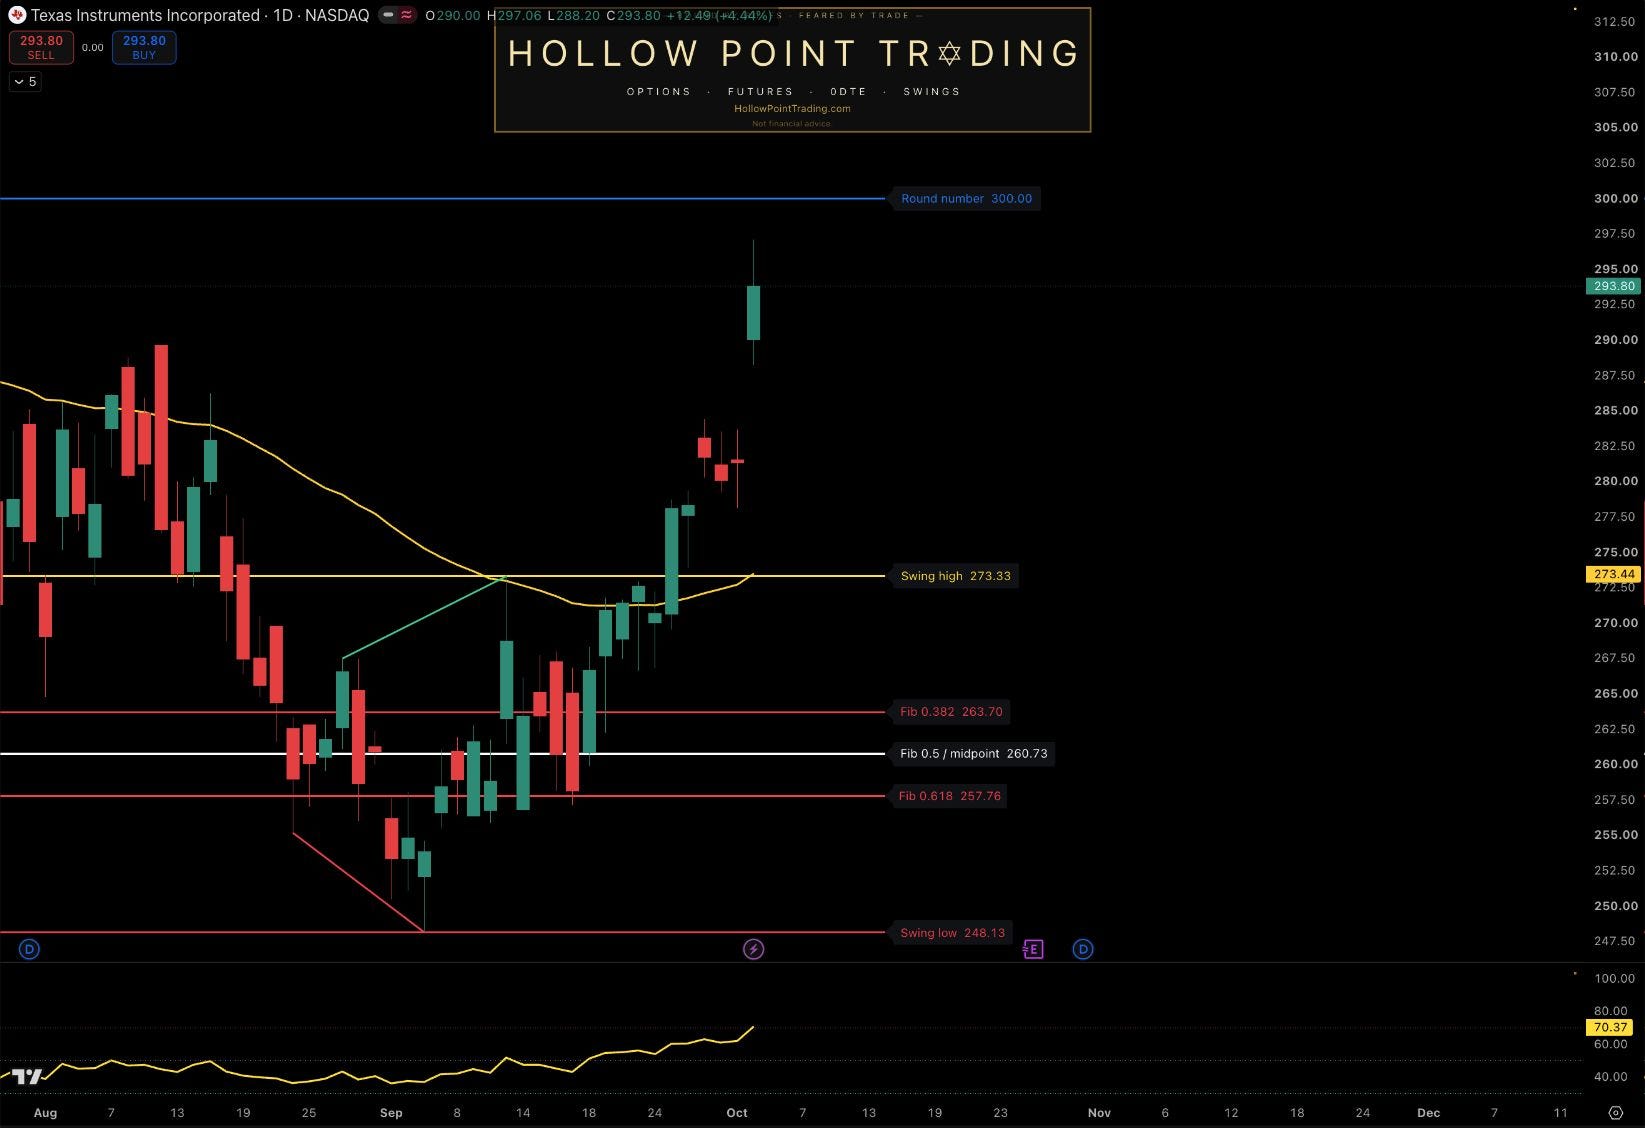
Source: genuine TradingView publisher-owned chart; requested NASDAQ:TXN, observed BATS:TXN / NASDAQ by Cboe One, daily (1D). Captured October 3, 2026 at approximately 12:36 p.m. America/Chicago. Saturday equities closed; completed October 2 candle. Established 55 EMA $273.44; RSI(14) 70.37 is the sole lower panel. Direct chart-region screenshot; native export previously failed scale-alignment review. Static historical, feed-specific image; selected swing anchors and subsequent bars change levels and indicators. No live weekend quote or guaranteed execution.
Sources and limits
TI second-quarter results and cash reconciliation — July 22
TI third-quarter webcast announcement — October 1
Cash values are historical reported results; the bridge arithmetic is an explicit calculation. October 21 is an announced future webcast. Next-session price cases are conditional inference, with no assumed third-quarter outcome.
Discussion: Which cash-bridge row would you investigate first at TI’s next report, and what price evidence would make you reject TXN’s current local reclaim?