
Macro: A growing connection base can coexist with lower total sales
A telecom company sells ongoing service and also sells devices. Those revenue streams behave differently. A new wireless connection may add recurring service revenue, while a customer who keeps a phone longer may leave less equipment revenue in the current quarter. That makes the headline sales number a poor shortcut for the direction of the underlying connection base.
This is Hollow Point Trading’s 11:30 a.m. Central edition for Sunday, October 4. U.S. cash equities are closed. The technical chart is a fresh capture of completed daily candles through Friday, October 2; it is not a weekend trading quote. The business figures below are historical second-quarter results. Verizon’s scheduled October 26 third-quarter report is a future catalyst, with no result available yet.
At the sector level, telecom operators must keep funding networks while competing for customers. At the company level, the useful distinction is between mobility and broadband service activity, equipment transactions, and the consolidated revenue line that blends them. The teaching point is to separate a flow of new connections from dollars of revenue and then ask which mix can support durable cash generation. Net additions are counts, not a measure of the lifetime economics of each customer.
A slowing device replacement cycle is a plausible mechanism for weaker equipment sales, but this article does not assert that it was the sole cause of Verizon’s reported change. Neither a macro rate forecast nor an unverified claim about consumer budgets is needed to read the disclosed figures. The disciplined question is narrower: did service growth and new connections offset the equipment decline in the measured quarter, and what must be checked at the next one?
Fundamental: More connections, but a smaller consolidated revenue line
In its July 24 second-quarter release, Verizon reported mobility and broadband service revenue of about $23.4 billion, up 2.8% year over year. It added 184,000 retail postpaid phone connections and 348,000 broadband connections. The broadband total comprised 193,000 fixed wireless access additions and 155,000 fiber additions. These are actual second-quarter figures reported by the company, not a forecast for October.
The same release reported consolidated operating revenue of $34.3 billion, down 0.7% year over year. Equipment revenue declined by more than $1.2 billion, or nearly 20%, in the company’s description. Service and equipment can therefore point in opposite directions without an arithmetic contradiction. A reader who only sees the total revenue decrease may miss the service growth; a reader who only sees the net-addition count may miss the current equipment drag.
The additions do not by themselves establish a profitable cohort. They do not tell us acquisition cost, churn after the reported period, pricing concessions or the capital required to support network capacity. Likewise, a lower equipment line is not automatically beneficial or harmful: the profit contribution and customer-retention implications must be evaluated with more detail than a sales number alone supplies. This is an evidence boundary, not a prediction about the next quarter.
The worksheet: Avoid mixing customer counts with revenue dollars
Use a deliberately simplified illustration. Suppose a business has 100 units of service sales and 20 units of equipment sales, for 120 total. If service rises 3% to 103 while equipment falls 20% to 16, total becomes 119, down about 0.8%. In that hypothetical, service improves even as consolidated sales decline. These units are teaching arithmetic; they are not a reconstruction of Verizon’s accounts or management guidance.
Now add a second column for economics rather than treating the first column as the whole answer. For each added postpaid, fixed-wireless or fiber connection, ask whether recurring receipts exceed support, marketing, network and financing costs over time. The quarter’s net-addition figure does not contain that answer. It is a starting point for a retention and cash-flow investigation.
Verizon also gave a full-year postpaid phone net-additions outlook of 750,000 to 1 million in July. That range is guidance, not completed results. Compare it with actual year-to-date counts only after checking the company’s definitions and any update on October 26. Do not add a guidance range to reported additions or describe the upper end as achieved.
Fundamental: October 26 is the next measured test
Verizon announced that third-quarter materials are scheduled for Monday, October 26 at about 7:00 a.m. Eastern, or 6:00 a.m. Central; the webcast is scheduled for 8:30 a.m. Eastern, or 7:30 a.m. Central. The announcement gives a date, not third-quarter performance. A pre-release thesis should identify what evidence would change it.
A constructive service-mix reading would show mobility and broadband service revenue continuing to grow while the contribution from new connections holds up and the equipment drag narrows or is explained. A mixed reading would show net additions without stronger revenue conversion. A weaker reading would show both fewer additions and slower service growth. These are HPT research scenarios, not company forecasts. Reported results, margins and cash flow would be needed before promoting any scenario to an outcome.
Technical: The daily breakdown defines the repair work
The publisher-owned TradingView chart requested NYSE:VZ and displays the NYSE-listed Verizon feed through Cboe One, observed as BATS:VZ, on daily candles. Friday, October 2 opened at $46.05, reached $46.39, traded down to $45.79 and closed at $45.92. The established 55-day EMA reads $47.72. RSI(14), the sole lower panel, reads 34.48. All are historical chart observations; there is no live Sunday equity print.
The June–October frame shows a climb to the displayed $51.67 selected swing high, then a sharp reversal through the average and below the $46.16 selected swing-low reference. The decline is visible price behavior. It does not prove that equipment sales caused selling, and the RSI reading does not certify an imminent bounce. Momentum can remain weak while price keeps probing lower.
The bullish repair scenario starts with daily acceptance back above $46.16, followed by a pullback that holds rather than immediately failing. The next test is the moving 55-day EMA around $47.72. Above it, the displayed $48.26, $48.91 and $49.56 retracement references mark successive areas to reassess supply; they are chart checkpoints, not promised targets. Only after a sustained repair would the old $51.67 high become relevant again.
The base scenario is a pause around Friday’s $45.79–$46.39 range while the $46.16 and EMA references stay contested. The bearish scenario is a daily loss of $45.79 followed by a failed reclaim. This chart does not justify inventing a precise downside floor below the visible structure. Reframe with a new chart if the range breaks rather than treating a round number as verified support.
A proposed bullish setup is invalidated locally if its reclaimed $46.16 area fails and price accepts back below the support chosen for the trade. Conversely, sustained acceptance over the EMA would weaken the immediate breakdown reading. October 26 creates gap risk that can skip a stop, while options can lose value through implied-volatility change and time decay. Check actual-session prices and liquidity before any decision. This is educational analysis; it does not imply an HPT position, fill or outcome.
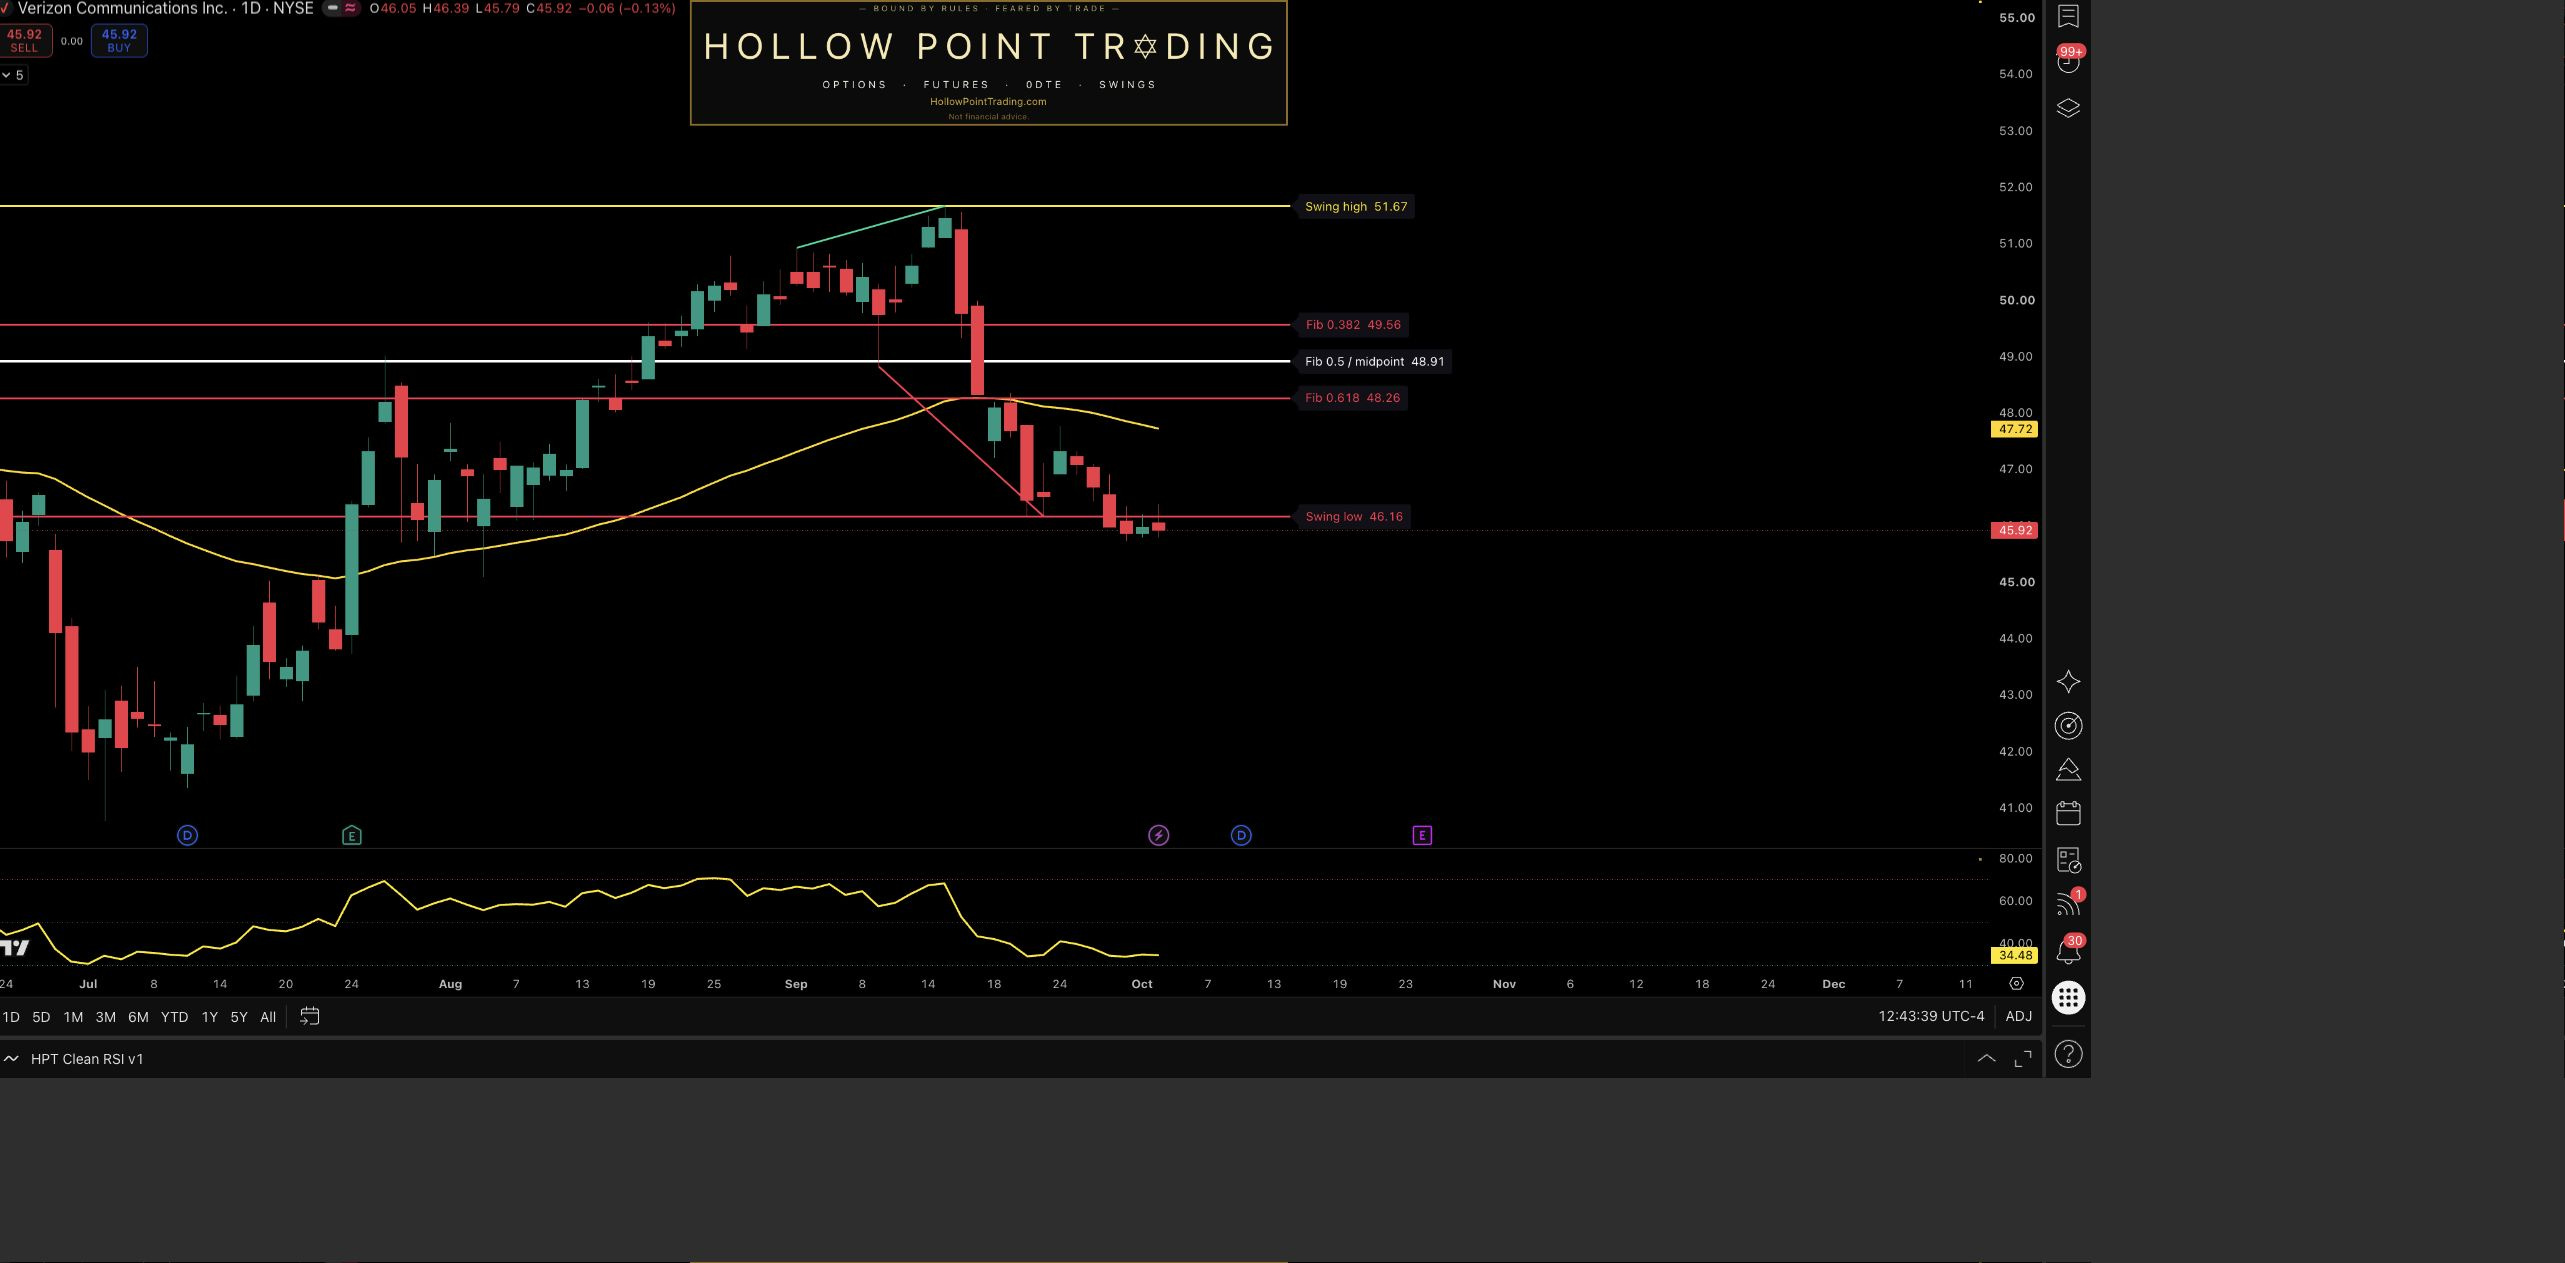
Source: TradingView; requested NYSE:VZ, observed BATS:VZ / NYSE by Cboe One, daily (1D). Captured October 4, 2026 at 11:43 a.m. Central. Sunday U.S. cash equities closed; latest completed candle October 2. Established EMA(55) $47.72 and RSI(14) 34.48, the sole lower panel. Static chart levels do not establish business causation, valuation, or executable weekend prices.
Sources and discussion
Verizon — July 24 second-quarter 2026 results
Verizon — September 28 announcement of October 26 third-quarter report
TradingView — fresh publisher-owned Verizon daily chart
Sources checked October 4, 2026. The arithmetic illustration and conditional scenarios are HPT analysis, not Verizon guidance or actual third-quarter results.
Discussion: On October 26, what pairing of service-revenue growth and equipment-revenue change would persuade you that Verizon’s connection gains are converting into durable business growth, and what daily price behavior would confirm a $46.16 repair?