
West Pharmaceutical’s next earnings report will test more than the pace of sales. A product-rights transfer changes which business sits inside the comparison. Investors need to separate what left the reporting perimeter from what happened to demand in the business that remains. The daily stock chart offers a separate question: can a pullback above its rising average hold?
Hollow Point Trading research · October 9, 2026. West announced its October 29 reporting date yesterday. The financial baseline below is the June quarter and July guidance, not a newly released earnings result. The genuine daily chart was exported today at 14:23:20 America/Chicago during the regular U.S. cash session. Its candle is still forming.
Macro — a drug-delivery supplier is not a prescription count
The sector lens is health care; the narrower theme is the containment and delivery infrastructure used for injectable medicines. Research on this business should begin with customers’ manufacturing needs and the supplier’s own comparable disclosures. A popular therapeutic category does not automatically establish the number of components ordered, the timing of a customer inventory change or the profitability of a particular supplier.
The transmission channels are different. A customer can increase use of one drug while changing its device design, manufacturing schedule or inventory policy. A supplier can sell a different mix of higher-value products while total physical units move differently. Those are possibilities to investigate, not measured developments in this edition. This analysis does not infer prescription growth or customer orders from the stock’s direction.
Financing conditions can also change how investors value expected future earnings, independently of operating performance. That is a valuation channel, not a claim that a particular rate move caused today’s price. The useful discipline is to keep the broad health-care theme, the company’s actual reporting boundary and the market’s price response in separate records. Each requires its own evidence.
Fundamental — restore comparability before scoring growth
West said the SmartDose 3.5mL manufacturing and supply-rights transfer, including associated facilities, closed July 1. It continues other SmartDose versions, including 10mL. This was a specific transfer, not an announced exit from every product carrying the SmartDose name.
The July 23 release reported Q2 sales of $872.3 million, up 13.8% reported and 12.7% organic. Its Q3 guidance was $820–835 million, implying 1.9–3.8% reported growth versus 7.0–8.9% organic. The release excludes $30 million of prior-year Q3 SmartDose 3.5mL sales from the organic comparison and includes an approximately one-percentage-point currency headwind. Organic sales exclude acquisition/divestiture effects and use comparable exchange rates. These are management’s dated definitions and expectations, not observed Q3 results.
The arithmetic lesson is easiest with an explicitly invented example. Suppose last year’s business sold $100, including $10 from an activity later transferred away. The remaining business then sells $99. Relative to the original $100 total, sales declined 1%. Relative to the $90 comparable remaining business, they increased 10%. Both calculations can be correct while answering different questions. These amounts are illustrative and are not estimates of West’s results.
This does not make the adjusted comparison automatically superior. The original total still matters to the company’s actual scale and resources. The comparable perimeter helps investigate demand in the remaining operations. An analyst should preserve both rather than treating the favorable number as permission to discard the other. Currency translation is another bridge, so the headline cannot be reconciled by subtracting the transferred product’s revenue alone.
For the next release, build the comparison in order. First establish the quarter, currency basis and activities included in each period. Then reconcile reported sales with the stated organic measure. Finally examine whether the remaining business supports a durable operating interpretation. A slower reported growth rate could reflect a changed perimeter, weaker demand, currency or several influences together; the rate by itself cannot identify their contributions.
The constructive business branch would gain support from a transparent reconciliation and healthy comparable execution after the transfer. The cautious branch would strengthen if the remaining business weakened despite an apparently favorable organic headline, or if the bridge could not be reproduced from the disclosure. Neither branch is a forecast. Historical strength does not remove the need to test a new reporting period.
The dated checkpoint is October 29: West says results will arrive before the market opens, followed by an 8 a.m. Eastern conference call, or 7 a.m. Central. The reporting-date announcement supplies a calendar event, not an earnings surprise or evidence about how the coming figures will compare with expectations.
Technical — a pullback still sits above the daily average
The native TradingView chart identifies WST on the NYSE listing, observed through BATS:WST / Cboe One, on the daily timeframe. Its forming October 9 candle reads open $363.31, high $370.20, low $362.18 and captured latest $367.32. The established 55 EMA is $355.47; RSI(14) is 53.52 in the sole lower panel. The exported candle legend and latest-price scale agree.
The visible sequence shows a sharp July decline, an August recovery, a September advance and a recent pullback from the upper-$370s region. The average slopes upward and price remains above it. RSI is above 50 but below its recent stronger readings. That describes a pullback within improved daily structure; it does not prove that buyers have completed a new breakout or explain which business comparison they are using.
Continuation branch: a later completed daily close above the captured $370.20 high, followed by a retest that holds, would strengthen the immediate rebound. The approximate $375–380 area contains visible recent highs and is a farther price-response test, not a guaranteed target. A brief move through the first reference that fails back into the range would challenge the narrow continuation premise.
Pullback branch: a test and reclaim of the captured $362.18 low could preserve the local bounce question. A sustained loss and failed reclaim would weaken it and bring the dynamic 55 EMA near the captured $355.47 into focus. That average changes with subsequent prices and need not stop a decline. A successful recovery above the lost boundary would challenge the failure branch.
Unresolved branch: price remains within the captured $362.18–370.20 range while the completed daily evidence is pending. Waiting is a valid research outcome. These boundaries belong to an unfinished session; they are not fixed orders or independently confirmed multiweek support. A later bar can extend the range, and the map must then be reviewed against the new evidence.
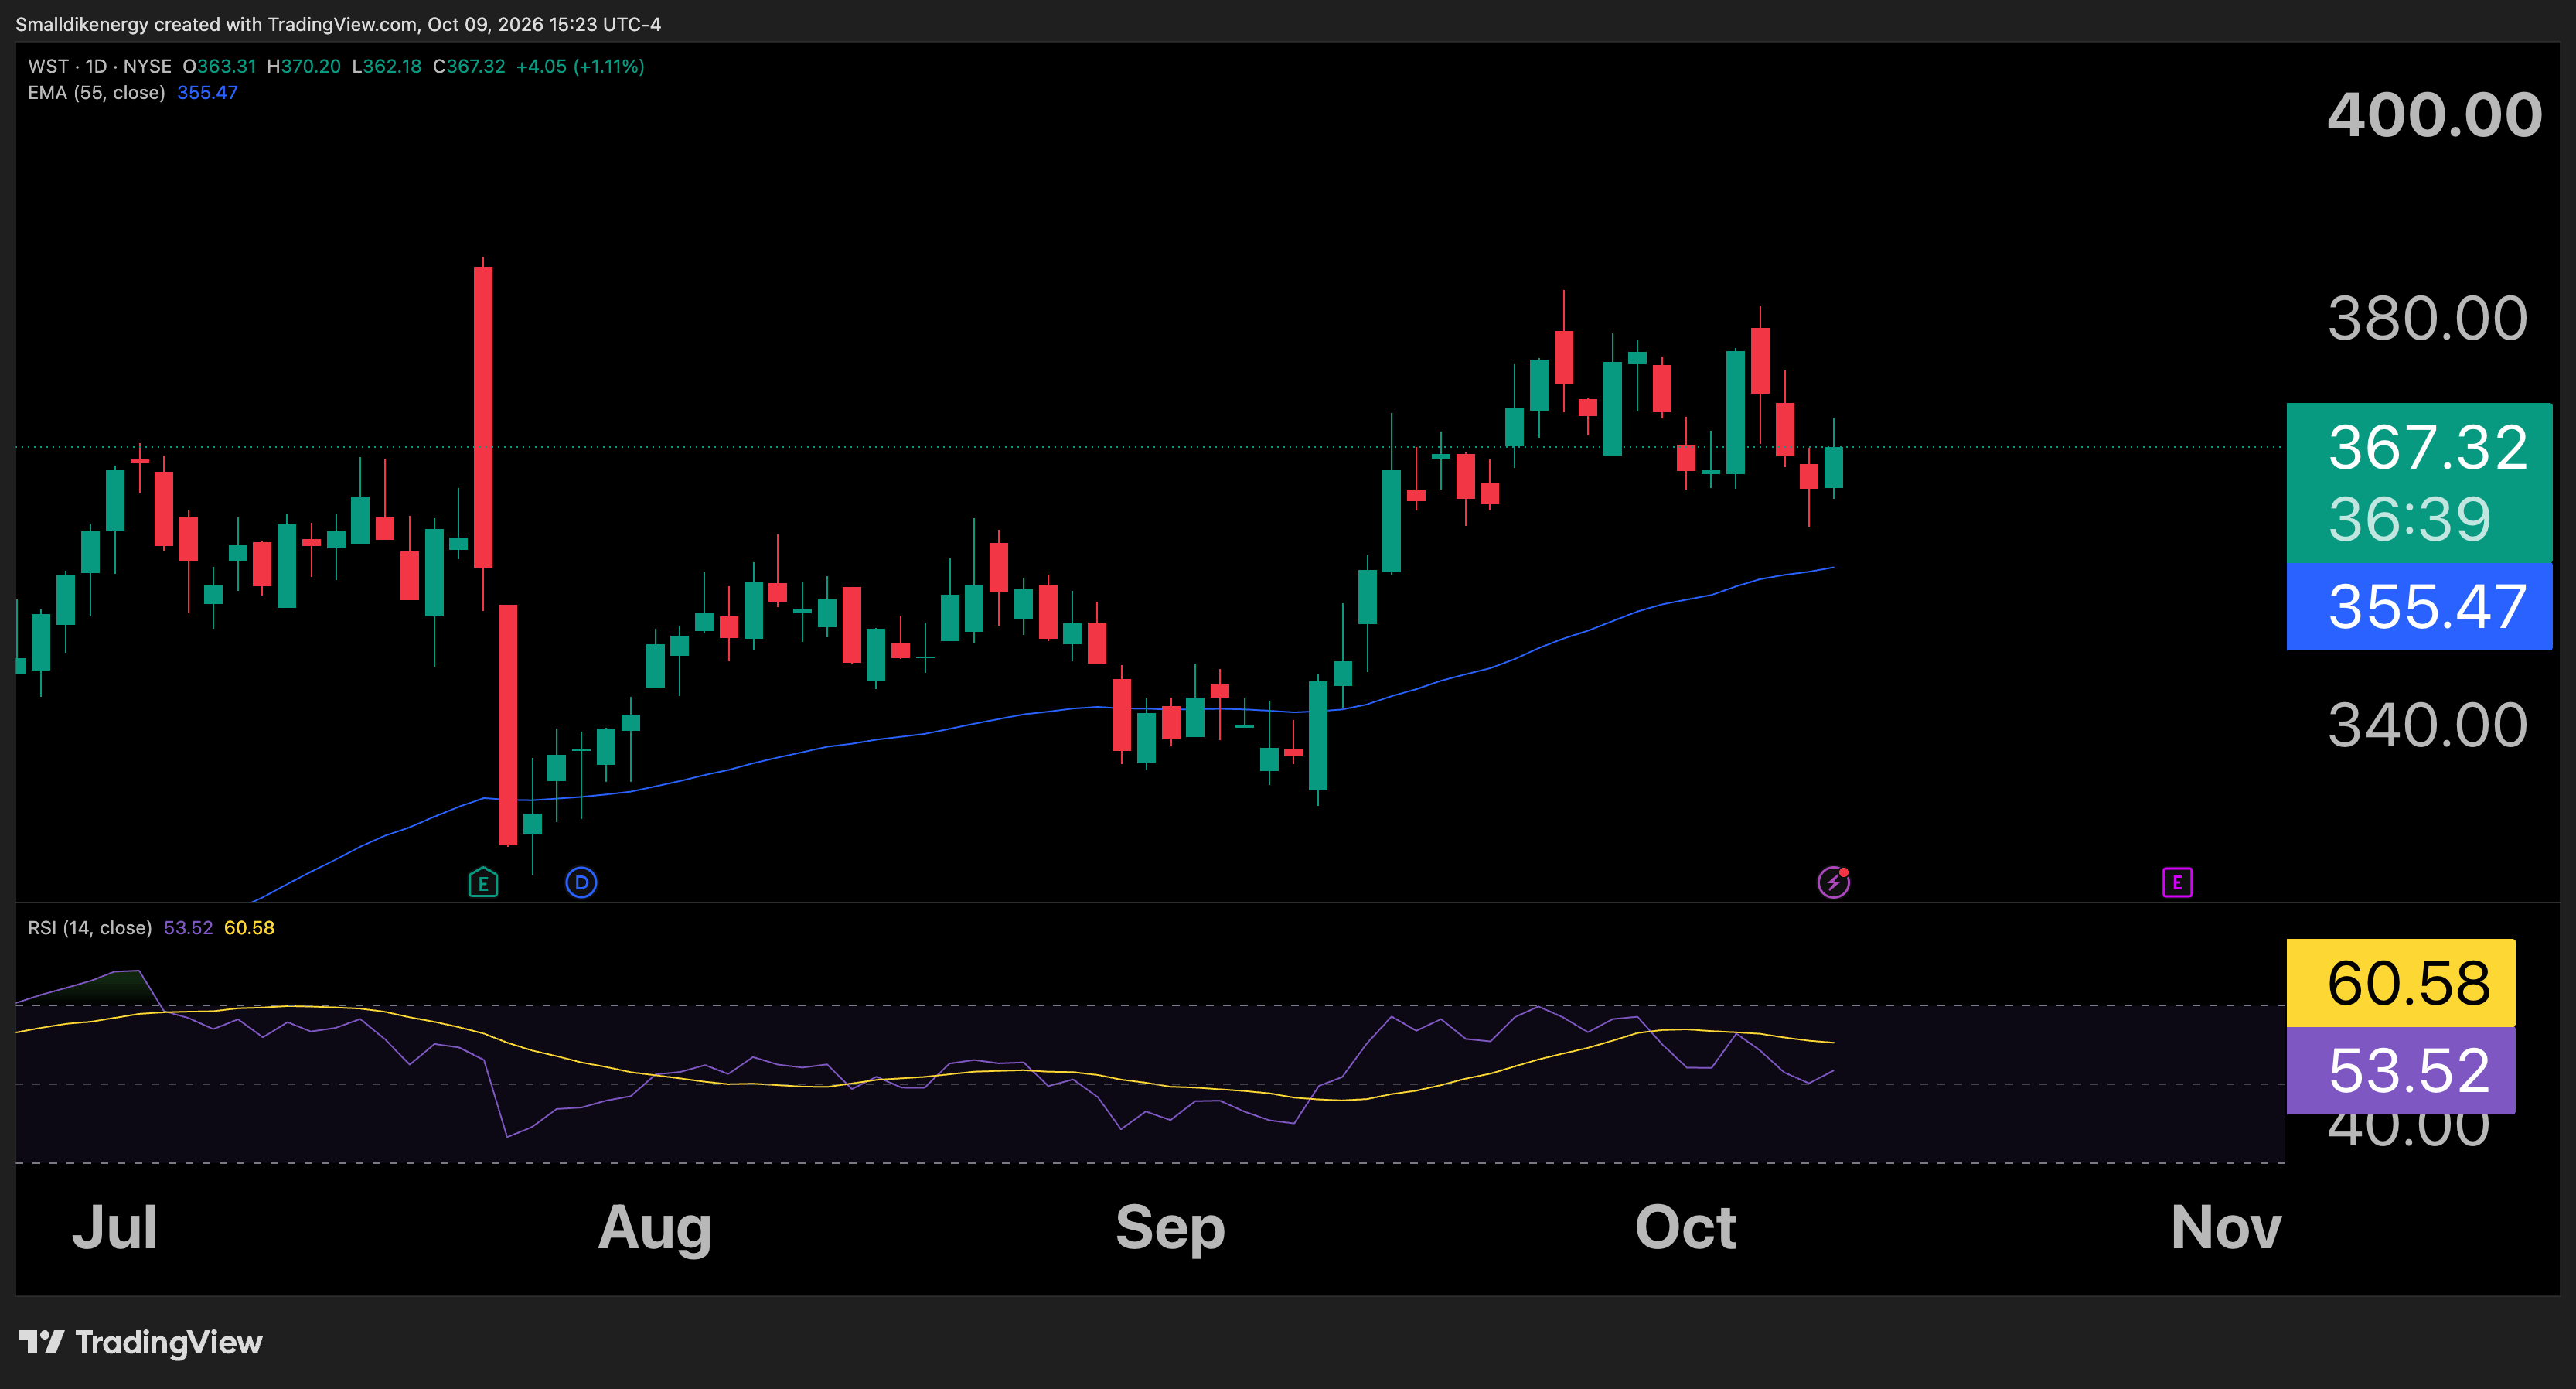
Genuine native TradingView WST 1D export · NYSE listing / observed BATS:WST Cboe One feed · October 9, 2026 at 14:23:20 America/Chicago. Forming regular-session candle O/H/L/latest $363.31/$370.20/$362.18/$367.32; 55 EMA $355.47; RSI(14) 53.52 in the sole lower panel. Candle legend and price scale agree. Static intraday evidence, not a completed daily close, executable quote or guaranteed outcome.
Risk and the next evidence checkpoint
Friday’s completed daily bar is the next chart checkpoint; October 29 is the announced financial checkpoint. A correct sales reconciliation cannot protect a position from a gap, and a held moving average cannot validate future demand. This is educational research, with no claimed holding, fill, transaction or personalized allocation. Trading involves substantial risk; static references and indicators do not cap loss.
The practical task is to retain two comparisons and two tests. Keep actual reported scale beside comparable operating growth. Keep the proposed continuation beside its failure condition. That makes it possible to revise the view when evidence changes without pretending that an accounting definition or a single green candle settled the entire investment question.
Primary sources
West · July 1 SmartDose 3.5mL transfer completion
West · July 23 Q2 results and organic-sales definitions
West · October 8 announcement of October 29 results
For West’s October 29 update, what would change your view first: the comparable-sales bridge, execution in the remaining business, or a failed daily reclaim—and what would invalidate your interpretation?