
A price cut has two audiences. A shopper sees a smaller bill. An investor sees a choice about how much of a cost benefit the retailer retains. Walmart’s tariff-refund disclosure lets us examine that choice without pretending that a quarterly benefit automatically repeats.
This is Hollow Point Trading’s October 3, 2026, 2 p.m. Central edition, prepared after its scheduled slot. It is Saturday and U.S. equities are closed. The chart below was captured anew today and shows the completed week through October 2. There is no live weekend equity price in this article.
Macro — A trade-cost recovery becomes a pricing decision
Retail sits at the junction between a supplier’s costs and a household’s spending choices. A change in the cost of bringing goods to market can affect that junction in more than one way. A retailer might keep a benefit in its margin, pass some to shoppers through lower prices, or use resources to improve the shopping experience. The immediate accounting result and the later competitive effect can arrive at different times.
The transmission matters more than a broad claim that a policy development is good for all retailers. Product mix, sourcing, pricing decisions and customer response differ. A cost recovery can improve a reported quarter even when management uses some of the benefit to support value for customers. Whether that support produces durable demand requires subsequent evidence.
For a weekend research note, the relevant catalyst is Walmart’s disclosed refund and its stated intention to prioritize price investment. The underlying disclosure is historical, from the quarter ended July 31 and the August 20 results release. Re-reading it today is not a new government announcement or an October operating result. The next business disclosure will be a test of what persists.
Fundamental — Locate the recovery inside the income statement
Walmart’s July-quarter Form 10-Q says it received approximately $2.9 billion of tariff refunds, primarily in Walmart U.S. It recorded them as a reduction of cost of sales. The amount represents substantially all refunds requested. The filing says a significant portion supported customer initiatives, chiefly price investment and other cost mitigation, with price investment expected to remain a priority through fiscal 2027.
The accounting location explains the first effect. Reducing cost of sales increases gross profit, all else equal. That is distinct from selling additional goods. A benefit can pass into operating income while the retailer makes pricing choices that work in the other direction. The filing identifies the gross receipt; it does not provide a simple dollar bridge for every offset that would let this article isolate a precise net refund contribution.
“Adjusted” still needs its own footnotes
The August 20 release reports 28.8% operating-income growth and 17.4% adjusted growth in constant currency. It explicitly says the latter includes tariff refunds, partly offset by price investments. Gross profit rate rose 96 basis points, primarily affected by the refunds. Management’s Q3 outlook calls for 3.0%–3.75% constant-currency net-sales growth and 2.0%–4.0% adjusted operating-income growth. These ranges are guidance, not achieved results.
The teaching point is simple: a non-GAAP label does not mean every unusual benefit has been removed. Read the company’s definition and commentary before treating its adjusted figure as an unrestricted measure of repeatable growth. This does not establish that Walmart’s measure is improper. It establishes what the company says remains inside it.
Try a fictional retailer as a worksheet exercise. It receives a cost recovery of 30 units and spends 12 units supporting lower prices. If all else is unchanged, the net effect is 18 units. Subtracting the whole 30 from profit while leaving the price investment in place answers a different question from removing both effects. These invented units are not Walmart estimates; they illustrate why the gross receipt and net effect cannot be interchanged.
A careful reader therefore keeps three lines: the receipt, the disclosed use of the benefit, and the remaining evidence gap. Leave the gap visible. Do not infer an exact offset from a phrase such as “significant portion,” or label an improvised subtraction as the company’s adjusted result.
The next comparison must test the use of the benefit
A constructive business case would show price investment supporting durable customer demand while the broader operation sustains profitability. A less favorable case would show that the benefit helped one comparison without establishing a lasting operating improvement. Both are possibilities, not reported outcomes. Lower prices can be a sensible competitive choice even if they make a near-term profit comparison less dramatic.
At the next disclosure, seek management’s explanation of gross margin, pricing and the remaining effect of the refund. Compare reported results with the previously stated guidance on matching definitions and periods. A slower growth rate after a benefit-heavy quarter need not mean every part of the business deteriorated. Equally, a strong headline should not substitute for evidence about its contributors.
Technical — The weekly decline has a nearby boundary and a farther trend test
The fresh TradingView weekly chart displays WMT’s NASDAQ listing on the Cboe One feed, identified internally as BATS:WMT. The completed September 28–October 2 candle opened at $107.90, reached $109.42, traded down to $103.59 and closed at $104.26. The week declined 3.45% against the prior close. The established 55-week EMA is $111.44. RSI(14), the only lower panel, is 39.10.
This framing spans the visible May-to-October decline. The average slopes lower and the latest weekly close remains underneath it. Several recent candles pause near the bottom of that broader decline; a pause alone is not a reversal. The weekly view intentionally asks a slower question than an intraday chart: can price retain a meaningful reclaim across completed bars?
Bull case: reclaiming $109.42 and holding it on a later test would improve the latest week’s structure. A larger repair would then have to address the updated 55-week EMA, currently $111.44. A move through the weekly high that cannot remain above it would invalidate that specific reclaim premise. Neither threshold promises a target or an entry.
Base case: movement between $103.59 and $109.42 leaves the completed weekly range unresolved. New daily evidence may help a trader examine that range, but it would be a separate timeframe study. This static weekly image does not establish intraday execution conditions.
Bear case: losing $103.59 and failing to recover it would challenge the premise that the latest weekly low is holding. The $100 area is a round-number observation reference farther below, not guaranteed support. A sustained return above the broken boundary would weaken the breakdown interpretation. RSI below 50 describes momentum on this timeframe; it is not an automatic instruction.
Risk — A useful refund analysis does not set an executable price
Monday’s opening gap can cross a planned boundary before a retest develops. Weekly candles compress five sessions and cannot show every path taken inside them. Options introduce spreads, volatility and time decay that this chart does not measure. The average and RSI will change as later bars arrive.
Use the filing to examine the destination of the cost recovery and new price evidence to examine the setup. Do not let either answer the other’s question. This is educational research, with no prescribed position size, guaranteed return, executed HPT trade or claimed realized result.
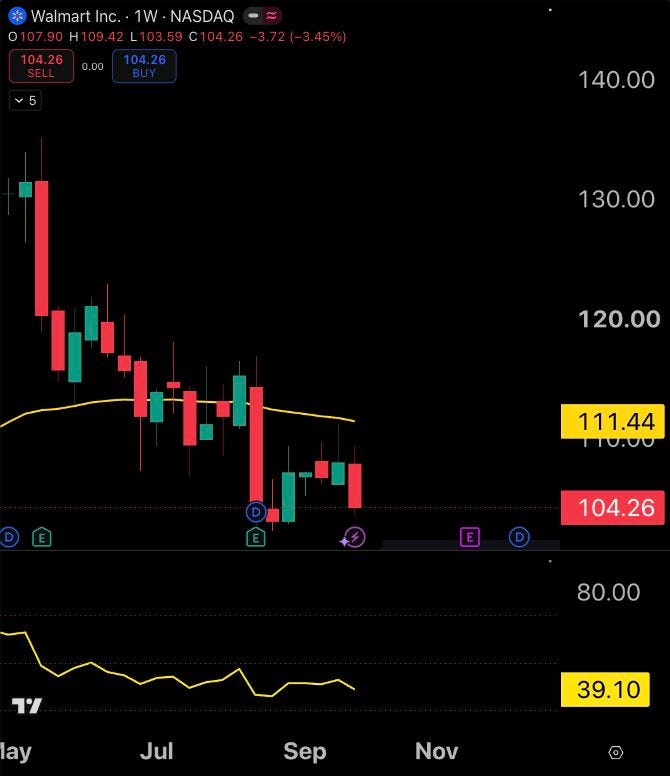
Source: genuine TradingView publisher-owned chart; requested NASDAQ:WMT, observed BATS:WMT / NASDAQ by Cboe One, weekly (1W). Captured October 3, 2026 at approximately 2:08 p.m. America/Chicago. Saturday equities closed; completed September 28–October 2 weekly candle. Established 55-week EMA $111.44; RSI(14) 39.10 is the only lower panel. Static historical feed-specific image; weekly aggregation hides intraday paths, and later bars change indicators. No live weekend quote, forecast or guaranteed execution.
Sources and evidence limits
Walmart Form 10-Q, quarter ended July 31, 2026 — tariff-refund accounting and customer initiatives
Walmart second-quarter results and management guidance — August 20, 2026
Company figures are historical reported results. Future price-investment priorities and Q3 outlook are management expectations. The fictional retailer exercise is a teaching illustration; business and price scenarios are inference. No October company result or undisclosed refund-offset amount is assumed.
Discussion: What disclosure would convince you that Walmart’s price investment is creating a durable benefit, and which weekly price failure would make you reject a WMT recovery scenario?