
You've watched it happen. Price grinds into a number and just... stops. Chops sideways for three hours like it's glued to a magnet. Then the next day the same stock rips 3% in twenty minutes with no news, no reason, nothing on the tape you can point to.
Most traders shrug and call it "the market being the market." It isn't random. A huge amount of that behavior — the pinning, the sudden violence, the way certain price levels act like walls — is the mechanical footprint of the options market forcing dealers to buy and sell the underlying. Not because they want to. Because their risk models make them.
This is the piece that turns that footprint into levels you can trade. We're going deep: who the dealers are, why they hedge, the difference between the two market regimes that gamma creates, where the flip level lives, how call and put walls become magnets and barriers, why Fridays and OPEX behave differently, how the whole thing shifts across timeframes and market regimes, how it stacks with the rest of the HPT toolkit, and the dozen ways traders blow themselves up misreading it. This is the definitive version. Buckle up.
The core concept: dealers are not your counterparty by choice
Every time you buy or sell an option, someone takes the other side. Retail buys calls and puts to make directional bets. Funds buy puts to hedge portfolios. But the party consistently on the other side of all of it isn't another gambler — it's a market maker (also called a dealer). Firms like Citadel Securities, Susquehanna, Optiver, Jane Street, Wolverine. They quote both sides of the option, collect the bid-ask spread thousands of times a second, and make their money on volume and flow, not on being right about direction.
Here's the thing that matters: a market maker does not want a directional bet. If they sell you a call and the stock rips, they lose. Their entire business model is being neutral — earning the spread while carrying as little market risk as possible. So the instant they take on an options position, they immediately hedge it in the underlying stock or futures to cancel out the directional exposure.
That hedging is not optional and it is not discretionary. It's driven by the Greeks — specifically delta and gamma — and it happens continuously, all day, in size. The aggregate of all that forced hedging is a river of buy and sell orders flowing into the tape that has nothing to do with anyone's opinion on the stock. That river is what we're learning to read.
The two Greeks that run the whole show
Two definitions, once, and we'll use them the rest of the way:
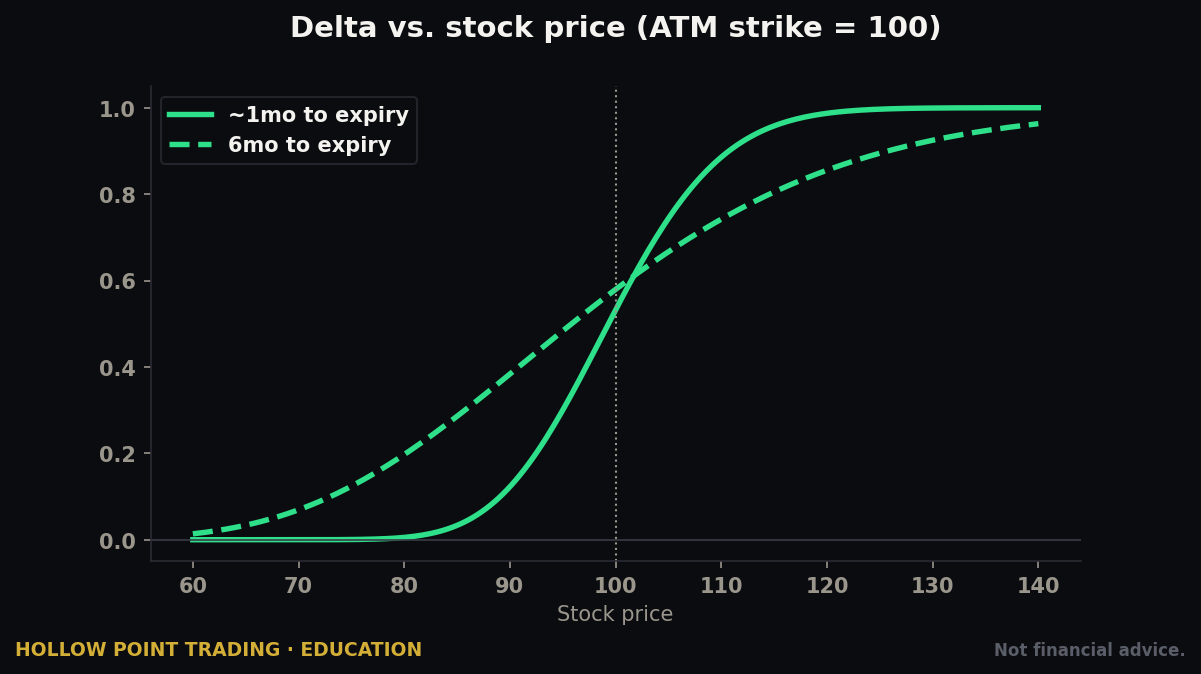
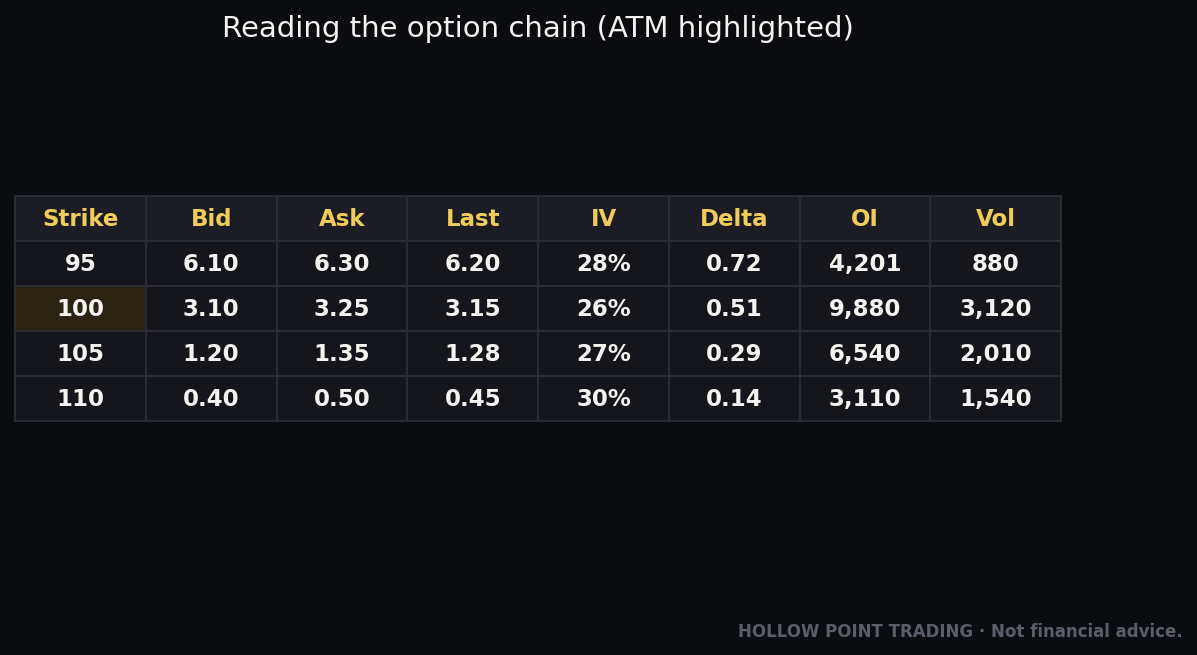
- Delta — how much an option's price moves per $1 move in the underlying. A call with 0.50 delta gains $0.50 for a $1 up-move. Delta also equals the number of shares the dealer must hold to be hedged: to hedge one short 0.50-delta call (100 shares of exposure), the dealer buys 50 shares. Delta ranges from 0 to 1 for calls and 0 to -1 for puts.
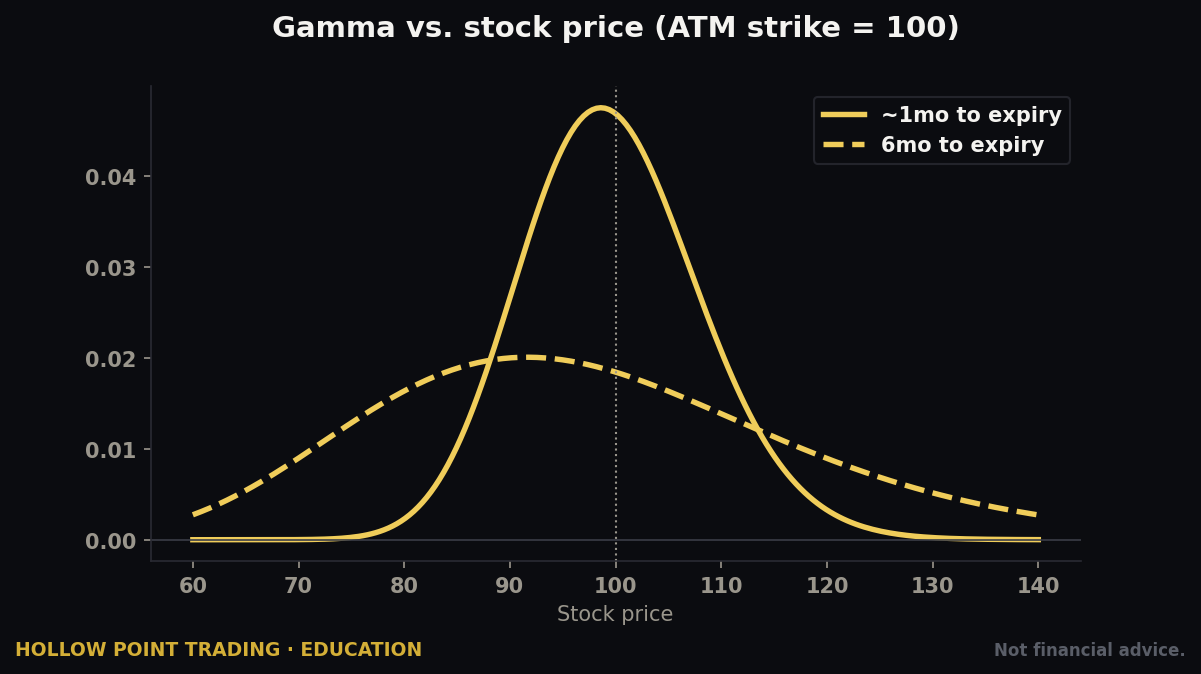
- Gamma — how fast delta changes as price moves. It's the acceleration term. High gamma means delta shifts quickly, which means the dealer's hedge gets stale fast and they have to re-hedge constantly. Gamma is highest for at-the-money options and explodes as expiration approaches. A 30-day at-the-money option has modest gamma; that same strike with two hours left to expiry has enormous gamma.
The distinction is the whole game. Delta tells the dealer how much stock to hold right now. Gamma tells you how violently that number will change as price moves — which means it tells you how much forced trading is about to hit the tape for any given move. A low-gamma book barely twitches. A high-gamma book has to trade constantly, and that constant trading is the footprint on the chart.
From one option to the whole market: what GEX actually measures
Gamma Exposure (GEX) is just the market-wide sum of all that gamma, converted into "how many shares (or dollars of underlying) do dealers have to trade for a 1% move in price." It tells you the size and, crucially, the direction of the forced hedging. That direction — whether dealers buy into strength or sell into it — is the whole ballgame.
A GEX number is usually expressed in dollars per 1% move. If a name shows +$800M of GEX, that means for a 1% move in the underlying, dealers collectively must trade roughly $800M of stock against the move to stay neutral. Positive means they're net long gamma (stabilizing). A reading of –$1.2B means they must trade $1.2B with the move — pouring fuel on it. The sign is the regime; the magnitude is how forceful the mechanical flow will be.
Two honest caveats before we build on this, because you'll get hurt if you skip them. First, published GEX numbers rest on an assumption about who is long and who is short each option — the standard model assumes dealers are short calls and short puts that the public bought. That assumption is right most of the time but not always, and when it's wrong, the sign can be wrong. Second, GEX is a snapshot of positioning, not a forecast of demand. It tells you how dealers will react to a move; it doesn't tell you what will start the move. Keep both of those in your back pocket the entire time.
The mechanism: why hedging direction flips the market's personality
The single most important idea in this entire piece: the direction a dealer hedges depends on whether they are long gamma or short gamma. These two states create two completely different markets. Learn to tell which one you're in and you're ahead of 90% of the tape.
Long gamma = the market that mean-reverts and pins
When dealers are long gamma, their hedging pushes against the move. This happens when the dealer is net long options (long calls and/or long puts). To stay delta-neutral, a long-gamma dealer must sell into rallies and buy into dips.
Walk the mechanics slowly, because this is the crux. Say a dealer is long a bunch of at-the-money calls. Price rises. Those calls gain delta — the dealer is now too long and must sell shares to get back to neutral. Price falls. The calls lose delta — the dealer is now too short and must buy shares back. Every move creates a hedge that leans the other way. The dealer is, mechanically, a fader.
Now multiply that across the whole market. When aggregate dealer positioning is long gamma, every rally gets sold into and every dip gets bought — by mechanical, price-insensitive flow. The result: volatility gets crushed, ranges compress, and price gets "pinned." This is your quiet, grinding, chop-sideways-all-day tape. Realized volatility comes in below what the options are pricing. Breakouts fail. Mean reversion works. Bollinger Bands squeeze. Your momentum indicators throw fake signal after fake signal because every move that looks like it's starting gets mechanically strangled in the crib.
Short gamma = the market that trends and gets violent
When dealers are short gamma, their hedging adds to the move. This happens when dealers are net short options — which is the common state, because the public loves to buy protection and lottery calls, leaving dealers short those options. A short-gamma dealer must buy into rallies and sell into dips.
Same mechanics, opposite sign. Dealer is short calls. Price rises. Those short calls gain delta against the dealer — they're now too short and must buy shares to neutralize. That buying pushes price higher, which makes them even shorter, which forces more buying. Price falls and they must sell, which pushes price lower, forcing more selling. The hedge chases the move instead of fading it. The dealer is, mechanically, a momentum trader — the worst kind, one who has to chase.
The result: volatility feeds on itself. Moves accelerate, gaps extend, dips become air pockets. This is your trend day, your violent flush, your "no bid" candle. Realized volatility blows past implied. Breakouts run. Fading gets you run over. Nearly every historically brutal single-day crash — 1987, the 2010 flash crash, the February 2018 volmageddon, the March 2020 waterfalls — happened with dealers deep in short-gamma territory. The selling-begets-selling loop is not a metaphor; it's the literal mechanism, and it's why those days feel physically different from a normal down day.
Same dealers. Same stock. The sign of their gamma position decides whether the market breathes gently or convulses.
A number that makes the two regimes concrete
Put dollars on it so it stops being abstract. Suppose SPX is at 5,000 and dealers are long $500M of gamma per 1%. The market ticks up 1% to 5,050. Dealers are now too long by roughly $500M of delta, so they sell about $500M of futures — leaning against the up-move, capping it. It ticks back down; they buy it back. The index rolls back and forth in a tight band and closes almost where it opened. That's a pin.
Now flip the sign. Same 5,000 print, but dealers are short $500M of gamma per 1%. The market ticks up 1%; dealers are now too short, so they buy $500M of futures — into the move, extending it toward 5,075, 5,100. That buying makes them even shorter, forcing more buying. A 1% headline gap becomes a 2.5% trend day by lunch. Nothing about the news changed between the two scenarios. Only the sign of the gamma changed, and the sign wrote the entire day.
The gamma flip: the line between the two worlds
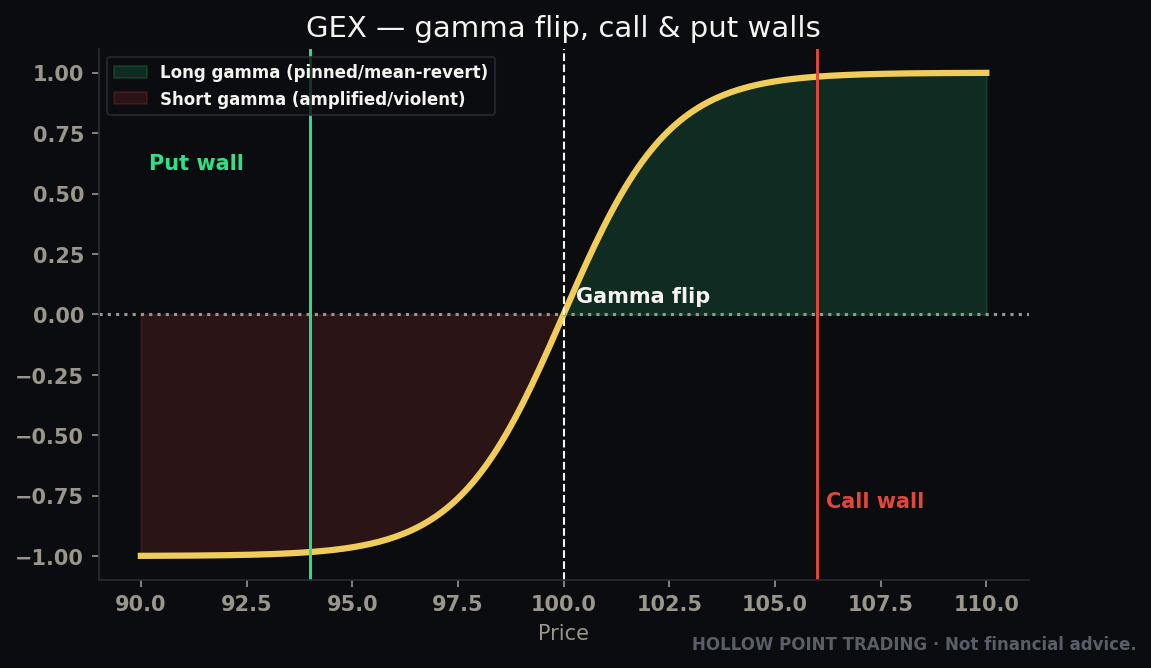
If long gamma is one regime and short gamma is the other, there has to be a price where the market crosses from one to the other. There is. It's called the gamma flip level (or zero-gamma level, or the gamma inversion), and it's the single most important number on a dealer-positioning board.
The gamma flip is the price at which aggregate dealer gamma exposure equals zero. Above it, dealers are net long gamma → suppressive, mean-reverting, pinned. Below it, dealers are net short gamma → amplifying, trending, violent.
This gives you a clean mental model you can use every session:
- Price above the flip: expect chop, fades, failed breakouts, buy-the-dip that quietly works. Sell strength, buy weakness, keep targets tight. The market is "heavy" in the sense that moves die.
- Price below the flip: expect trend, momentum, air pockets, and downside that begets more downside. Volatility expands. This is where you respect stops religiously and where breakout/breakdown trades pay.
- Price at the flip:* the battleground. This is often where the character of the day changes. Reclaiming the flip from below can flip a violent tape into a calm one; losing it from above can turn a sleepy grind into a waterfall.
Why the flip is the first question of every session
The flip is not static. It moves as positioning changes — as new options are opened, as old ones expire, as price migrates through strikes. But intraday it's stable enough to trade off of. The first question of the day is: where's the flip, and which side are we on? That one answer tells you whether to be a mean-reversion trader or a momentum trader today. Trading a breakout strategy above the flip is fighting the dealers. Fading rips below the flip is standing in front of a truck.
There's an asymmetry worth burning in: the flip is a floor of volatility, not a wall. Above it, volatility is mechanically suppressed, so it takes real, one-sided flow to punch below the flip — but once you do, the character change is fast and often nasty because the suppression that was holding the market together goes away all at once. That's why so many ugly days start with a quiet, boring morning that "shouldn't" have broken. The flip broke, the pin released, and the same dealers who were catching every dip an hour ago are now selling every bounce.
Distance to the flip is a risk gauge
Don't just read which side of the flip you're on — read how far. Price sitting 3% above the flip in deep long gamma is a very different animal from price hovering 0.2% above it. When price is pressed right up against the flip, you are one decent sell program away from a regime change, and you should size and stop accordingly. When price is miles above the flip, the pin is strong and stable and fading the walls is a high-confidence game. The flip isn't a binary; it's a dial, and distance to it is your volatility forecast.
Call walls and put walls: the magnets and the barriers
Zoom in from the whole curve to the individual strikes. Gamma isn't spread evenly — it clusters at strikes where enormous open interest sits. Those clusters create the levels HPT actually draws on the chart.
A call wall is the strike above current price with the largest concentration of (dealer-short) call gamma. A put wall is the strike below current price with the largest concentration of (dealer-short) put gamma. On a GEX board they show up as the tallest bars — a skyline of gamma by strike.
In a long-gamma / pinned regime, these walls behave as barriers and magnets:
- The call wall acts as resistance / a ceiling. As price approaches a big call-gamma strike, dealer hedging intensifies against further upside (they sell more into the rally to stay neutral). Price tends to stall there, and often gets pulled back toward the strike if it pokes above. The largest call wall is frequently the ceiling for the whole expiration cycle.
- The put wall acts as support / a floor. Big put-gamma below price means dealers buy into weakness as price approaches, absorbing the selling. Price tends to hold there. The largest put wall is often the line in the sand — lose it and the character changes fast.
- Between the walls, the strike with the highest total gamma acts as a pin — a magnet price gets drawn back to, especially into expiration.
The nuance that separates pros from tourists
The critical nuance: walls are only reliable while price is above the gamma flip (long-gamma regime). In that world, dealer hedging defends the walls — they're real support and resistance. Once price drops below the flip into short gamma, the walls stop absorbing and start accelerating. A put wall that would have held in a pinned tape becomes a trapdoor in a short-gamma tape, because now dealers are selling into the break instead of buying it. A wall is a barrier in long gamma and an accelerant in short gamma. Never read a wall without first checking which side of the flip you're on.
How walls behave when price attacks them
There's a difference between a wall repelling price and a wall breaking, and the reaction is your signal. When price grinds up into a call wall in long gamma, watch for the stall: volume dries up, the candles shrink, and price gets gently tractored back down. That's the wall working — fade it. But if price hits the same wall on a surge of real buying (a news pop, an index-driven rip), it can blow clean through, and here's the mechanical kicker: once price closes decisively above a big call wall, the dealers who were short that call gamma are now getting run, and their hedging can flip to chasing. A blown-out call wall sometimes becomes a launchpad rather than a ceiling — the "gamma squeeze" you hear about. The level didn't lie; the flow overwhelmed it, and the overwhelm itself created a new, faster move. Read whether price is rejected and pulled back (wall holding) or accepted above and accelerating (wall flipped to fuel).
Walls migrate — and thin walls lie
Two field notes. First, walls move as open interest changes. The call wall that capped Monday can be rolled up to a higher strike by Wednesday as traders take profit and re-position. Re-pull the board; don't trade Monday's wall on Thursday. Second, not every tall bar is a real wall. A wall built on genuine, sticky open interest (monthly and quarterly OI, index hedges) is structural and defends well. A wall built on a single day's 0DTE lottery flow is a paper wall — it looks tall on the board but evaporates at the bell. Weight walls by the type of open interest underneath them, not just their height.
Charm and vanna: why Fridays, OPEX, and the vanna rally are real
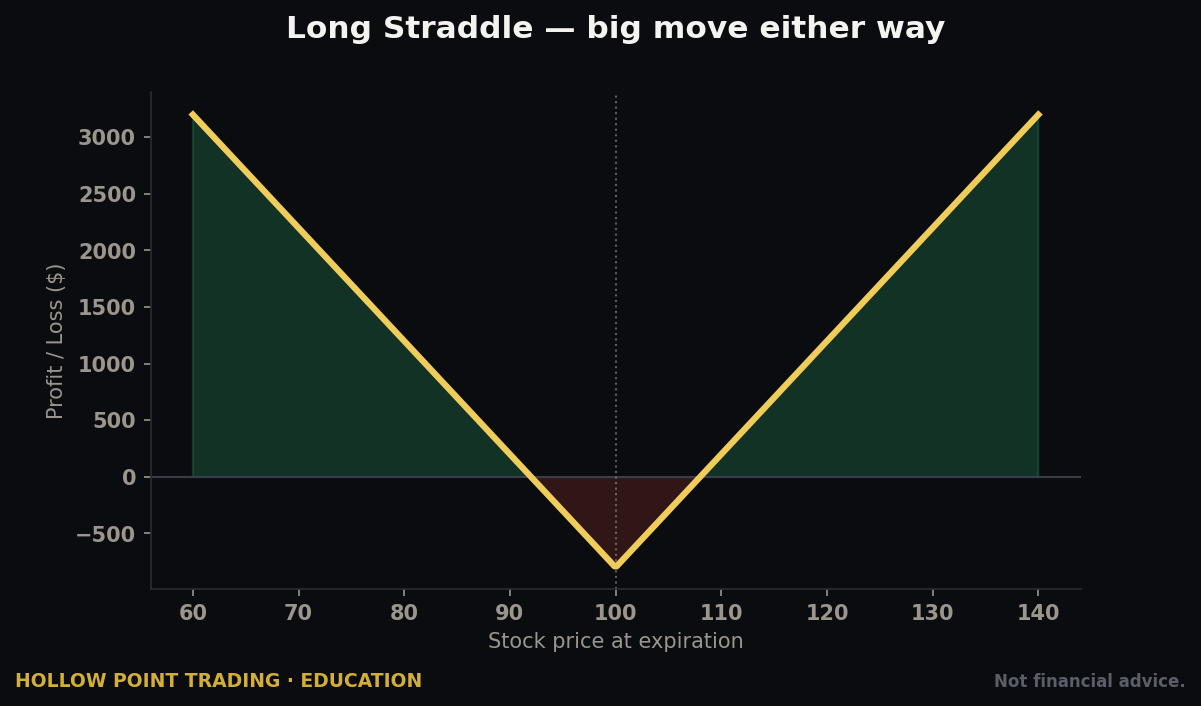
Delta and gamma explain most of it, but two second-order Greeks explain the calendar — why Fridays feel different, why monthly OPEX (options expiration, the third Friday) is a known inflection, and why markets sometimes float higher for no reason after a scare.
Charm: the clock pulls hedges off
Charm is the change in delta as time passes (delta decay). As expiration approaches, out-of-the-money options bleed delta toward zero and in-the-money options firm up toward full delta. This forces dealers to unwind hedges on a schedule tied purely to the clock, not to price. Into a Friday expiration, charm quietly pulls dealer hedges off, and that flow tends to reinforce pinning — price gets tractor-beamed to the big gamma strike as the options that were holding it there decay.
This is dealer pinning into expiry: the closer you get to the bell on expiration day, the harder price sticks to the max-gamma strike, because gamma there goes vertical and the smallest move forces an outsized hedge that pushes price right back. Stocks closing exactly on a round strike on OPEX Friday is charm and gamma doing their job. If you've ever watched a name close at 149.98 into a monster 150-strike on the third Friday and thought "that can't be a coincidence" — it isn't.
Vanna: falling fear is a mechanical bid
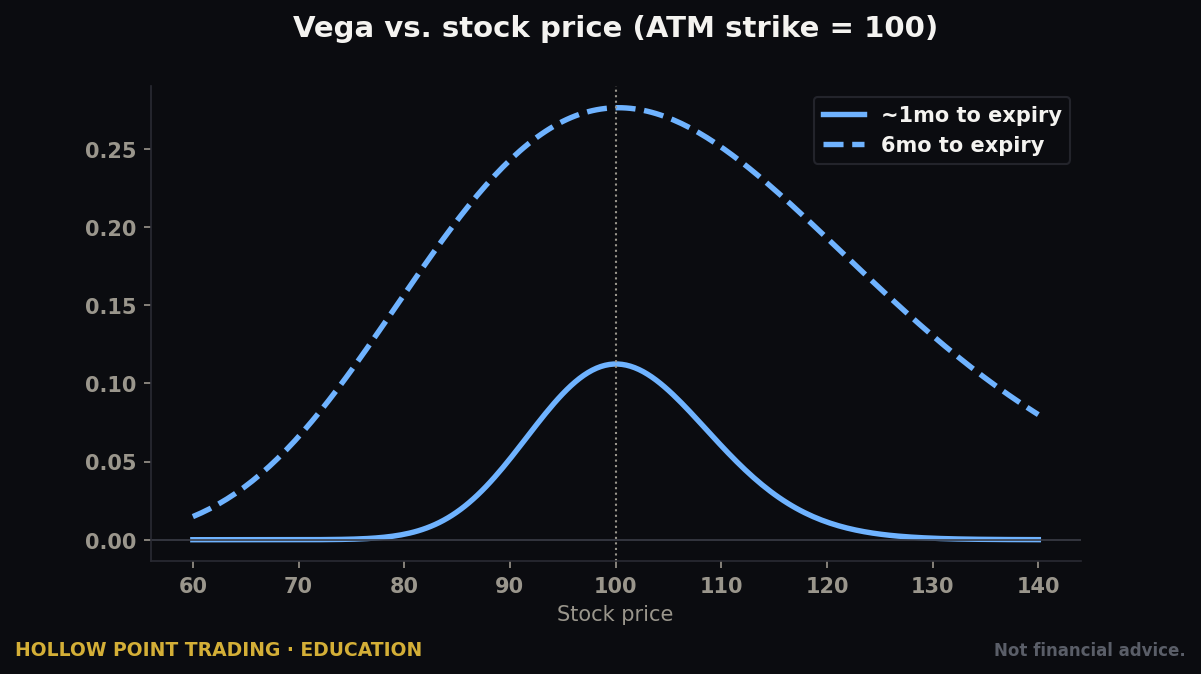
Vanna is the change in delta as implied volatility changes. This is the engine of the famous vanna rally. Picture a market that just sold off — implied volatility (the VIX) spiked because everyone bought puts. Dealers are short those puts and hedged by shorting the underlying. Now the panic fades and IV starts falling. As IV drops, the delta of those puts shrinks (that's vanna). The dealers' hedge is suddenly too short, so they buy back their short hedges — buying into a market that's already stabilizing.
Falling volatility mechanically forces dealers to buy, which lifts price, which calms things further, which drops vol more. That's the slow, grinding, everyone's-confused melt-up you often see in the days after a scare, and especially into and after monthly OPEX when a wave of protective puts expires and releases the hedges pinning the market down. It's not sentiment. It's vanna. The classic sequence: sharp sell-off Thursday–Friday, VIX pops into the 20s, market bottoms over a weekend, and then grinds relentlessly higher Monday–Wednesday on no obvious catalyst while every bear on the tape screams that it makes no sense. It makes perfect sense — vanna is buying and charm is releasing the pins.
The calendar is not neutral
The practical takeaway: OPEX week, the days after a vol spike, and the final hours of any Friday all carry predictable dealer-flow pressure. Knowing charm and vanna is knowing when the mechanical bid or offer shows up. A few dependable rhythms:
- Monthly OPEX (third Friday) is the big one — the largest chunk of open interest expires, which is why the days after it so often bring a regime shift. The gamma that was pinning the market rolls off, and price is suddenly free to move. Many trend legs start the Monday or Tuesday after monthly OPEX for exactly this reason.
- Quarterly OPEX / triple witching (March, June, September, December) is OPEX on steroids — index futures, index options, and single-stock options all expire together, and the un-pinning afterward is proportionally larger.
- Fridays in general carry a pinning bias into the close as weekly gamma decays.
- Post-holiday and end-of-month flows layer on top of this from systematic and passive rebalancing, which isn't gamma but often rhymes with it.

Multi-timeframe: which gamma matters for which trade
Gamma isn't one number; it's a stack of expirations, and each one governs a different timeframe of your trading. Reading them as if they were one blob is a rookie error.
- 0DTE / same-day gamma governs the next few hours. It's enormous, twitchy, and it dominates the intraday tape — but it evaporates at the bell. If you're scalping the 1m–5m, this is your regime, and it can flip the flip level intraday as the day's flow builds.
- Weekly gamma governs the current week — the pin and the walls that hold Monday through Friday. This is your swing-of-the-week framing.
- Monthly gamma governs the whole cycle and sets the structural flip that matters for position trades. This is the one that decides whether the environment is stable or fragile for weeks at a time.
The pro move is to line them up. When the 0DTE flip, the weekly flip, and the monthly flip all sit in the same zone, that zone is concrete — a genuine regime line across every timeframe. When they're scattered — monthly says you're deep in long gamma but a wave of same-day puts has dragged the 0DTE flip up right beneath price — you've got a fragile setup where the intraday tape can go short-gamma-violent for an afternoon inside a structurally calm month. That divergence is often exactly where the surprise air pockets come from: the daily traders think they're safe because the "board" (monthly) is bullish, and they get caught by the intraday flip.
Match the gamma to your holding period. A day trader who reads only the monthly board is blind to the flow that will actually move his 5-minute chart. A swing trader who trades off 0DTE noise is getting whipsawed by positioning that won't exist tomorrow. Read the layer that matches your trade, then check the layers around it for confirmation or conflict.

Gamma across market regimes: trend, chop, and high-vol
The same GEX board reads differently depending on the broader environment. Overlay the regime on the positioning.
In a grinding uptrend (low vol, long gamma)
This is the classic melt-up. The index is above its flip, dealers are long gamma, and every dip gets bought mechanically. Call walls get chewed through slowly as they roll higher week after week. The winning posture is: buy dips toward the put wall / prior-day structure, take profits into the call wall, don't chase, and don't fight the pin by shorting strength for anything more than a scalp. This is the environment where "buy the dip" is not a meme — it's dealers doing it for you.
In a range / chop (deep long gamma, price mid-structure)
Price is well above the flip and parked between a fat call wall and a fat put wall. This is a mean-reversion trader's paradise and a breakout trader's graveyard. The walls are your fade lines; the max-gamma pin is your magnet. Sell the call wall, buy the put wall, fade the extremes, keep targets inside the range, and treat every "breakout" as a fade-back candidate until the flip is actually threatened. The single biggest edge here is not trading the middle — you wait for price to reach a wall.
In high-vol / short gamma (below the flip)
Now the whole playbook inverts. Volatility is expanding, dealers are amplifying, and mean reversion is a good way to get run over. Walls are accelerants, not supports. You trade momentum: breakdowns below the put wall, continuation on strength, and you widen stops because a tight stop just donates you to the noise. Position size comes down even though the moves are bigger, because the whip is brutal. In deep short gamma the correct default is "trend until proven otherwise," and the proof is a reclaim of the flip.
The transition days are where careers are made and ended
The dangerous days are the ones where regime changes mid-session. A quiet long-gamma morning that loses the flip at 11am and turns into a short-gamma waterfall by 2pm will destroy anyone who keeps fading dips like it's still a pin day. The tell is always the flip. When price is coiling right at the flip after a calm morning, stop trading the range and start watching for the break — because the moment it goes, your entire ruleset flips with it.
Worked example 1: reading one board, start to finish
Let's make it concrete with round numbers. Say it's Wednesday, you're looking at a stock — call it XYZ — trading at $498, and the dealer-positioning board shows:
- Gamma flip: $495
- Largest put wall: $490 (biggest negative/put gamma bar)
- Highest total gamma strike: $500 (the tallest bar on the board)
- Largest call wall: $505 (biggest call gamma bar above)
- Net GEX: positive and large
Read it top-down. Price ($498) is above the flip ($495) → we're in long gamma. Regime call: mean-reverting, pinned, fade the extremes, expect a range. Now the levels resolve into a plan:
- $505 call wall = the ceiling. Rallies into it should stall; a poke above likely gets sold back.
- $490 put wall = the floor. Dips into it should get bought.
- $500 = the pin/magnet. With price at $498 and the biggest gamma bar at $500, expect price to gravitate toward $500 and chop around it, especially as the week wears toward Friday.
So the day's playbook writes itself: range is roughly $490–$505, magnet at $500, and $495 is the trapdoor. A long near $490 targeting $500/$505 with a stop just under $490 is a clean, dealer-aligned, high-R trade. Fading $505 back toward $500 is the mirror. Both respect the regime. Run the R math: entry $490.50, stop $489.00 (risk $1.50), first target $500 (reward $9.50). That's better than 6:1 to the pin alone — the kind of asymmetry the regime hands you when you trade with the mechanical flow instead of against it.
Now the if. If XYZ loses $495, the entire read inverts. Below the flip, dealers go short gamma. The $490 put wall stops being a floor and becomes an accelerant — instead of absorbing the dip, dealer selling now feeds it. That's your signal to drop mean-reversion entirely, flip to momentum, and treat $490 as a breakdown level rather than support. Same board, opposite behavior, and the flip level told you exactly where the switch is.
That's the whole discipline in one example: regime first (which side of the flip), levels second (walls and pin), invalidation third (the flip is the line that changes the story).
Worked example 2: a short-gamma breakdown day
Now the other regime, because trading it is a completely different sport. It's a Thursday, the broad market gapped down on a hot inflation print, and your name — call it ABC — opens at $212. The board:
- Gamma flip: $215 (price is below it)
- Largest put wall: $205
- Highest total gamma strike: $210
- Largest call wall: $220
- Net GEX: negative
First question answered instantly: price ($212) is below the flip ($215) → short gamma. Everything you know about walls-as-support is suspended. Regime call: momentum, air pockets, respect stops, size down.
Here's how the tourist blows up: they see the $210 max-gamma strike and the $205 put wall and think "big support just below, I'll buy the dip." Wrong regime. In short gamma, as price slides toward $210 and then $205, dealers are selling into it to stay hedged. The put wall doesn't catch — it's where the selling gets worse. Price knifes from $210 to $205, pauses for ninety seconds as bargain-hunters step in, then the dealer hedging overwhelms them and $205 gives way to $201 in eight minutes.
The pro trades it the other direction: short the loss of $210 (the pin failing in short gamma is a momentum signal, not a bounce signal), target $205 then $201, stop back above $210. And the pro watches one number for the exit — the flip at $215. If a midday bounce reclaims $215, short gamma is over, the character flips to pinned, and it's time to be flat or flip long. Until then, every bounce is a sell. Same four levels as example 1, read through the opposite regime, producing the opposite plan.
Worked example 3: the OPEX pin, hour by hour
One more, because the calendar edge is worth a full walk-through. It's monthly OPEX Friday. SPX opened at 5,043. The board shows a colossal gamma concentration at the 5,050 strike, the flip sitting well below at 4,990, and net GEX deeply positive. This is textbook pin setup: giant gamma strike just overhead, price well above the flip, expiration in a few hours.
- 9:30–11:00: price wanders between 5,038 and 5,048. Every push toward 5,050 stalls; every dip toward 5,035 gets bought. Ranges are already tight because gamma at 5,050 is huge and getting huger as time decays.
- 11:00–14:00: the band compresses further — now 5,046 to 5,052. Charm is quietly pulling dealer hedges off, and the pin tightens. This is the deadest part of the day, and it's dead by mechanism, not by accident.
- 14:00–15:30: gamma at 5,050 has gone nearly vertical. Any move of even a couple points forces an outsized hedge that snaps price right back to 5,050. Price is now essentially glued within a point or two of the strike.
- 15:30–16:00: the magnet wins. SPX prints 5,049.80 into the bell.
How you trade it: fade the extremes of the tightening band toward 5,050, take profits fast, and reduce activity as the band compresses — there's no range left to trade by mid-afternoon, so the edge is in the late-morning fades, not the dead-flat afternoon. And the real money is often the next session: once 5,050's gamma expires at the close, the pin is gone. The following Monday, SPX is free to move, and if there's any directional flow behind it, the un-pinning can produce a clean trend day. Trade the pin Friday; trade the release Monday.
How HPT actually uses this
We don't trade GEX as a standalone system. We fold it into timeframe-weighted confluence, and it earns its keep by doing three jobs.
1. Regime filter — it sets the game. Before any setup, we ask which side of the gamma flip price is on. Above the flip we favor mean-reversion, fades at walls, tight targets, and we distrust breakouts. Below the flip we favor momentum, breakdowns, trend continuation, and we widen our expectations for range. The same chart pattern gets traded differently depending on the regime, because the dealer flow behind it is different. A bull flag above the flip is a fade-the-breakout-back-into-the-flag setup; the same bull flag below the flip is a buy-the-breakout continuation. The pattern didn't change — the flow behind it did.
2. Levels — walls become drawn confluence. Call walls, put walls, the flip, and the max-gamma pin get drawn on the chart right alongside our technical levels — the 55-EMA, VWAP, prior day high/low, session levels. When a put wall lines up with the daily 55-EMA and yesterday's low, that's not three signals, that's three independent reasons one price matters, and it's exactly the kind of stacked confluence that earns size. A wall sitting alone in no-man's-land is weaker; a wall that overlaps structure is a level we'll defend.
3. Risk and expiry timing. Short-gamma regimes get wider stops and full respect for stop discipline, because air pockets are real and a tight stop just donates you to the acceleration. Pinned long-gamma regimes get tighter targets, because the magnet caps how far a move runs — chasing a breakout that the dealers are mechanically capping is how you give back a good entry. And into OPEX Friday we lean on the pin: fading extremes back toward the max-gamma strike is a real edge, right up until the flip breaks.
GEX never overrides the macro→sector→stock top-down or the 1:3 R/R minimum. It's a lens that tells us whether the tape will fade or trend, and where the mechanical buyers and sellers are hiding. That's a genuine edge, but it's one input in a stack, never a crystal ball.
Confluence in practice: three tools stacked on the gamma board
The whole point of HPT is that no single tool trades alone. Here's how GEX compounds with the rest of the kit.
GEX + the 55-EMA (trend bias). The daily EMA 12/22/55 framework tells you the structural trend; GEX tells you the mechanical environment. When they agree — price above the daily 55-EMA (bullish structure) and above the gamma flip (long-gamma, dip-buying environment) — dips toward the put wall are a high-conviction long, because both your trend read and the dealer flow point the same way. When they disagree — price above the 55-EMA but below the flip — you've got a bullish chart in a short-gamma tape, which means real downside air pockets inside an uptrend. That's a "trade smaller, respect stops, don't add on weakness" flag. The disagreement is information, not noise.
GEX + VWAP and volume profile. VWAP is where the average participant is positioned; the max-gamma pin is where dealers are forced to defend. When the pin sits right on VWAP and the volume-profile POC, that price is a triple-anchored magnet — the single most likely place price closes and the highest-probability fade target on a pin day. When the pin sits away from VWAP, there's tension: price wants to revert to VWAP but is being tractored toward the gamma strike, and that tug-of-war often produces the day's cleanest range to trade between the two.
GEX + RSI/MACD divergence. Momentum oscillators fire constant false signals in a pinned long-gamma tape because every move that "should" follow through gets strangled by dealer hedging. Knowing you're in long gamma tells you to fade those RSI extremes rather than trust them — an overbought RSI into the call wall in long gamma is a gift, not a warning. Below the flip, the opposite: an RSI divergence that would mean-revert in a pin can get steamrolled by short-gamma momentum, so you demote it. GEX is the filter that tells your other indicators whether to be trusted or faded.
The rule underneath all of this: GEX doesn't replace your technicals; it tells you how to interpret them. Same RSI reading, same flag, same VWAP tag — the regime decides what they mean.
How the pros use it differently from beginners
Same board, completely different reads. The gap is instructive.
Beginners read walls as fixed support and resistance. Pros read them through the flip. A novice sees a put wall and buys it, every time, regardless of regime. A pro checks which side of the flip price is on first, and knows that same put wall is a floor in long gamma and a trapdoor in short gamma. The flip is the pro's first glance; the walls are the beginner's.
Beginners treat GEX as a prediction. Pros treat it as conditioning. The novice thinks the board tells them where price is going. It doesn't. It tells them the character of the move and where the mechanical flow sits. Pros still get direction from macro, structure, and setup — GEX just tells them whether to expect that direction to grind or to rip.
Beginners read one number. Pros read the stack. A novice pulls up "the GEX level." A pro reads the 0DTE, weekly, and monthly layers, checks whether they agree, notes the distance to the flip as a volatility gauge, and weights walls by the type of open interest underneath them. The beginner sees a snapshot; the pro sees a structure with a term structure.
Beginners trade the middle. Pros wait for the wall. In a pinned range, the edge is entirely at the extremes — at the walls where dealer hedging is strongest and most predictable. Novices trade all day, chopping themselves to death in the middle where there's no edge. Pros sit on their hands until price reaches a wall or the pin, then act.
Beginners ignore the calendar. Pros trade it. The novice treats every day the same. The pro knows OPEX Friday pins, knows the days after monthly OPEX un-pin, knows vanna lifts markets after a vol spike, and positions for the mechanical flow before it shows up rather than getting surprised by it.
Beginners ignore index gamma. Pros start there. A novice reads a single stock's board in isolation. A pro checks the SPX/SPY regime first, because index gamma sets the weather for everything correlated. A bullish single-name board inside a short-gamma index is a trap, and the pro sees it coming because they read top-down.
Beginners size the same regardless. Pros size to the regime. Long gamma, tight range, high-probability fades → size up, tight targets. Short gamma, air pockets, whippy → size down even though the moves are bigger, because the whip will stop you out of a right idea. The pro's size is a function of the regime; the beginner's size is a function of their mood.
Common mistakes
1. Treating walls as hard lines. Walls are zones of concentrated hedging, not force fields. Price pierces them all the time — the tell is whether it gets pulled back (long gamma holding) or accelerates through (short gamma, or the wall got blown out by real flow). Read the reaction, not just the level.
2. Ignoring the flip and trading walls blind. The number one error. A put wall is support above the flip and a trapdoor below it. If you're fading dips into a put wall while price is in short gamma, you're standing in front of the exact mechanism that's about to accelerate the selling. Always check the regime before you trust a wall.
3. Using stale data. Positioning changes as options are opened, closed, and expire. A board from yesterday's close can be meaningfully wrong by midday, especially around big flow or a vol spike. Same-day, intraday-refreshed data or it's a rough guide at best. The single fastest way to get hurt is trading Monday's walls on Thursday.
4. Confusing 0DTE noise with structural positioning. Zero-days-to-expiration options create enormous, twitchy intraday gamma that can dominate the tape for an hour and then vanish at the bell. That's different from the standing monthly positioning that frames the whole week. Know which one you're reading, and don't build a swing thesis on gamma that won't exist tomorrow.
5. Forgetting index gamma drives your single stock. SPX/SPY gamma sets the environment for everything correlated. A stock can have a bullish-looking board and still get dragged around because the index is deep in short gamma. Top-down applies here too — check the index regime before you trust the single-name read.
6. Treating GEX as prediction instead of conditioning. It doesn't tell you direction. It tells you the character of the move and where the mechanical flow sits. Direction still comes from your macro, your structure, your setup. GEX conditions the trade; it doesn't call it.
7. Trusting the sign when the dealer-position assumption is wrong. Published GEX assumes dealers are short the options the public bought. In unusual flow — big institutional call buying, dealers net long a strike — the sign can invert and the board lies. When price behaves the opposite of what the board says (accelerating where it "should" pin, pinning where it "should" run), suspect the positioning assumption, not your eyes. Believe the tape over the model.
8. Fading in short gamma. Bears repeating as its own mistake because it kills accounts. Below the flip, mean reversion is suicide. Every instinct that worked in the pinned tape — buy the dip, sell the rip, fade the extreme — gets you run over when dealers are amplifying instead of absorbing. The regime dictates the style, and using the wrong style is worse than having no read at all.
9. Chasing breakouts in long gamma. The mirror error. Above the flip, breakouts are mechanically capped by dealer selling into strength. Chasing a breakout that the dealers are strangling is how you buy the exact high before the fade back to the pin. In long gamma, breakouts are fade candidates until the flip or a major wall actually gives way.
10. Ignoring the distance to the flip. Which side of the flip is only half the read; how far is the other half. Pressed right against the flip means one program away from a regime change — trade small. Miles from the flip means the regime is stable and you can lean on it. Traders who read the binary but not the distance get blindsided by the transition days.
11. Over-trusting a paper wall. A tall bar built on one day's lottery-ticket 0DTE flow is not the same as a wall built on sticky monthly and index open interest. The paper wall looks identical on the board and defends nothing. Weight walls by the quality of the OI underneath, not just their height.
12. Trading the middle of the range. In a pinned tape the edge lives at the walls and the pin, not in the churn between them. Traders who feel compelled to be in a position all day bleed out in the middle where there's no mechanical edge, then miss the clean fade at the wall because they're already stopped out and tilted. Patience is the strategy in long gamma.

FAQ
Where do I actually get GEX data? From a dealer-positioning provider or GEX terminal that aggregates options open interest and models the dealer hedging — that's the input to your read. HPT pulls it into the confluence board alongside the technicals. What matters more than the source is that it's same-day and intraday-refreshed; a stale board is worse than none because it gives false confidence.
Does GEX work on any ticker? Best on liquid names with deep, active options — the large-cap index ETFs and the mega-cap single names. On a thin name with sparse open interest, the "walls" are just a handful of contracts and the read is noise. No options liquidity, no dealer hedging worth reading, no edge. Rule of thumb: if the options aren't heavily traded, don't lean on the gamma board.
Is the gamma flip the same as a support level? No, and conflating them is a classic mistake. Support is a price where buyers have historically stepped in. The flip is a price where the entire character of dealer hedging inverts — from stabilizing to amplifying. It can coincide with a support level, and when it does that's powerful confluence, but the flip is about volatility regime, not about buyers defending a price.
Can retail flow really move the walls, or is it all institutions? Both. The structural walls are built largely on institutional and index hedging open interest. But aggregated retail flow — especially 0DTE lottery buying — can build real, if temporary, intraday gamma that moves the near-dated flip and pins for an afternoon. That's why the 0DTE layer matters for day traders even though it's mostly retail-driven.
What's a gamma squeeze, exactly? It's the short-gamma acceleration loop running to the upside through a call wall. Heavy call buying forces dealers to buy stock to hedge; that buying lifts price; higher price means the calls gain delta, forcing more dealer buying; the loop feeds itself and price rockets. It's the same mechanism as a short-gamma crash, just pointed up and usually triggered by a wall breaking on real demand.
How does GEX interact with earnings? Around earnings, implied vol is elevated (the event premium) and positioning is often unusual. After the print, IV collapses — a vol crush — and that vanna effect forces dealer hedging that can extend or dampen the post-earnings move. The board right before earnings is less reliable because so much positioning is event-driven and about to reset; give it less weight into the print and re-read it the morning after.
Should GEX ever override my technical setup? No. It's a conditioning lens, never a trigger. It tells you whether to expect your setup to grind or rip and where the mechanical flow sits. The entry, the stop, the target, and the 1:3 minimum still come from your structure and your rules. A great GEX read on a setup that isn't there is not a trade.
Why did price ignore a huge wall today? Usually one of three things: you were below the flip and the wall was an accelerant not a barrier; the wall was a paper wall built on flow that already expired; or real, one-sided flow simply overwhelmed the hedging and blew the level out, potentially flipping it into a squeeze. Read the reaction — pulled back means the wall held, accelerated through means it didn't, and either outcome tells you what regime you're really in.
The cheat-sheet
The two regimes:
- Long gamma (price ABOVE flip): dealers sell rallies, buy dips → volatility crushed, mean-reverting, pinned. Fade extremes, tight targets, distrust breakouts, size up on high-probability wall fades.
- Short gamma (price BELOW flip): dealers buy rallies, sell dips → volatility amplified, trending, violent. Trade momentum, respect stops, expect air pockets, size down.
The levels, in order:
- Gamma flip — the line between the two regimes. First thing you check. Which side are we on, and how far?
- Call wall — biggest call-gamma strike above price. Ceiling/resistance in long gamma; a blown-out call wall can flip to a launchpad (gamma squeeze).
- Put wall — biggest put-gamma strike below price. Floor/support in long gamma; trapdoor/accelerant in short gamma.
- Max-gamma strike — the pin. Magnet price gravitates to, hardest into expiry.
The timeframe stack:
- 0DTE → next few hours (scalps); evaporates at the bell.
- Weekly → the current week's pin and walls (swings).
- Monthly → the structural regime for weeks (positions). Line them up; divergence = fragility.
The calendar:
- Charm decays delta as time passes → reinforces the pin into Friday/OPEX.
- Vanna ties delta to IV → falling vol forces dealer buying → the vanna rally after a scare and into/after OPEX.
- OPEX Friday = strongest pinning; the days after monthly/quarterly OPEX = the un-pinning, where trends start. The flip breaking is what ends the pin.
The confluence stack:
- + 55-EMA: agree = high conviction; disagree = air pockets inside a trend, trade smaller.
- + VWAP/POC: pin on VWAP = triple-anchored magnet; pin off VWAP = tug-of-war range to trade.
- + RSI/MACD: long gamma → fade the oscillator extremes; short gamma → demote mean-reversion signals.
Regime playbook:
- Uptrend / low-vol long gamma: buy dips to the put wall, sell into the call wall, don't chase.
- Range / deep long gamma: fade the walls, target the pin, don't trade the middle.
- High-vol / short gamma: trade breakdowns, momentum only, wide stops, small size, watch for the flip reclaim.
- Transition day: price coiling at the flip after a calm morning = stop fading, watch for the break.
The one-line discipline: Regime first (which side of the flip, and how far), levels second (walls and pin as confluence), invalidation third (the flip is the story-changer). GEX conditions the trade — it never calls the direction alone.

Read the flip. Respect the regime. Draw the walls where they overlap your structure. Let the dealers' forced hand show you where the mechanical buyers and sellers are — then trade your setup, with your rules, at 1:3 or better.
Bound by rules, feared by trade.