
You've read the pieces on regime. On sector rotation. On EMAs, on the golden pocket, on VWAP, on volume nodes, on sizing off the stop. Each one taught a tool. This is the piece where the tools stop being a toolbox and become a trade.
Because here's the thing nobody tells the new-ish trader: you don't get paid for knowing what a golden pocket is. You get paid for the moment three or four of these ideas point at the same price at the same time, you press the button with the right size, and then you have the discipline to trim into strength and honor the stop instead of hoping. That stacking is called confluence, and it is the entire game.
Let me define the word once and then never re-explain it: confluence is when multiple independent reasons to act line up at one level. Not four flavors of the same reason — four different reasons. A moving average, a Fibonacci level, a volume shelf, and a session VWAP all landing at 214.50 is confluence. Four different oscillators all saying "oversold" is one reason wearing four hats. That distinction will save your account, and by the end of this piece you'll be able to tell the two apart in your sleep.
We're going to build one trade end to end. Top-down, the way Hollow Point does it: macro regime → sector/theme → the instrument → the technical setup → the expression (option or future) → the size → the plan → the management. I'll use one worked example the whole way through with real numbers so you can see how each layer either adds weight or kills the idea, and then I'll run the same machine through two other market regimes so you see how the answer changes when the weather changes. Numbers are illustrative — the method is the lesson.
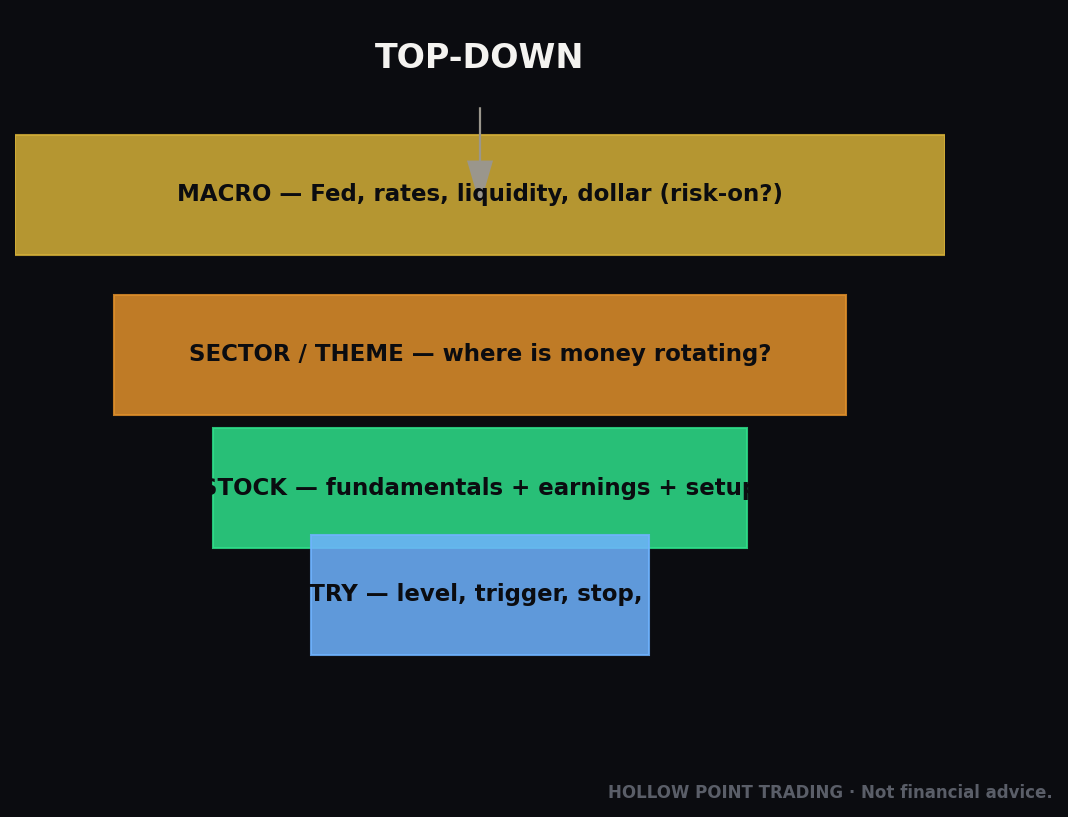
The core concept: a trade is a stack, not a signal
A signal is a single fact. "RSI is oversold." "Price tapped the 50 EMA." "There's a bullish engulfing candle." Any one of these, alone, is a coin flip with commissions. The market generates hundreds of these a day and most of them are noise. If you traded every one you'd be broke by lunch not because the signals are wrong but because they're unfiltered — you'd be taking the good ones and the garbage ones at the same size with the same conviction.
A trade is what you have when enough independent signals converge that the odds tilt from a coin flip to something you'd bet real money on — and, critically, where the price that proves you wrong is close enough that you can risk a small, defined amount to make a much larger one.
That last clause is the HPT non-negotiable: 1:3 minimum reward-to-risk. If you're risking a dollar you want to be playing for at least three. This isn't a preference; it's what lets you be wrong more than half the time and still print money.
Why 1:3 is not arbitrary
Run the arithmetic, because it's the whole reason the rule exists. Say you take 100 trades, each risking 1 unit to make 3. You win only 40 of them and lose 60:
- Wins: 40 × 3 = +120 units
- Losses: 60 × 1 = −60 units
- Net: +60 units over 100 trades, at a losing win rate.
Now flip it to a 1:1 payoff at the same 40% hit rate:
- Wins: 40 × 1 = +40
- Losses: 60 × 1 = −60
- Net: −20 units. Same reads, same win rate, and now you're bleeding.
The payoff ratio is doing more work than your accuracy. This is why professionals obsess over R-multiples and amateurs obsess over win rate. A 40% shooter with 1:3 discipline eats a 60% shooter with 1:1 discipline every single month. Internalize that and half the emotional noise of trading goes quiet, because you stop needing to be right.

The two jobs
So the whole method has exactly two jobs:
- Find the level where the most independent evidence converges.
- Only pull the trigger when the invalidation is close enough to give you 3:1 or better.
Everything below serves those two jobs. Confluence answers job one — where. Reward-to-risk answers job two — whether it's worth it. A gorgeous five-confluence level with a stop so far away that the target is only 1.4R is not a trade. A modest level with a razor-tight invalidation that pays 5R might be. Keep both jobs in your head at once; most traders only ever do the first one and wonder why they're flat.
The mechanism: top-down, because context sets the odds
Why start at macro when the trade is a 15-minute chart on a single stock? Because the same technical setup has completely different odds depending on the weather above it. A textbook long at a golden pocket is a high-probability trade when the broad market is trending up and money is flowing into that sector. The identical chart is a trap when the index is bleeding and the sector is the market's punching bag.
Top-down analysis is just stacking the odds before you ever look at the entry candle. Each layer up is a filter. You want every layer pointing the same direction so that when you finally zoom into the 15-minute chart, the wind is at your back. When the layers disagree — macro up, sector down, stock coiled — you either pass or you size way down. Disagreement is information too, and one of the most valuable skills you'll build is learning to read the disagreement rather than ignoring it.
The four layers, top to bottom:
- Macro regime — what is the whole market doing and in what environment?
- Sector / theme — is money rotating into or out of this corner?
- The instrument — is this specific name strong or weak versus its own group?
- The technical setup — where exactly do I get in, and where am I wrong?
Think of it as four coins that all need to land heads. Any single heads is a maybe. Four heads is a trade. Three heads and one tails is a smaller trade or a pass. Four tails pointed the other direction is a short setup — the machine runs identically in reverse. Let's walk them.
Step 1 — Macro regime check
The question: Is the environment risk-on or risk-off, trending or chopping, calm or panicking?
You don't need a PhD here. You need a handful of tells:
- The index trend. Is the S&P 500 (SPX / ES futures) above or below its rising 50-day and 200-day EMAs? Above and rising = tailwind for longs. Below and falling = every long is fighting the current.
- Volatility. Where's the VIX? Roughly under 15 is complacent-calm, 15–20 is normal, 20+ is getting jumpy, 30+ is fear. Rising VIX means wider swings and faster stop-outs — you size down when vol is high.
- The dollar and yields. A ripping US dollar (DXY) and spiking yields are headwinds for growth and tech. Falling yields tend to let risk assets breathe.
- Breadth. Are most stocks participating, or is the index being carried by five names? Broad participation confirms a trend; narrow leadership is fragile.
The three regimes you're actually classifying
Every one of those tells is feeding a single decision: which of three weathers are we in?
- Trend (up or down). Directional, orderly, pullbacks get bought (or rallies get sold). The index rides its rising or falling EMAs. This is where the method shines — buy pullbacks in an uptrend, sell rallies in a downtrend, full size.
- Chop / range. The index oscillates between a ceiling and a floor with no net progress, EMAs flatten and tangle, VIX is middling. Pullback-buying at "support" works right up until it doesn't, because there's no trend to resume. In chop you fade the edges of the range and take profits fast — the middle is a no-fly zone.
- High-vol / panic. VIX 30+, gaps everywhere, correlations go to 1 (everything moves together, so your beautiful stock-specific read stops mattering). Stops get run on noise alone. You size down hard or stand aside. This is not the environment to be a hero.
The single most common way traders lose money with a correct setup is running a trend-following playbook in a chop regime. The golden pocket long that's automatic in a trend is a 50/50 in a range, because in a range price is just as likely to keep grinding to the other side of the box as it is to bounce off your level.

Worked example. It's a Tuesday. ES is holding above a rising 50-day EMA, higher highs and higher lows on the daily. VIX is 14.5 and flat. DXY is soft, yields are easing. Breadth is healthy — most sectors green on the week.
Read: risk-on, trending up, calm. This environment rewards buying pullbacks. Longs get the green light at the macro layer. That's one point on the board before we've even picked a stock.
If instead VIX were 28 and rising with ES under a falling 50-day, we'd flip the whole exercise to hunting shorts, or stand down. Macro doesn't pick the trade — it picks the direction you're allowed to hunt in.
A word on multi-timeframe alignment inside the macro read
Macro isn't one chart, it's a nested set. The daily index trend sets your bias. The 1-hour index tells you whether you're aligned or fighting an intraday counter-move within that bias. When the daily is up and the 1-hour is also pulling back into support, that's your green light stacking on itself — the higher timeframe trend and the lower timeframe pullback agree. When the daily is up but the 1-hour just broke down through its own structure, the market is telling you the pullback isn't done; you wait. Higher timeframe sets direction, lower timeframe sets timing. Never let a 5-minute chart argue you out of a daily trend, and never let a daily trend bully you into a long while the hourly is actively bleeding.
Step 2 — Sector / theme
The question: Within a green market, where is the money actually going?
Not all boats rise equally. In any given month a few sectors lead and a few lag. You want to be shopping in the leading aisle. The quick tool is relative strength: pull up the sector ETF (say XLK for tech, XLE for energy, XLF for financials) and compare its performance to the S&P over the last few weeks. Leading the index = money rotating in. Lagging = money leaving, and you do not want to be long a name whose whole neighborhood is being sold.
How to actually measure relative strength
There are three levels of rigor and you should know all three:
- Eyeball the ratio. Put the sector ETF and SPX on the same normalized chart over 20–60 days. If the sector line is above the index line and the gap is widening, it's leading. Fastest, least precise.
- The ratio chart. Chart XLK/SPX directly as its own symbol. A rising ratio line means tech is outperforming, full stop, regardless of whether the market is up or down. This is the cleanest single view of rotation and it's what the desks watch.
- Rolling relative performance. Compare the sector's percentage move to the index's over matched windows — 1 week, 3 weeks, 3 months. You want consistency across windows. A sector that's up 6% over three weeks but was flat the two weeks before that is early; a sector leading across all three windows is an established theme.

Worked example. Semiconductors are leading. The semi ETF (SMH) is up 6% over three weeks while SPX is up 2% — it's outperforming, making higher highs, holding above its own rising EMAs. The XLK/SPX ratio has been climbing for a month. There's a live theme behind it: AI capex demand, a strong earnings print from a bellwether last week that the market rewarded.
Read: the theme is real, money is flowing in, the group is strong. Second point on the board. Now we go find the strongest name in the strongest group pulling back to a buyable level — that's the highest-odds long there is.
Themes versus sectors
A sector is a bucket (technology, energy, financials). A theme is the story driving money into part of a bucket — AI infrastructure, GLP-1 weight-loss drugs, uranium, onshoring. Themes cut across sectors and often lead them. The edge in noticing a theme early is that relative strength shows up in the theme's names before the sector ETF confirms it, because the ETF is diluted by laggards. When you can name the theme, you can shop for the purest expression of it rather than the average one.
Step 3 — The instrument
The question: Is this specific name a leader or a laggard inside its own strong group?
Same relative-strength logic, one level down. Inside leading semis, which name is strongest? You want the stock that's outperforming its own sector — when the group dips, it dips least; when the group rips, it makes new highs first. That behavior tells you institutions are accumulating it.
Worked example. Call the stock NVX (a stand-in — use the method on real tickers). Over the last month NVX is up 11% while SMH is up 6%: it's beating its own sector, which is beating the market. It just had a clean earnings beat, gapped up, and — importantly — has spent the last week digesting that gap with a tidy, controlled pullback rather than giving it all back. Controlled pullback after a strong move is exactly what accumulation looks like.
Read: strongest name, strongest group, strongest market. Three layers aligned. Third point on the board. Now — and only now — do we zoom into the chart to find the entry.
What "controlled pullback" actually looks like
Not all pullbacks are equal, and this is where you separate accumulation from distribution:
- Controlled (buyable): shallow, orderly bars, declining volume on the pullback, holds above the rising short EMA, carves higher lows on the lower timeframe. Sellers are just taking profits; buyers keep stepping under it.
- Distributive (dangerous): deep, fast, rising volume on the down days, slices the short EMA, breaks the prior swing low. That's not digestion, that's the smart money leaving. The chart still "dipped," but the character is completely different.
Volume is the tell that separates them. A pullback on falling volume is the market catching its breath. A pullback on rising volume is the market changing its mind. Read the volume, not just the price.

Notice what we did: we haven't drawn a single fib yet, and we already know we're hunting a long in NVX because the top-down stack demands it. The technicals below aren't there to decide direction. They're there to decide price and size.
Step 4 — The technical setup: stacking confluence at one level
This is where the series' chart tools come together. We're looking for one price where the maximum number of independent technical reasons converge. Let me define each tool in one line, then stack them.
- Structure — the pattern of highs and lows. An uptrend is higher highs (HH) and higher lows (HL). We want to buy a pullback into a higher low, not catch a falling knife.
- EMA stack — exponential moving averages that weight recent price. HPT uses 12 / 22 / 55. When they're stacked in order (12 above 22 above 55) and all rising, the trend is healthy. Price pulling back into a rising EMA is a classic buy zone.
- Fibonacci golden pocket — measure a fib retracement from the low to the high of the last impulse leg up. The zone between the 0.618 and 0.65 retracement is the "golden pocket," where controlled pullbacks in strong trends tend to find buyers.
- VWAP — Volume-Weighted Average Price, the average price weighted by volume. Anchored VWAP starts the calculation from a meaningful event (here, the earnings gap). Institutions benchmark to it; price reclaiming or holding an anchored VWAP is a strong tell.
- Volume node / POC — from the volume profile, the Point of Control (POC) is the price where the most volume has traded — a shelf of agreement, a magnet, and often support on the way back down.
Why "independent" is the load-bearing word
The reason confluence works is probabilistic. Each tool has some individual edge — say each is right 55% of the time on its own. If they were all measuring the same thing, stacking five wouldn't improve anything; you'd just have one 55% signal quoted five times. But because a fib level (geometry of the last swing), an EMA (a rolling average of price), a VWAP (a volume-weighted benchmark), a volume POC (where shares actually changed hands), and structure (the pattern of swings) are computed from different inputs, their errors aren't perfectly correlated. When five semi-independent edges point at the same price, the combined probability that price respects that level is meaningfully higher than any one alone. That's the whole mathematical justification for confluence — and it's exactly why four oscillators don't count. Correlated inputs don't compound; independent ones do.
Now the worked setup. NVX ran from 200 to 220 on the earnings gap (that's our impulse leg). It's been pulling back for a week. Let's measure the confluence at the pullback zone:
- Fib golden pocket: 0.618 of the 200→220 leg sits at 220 − (20 × 0.618) = 207.64; 0.65 sits at 207.00. Golden pocket = 207.0–207.6.
- EMA: the rising 22-EMA on the daily is curling up through 207.5. Price pulling into it from above.
- Anchored VWAP from the earnings gap has risen to 207.2 and price is holding just above it.
- Volume POC for the post-gap range sits at 207. — the shelf where most shares changed hands.
- Structure: the pullback is carving a higher low right here, above the prior swing low at 205. Uptrend intact.
Count them: golden pocket, rising 22-EMA, anchored VWAP, volume POC, and a structural higher low — five independent reasons all landing in a 207.0–207.6 band. That is a confluence zone. Five different tools, five different logics, one price.

Grading a confluence zone: not all fives are equal
Once you can count confluences you need to weight them, because a naive count lies. Two refinements the pros run automatically:
Timeframe weight. A confluence built from daily levels is worth far more than the same count built from 5-minute levels, because higher-timeframe levels are watched by more capital and take more force to break. A daily 22-EMA + daily golden pocket + weekly POC is a fortress. Five 3-minute levels is a sandcastle that the next news headline flattens. When HPT talks about TF-weighted confluence, this is it: a level gets more votes the higher the timeframe it lives on.
Tightness. Five tools spread across a 207.0–207.6 band (a 60-cent zone on a $207 stock, about 0.3%) is genuinely stacked. Five tools smeared across 205–210 is not confluence — it's five separate levels you're rounding together to feel confident. The tighter the cluster, the more real it is. If you have to squint to make them line up, they don't.
Contrast that with a lonely signal. Suppose instead NVX was mid-range at 213, no fib level nearby, EMAs far below, VWAP far below, no volume shelf — just a 5-minute RSI reading "oversold." That's one reason, floating in space, with no defined level where you'd be proven wrong. That's the trade that feels tempting and pays nothing. The zone with five confluences and the signal with one might both "look like a dip." The difference between them is your entire edge. Skip the lonely one every time. There is always another bus.
Adding two more tools to the stack (extended confluence)
The five above are the core, but the method scales. Here's how three more series tools bolt on when they're present, and why each earns a vote:
- Prior-day levels & round numbers. The prior day's low, the overnight low, and psychological round numbers (207.00, 210.00) act as magnets and shelves because so many resting orders cluster there. Our zone sitting right on 207.00 isn't a coincidence — it's why the volume POC formed there. When your fib zone lands on a round number, that's a genuine extra vote, not a repackaged one.
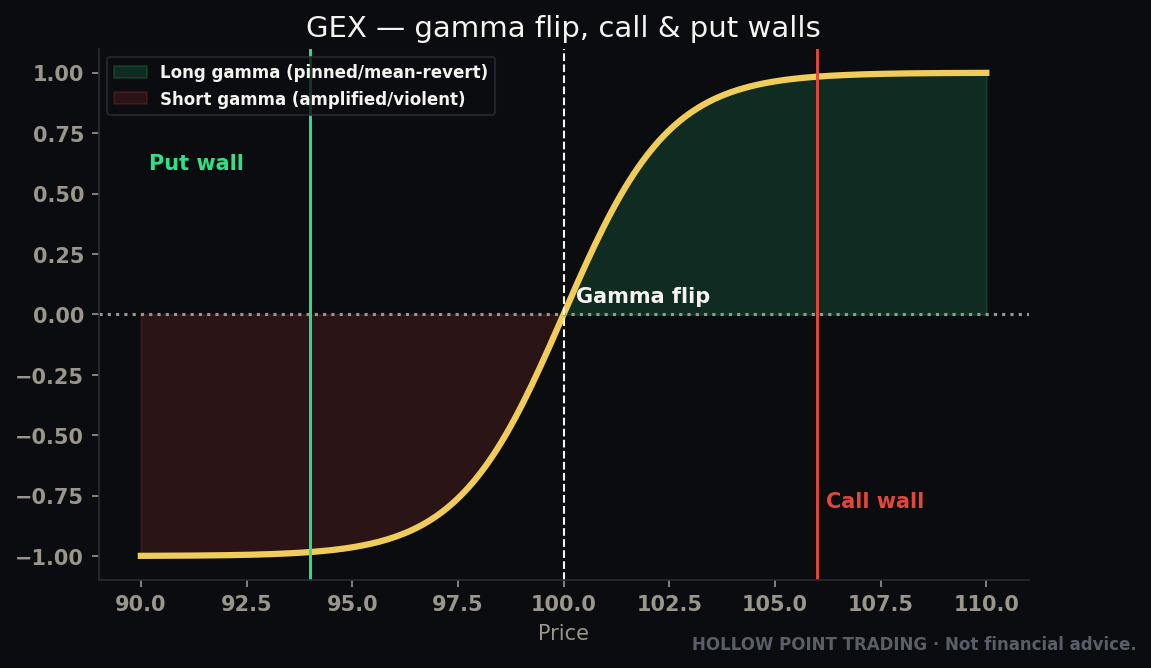
- Options gamma / GEX levels. When gamma data is available, dealer positioning creates real support and resistance. A put wall below your entry means dealers buy into weakness there — a mechanical bid under your level. A call wall above your target tells you where the move may stall. If NVX has a put wall at 205 (right at your invalidation) and a call wall at 215 (right at T2), the options structure is confirming your technical zones, and that's some of the strongest confluence there is because it's a real flow, not a drawn line.
- Session VWAP + opening range. Intraday, the day's VWAP and the first 15–30 minute opening range give you the execution-timeframe scaffolding. Entering as price reclaims session VWAP inside your daily zone times the higher-timeframe read to the intraday one.
For our entry we want confirmation at the zone, not a blind limit into falling price. So the trigger is: price tags 207.0–207.6 and prints a reversal signal on the execution timeframe — say a bullish engulfing candle on the 15-minute reclaiming the anchored VWAP. Now we act.
Step 5 — The expression: how you actually put it on
You've got a level. Now, what do you buy? Two honest choices for most traders: shares, or a defined-risk options structure. (If you trade futures, it's the contract and a hard stop — same math, more leverage, tighter discipline.)
The stop comes first, always. Below the confluence zone and below the structural higher low, a break of 205 says the pullback has become a trend change — that's our invalidation. We'll place the stop at 204.8 to sit just under the round number and the swing low. So:
- Entry: 207.4 (mid-zone, on the engulfing confirmation)
- Stop: 204.8
- Risk per share: 207.4 − 204.8 = $2.60
Targets must respect 1:3. Risk is $2.60, so minimum reward is 3 × $2.60 = $7.80, putting our full target at 207.4 + 7.80 = 215.20 — comfortably below the prior high area and realistic given the trend. We'll actually run a two-target plan (below).
Now the expression:
If shares: straightforward. Long at 207.4, stop 204.8. Size is set by the stop (next section). Shares are the cleanest expression — no time decay, no volatility crush, the chart level is your risk. If you're learning, trade shares until sizing and stops are automatic, then add options.
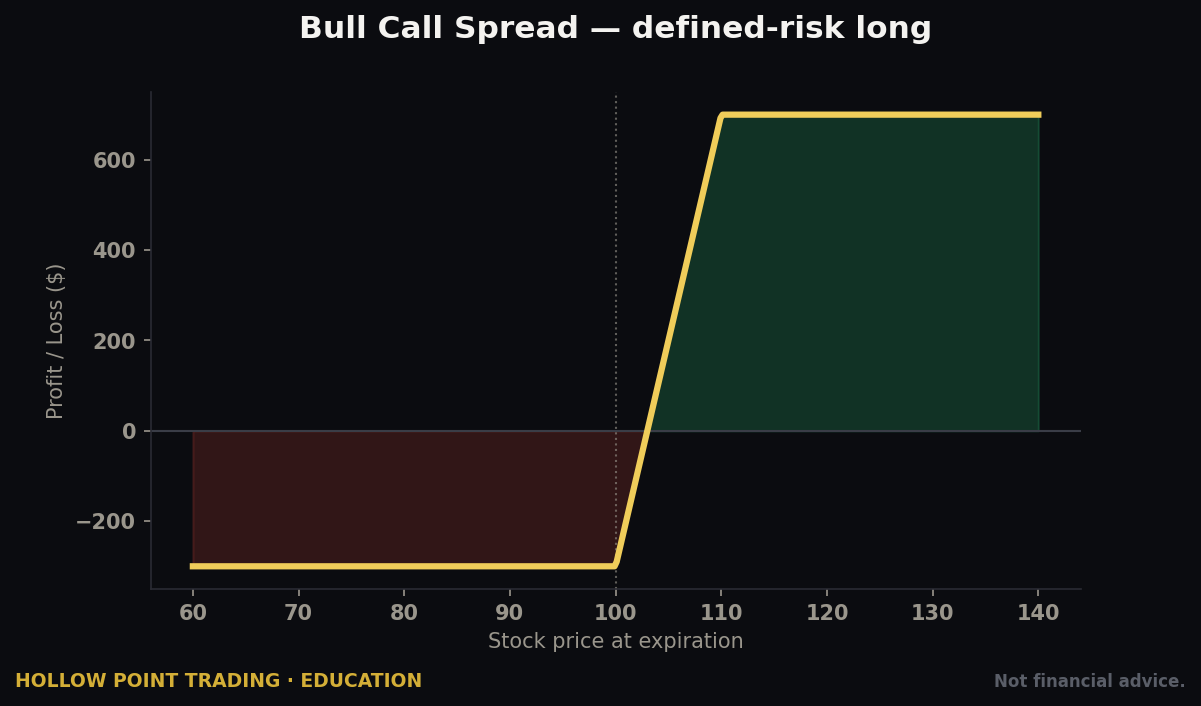
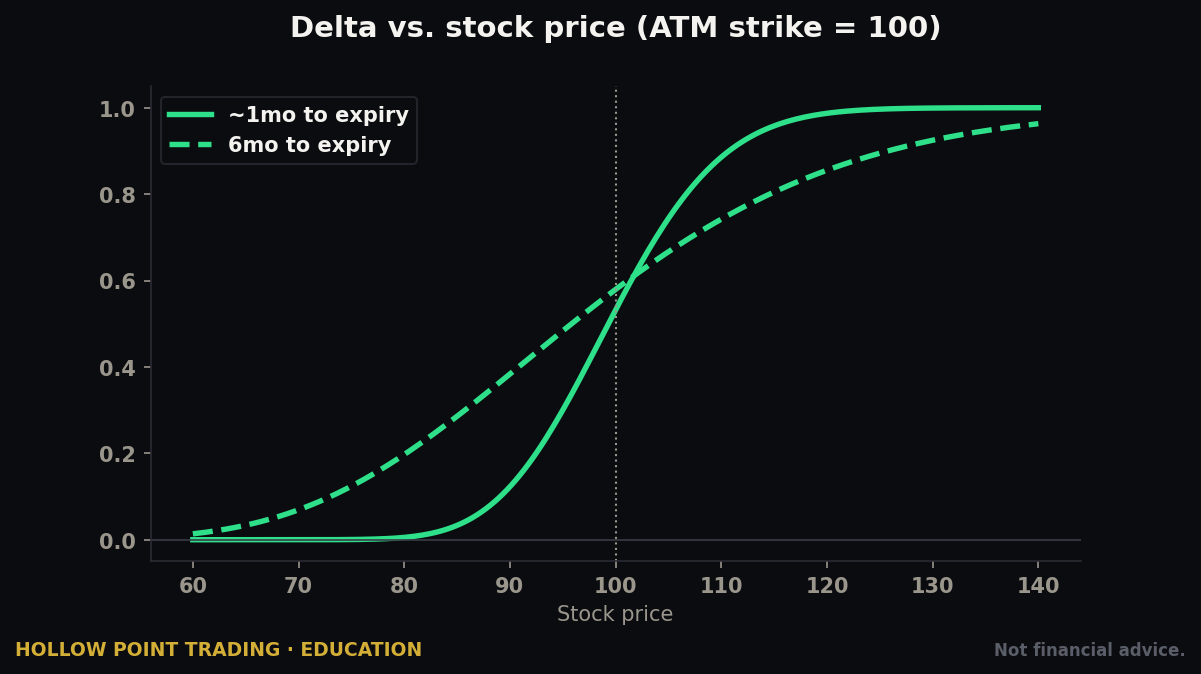
If options: you want to express a directional, multi-day view, so you buy time and pick a delta that behaves. Delta is roughly how much the option moves per $1 in the stock, and loosely approximates the probability of finishing in-the-money. For a directional swing you generally want 0.60–0.70 delta calls — deep enough that the option tracks the stock closely and time-decay (theta) hurts less than it would on cheap out-of-the-money lottery tickets. Give yourself 30–45 days to expiration so a two- or three-day hold isn't fighting the clock.
So: buy the NVX 210 calls, ~35 DTE, ~0.62 delta, trading around $6.50 ($650 per contract). The key discipline: you still manage the position off the stock's chart. If NVX closes below 204.8, you're out of the calls — you do not "give it room" because it's options. The stock level is the truth; the option is just the vehicle.
The Greeks you can't ignore, in plain English
- Delta — directional exposure. 0.62 delta ≈ 62 shares of stock behavior per contract. Higher delta = the option acts more like the stock and less like a lottery ticket.
- Theta — the rent you pay for time. Decay accelerates in the last ~21 days, which is exactly why you buy 30–45 DTE and get out before the cliff. A far-OTM weekly is nearly all theta risk.
- Vega / IV — sensitivity to implied volatility. Buy options when IV is low relative to its own range; buying after a spike means you can be right on direction and still lose to the vol crush. Check IV rank before you pay up. Critically, never buy short-dated options into an earnings print unless volatility is the trade — IV collapses the morning after and eats you alive even on a correct call.
- Gamma — how fast delta changes. Near expiry and near the strike, gamma is violent; it's why weeklies swing so wildly. For swings you want modest gamma, which again points you at 30–45 DTE, 0.60+ delta.
Futures: same map, more leverage
If NVX were an index and you were trading ES or NQ futures, the machine is identical but the leverage forces even tighter discipline. NQ moves $20 per point per contract; a 2.6-point adverse move that's trivial in shares is $52 per contract, and the leg from a stop-run can be 20+ points in seconds during a high-vol regime. Futures reward the trader who has already done the top-down work and punish the one improvising, because there's no theta to blame — every tick is real, immediate P&L. The 1:3 rule and the 1% sizing rule don't relax for leverage; they matter more.
Step 6 — Position size off the stop (the part that saves accounts)
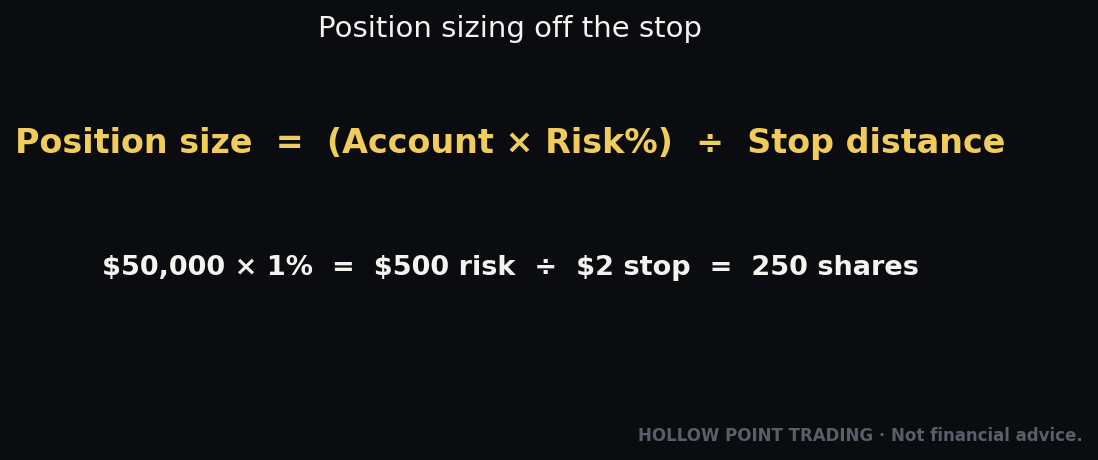
Here is the rule that matters more than any indicator: you do not size by conviction or by what you can afford. You size so that being wrong costs a fixed, small slice of your account. HPT standard: risk about 1% of the account per trade.
Worked example. $50,000 account. 1% risk = $500 max loss on this trade.
Shares:
- Risk per share = $2.60
- Shares = $500 ÷ $2.60 = 192 shares (round to 190)
- Position value = 190 × 207.4 ≈ $39,400
Notice that a $39K position only risks $500, because the stop is tight. The tight, well-defined invalidation from all that confluence work is what lets you hold real size safely. Sloppy entries force wide stops, which force tiny size or oversized risk. Confluence and sizing are the same conversation.

The formula, and why it's backwards from how amateurs think
The professional sizing formula is always:
Position size = (account × risk %) ÷ (per-unit risk to the stop)
Read it carefully. The stop distance is in the denominator. That means the market — where your invalidation sits — sets your size, not your feelings. A tight stop means a big position at the same dollar risk; a wide stop means a small one. The amateur does it in the opposite order: they decide how many shares they "want," buy them, and then place a stop wherever leaves room. That inverts the entire logic and is the number-one cause of blown accounts. The stop is an input, not an afterthought.
Sizing across regimes
The 1% is a ceiling, not a mandate. Scale it to conviction and regime:
- A-setup, trend regime, all four layers aligned: full 1%.
- B-setup, one layer disagrees (say sector is neutral): half size, 0.5%.
- Chop or high-vol regime: half or quarter size even on a good setup, because your stop is more likely to get run on noise. In VIX-30 conditions, a "1% risk" position can gap through your stop and cost 2–3%, so you pre-shrink.
- Correlated book. If you already hold two other semis, a third long isn't a new 1% — it's adding to a sector bet. Count correlated positions as one risk unit. Three semi longs at 1% each isn't 3% of independent risk; on a sector-wide flush it's effectively a 3% single bet.
Options sizing: Your defined risk is trickier because an option can lose value from a move and from time. Approximate it through delta. At 0.62 delta, a $2.60 adverse move in the stock costs roughly 0.62 × $2.60 = $1.61 per share of option value, or ~$161 per contract, before adding a little for accelerating decay/vega near the stop — call it ~$180 per contract of practical risk to your mental stop.
- Contracts = $500 ÷ $180 ≈ 2 contracts ($1,300 outlay, but your risk to the stop is ~$360, and absolute max if it gaps to zero is the $1,300 — which is why you keep contract count modest).
Either way, the answer to "how many?" is dictated by the stop and the 1% rule — never by excitement.
Step 7 — The plan, on paper, before you're in
If it isn't written before entry, it doesn't exist. Emotion writes a worse plan in real time. Ours:
- Thesis: strongest semi in the strongest sector in a risk-on tape, buying a 5-confluence higher-low pullback.
- Entry: 207.4 on the 15-min bullish engulfing reclaiming anchored VWAP.
- Invalidation (hard stop): daily close or clean break below 204.8. No negotiation.
- Target 1 (T1): 211.5 — roughly the halfway measured move and prior minor resistance. ~1.6R.
- Target 2 (T2): 215.2 — the full 3R objective.
- Trim rule: sell half at T1, and — this is the discipline that makes the day — move the stop up to breakeven (207.4) on the remaining half. Now the trade is risk-free and you're playing with house money into T2.
- Trail: let the back half run under a rising 22-EMA / prior-bar-low trail; take it off at T2 or on a structure break.
Where targets actually come from
T1 and T2 aren't round numbers you like. They're levels the market has already drawn:
- T1 is usually the nearest overhead friction — prior minor resistance, a lower-timeframe POC, the halfway point of a measured move. Somewhere price is likely to hesitate, which is exactly where you want to be a seller into strength rather than a hopeful holder.
- T2 is the next major structural level — the prior swing high, a daily volume shelf, a call wall. It's where the move logically pauses or the R/R stops being favorable.
Set targets before entry, at friction points, so you're taking profit where others are getting trapped — not where your P&L happens to feel good.

The pre-mortem
Add one line to every written plan: "This trade fails if ___." Naming the failure in advance — "it fails if the sector rolls over" or "it fails if it can't reclaim VWAP within two bars" — does two things. It pre-commits you to the exit so you don't renegotiate it live, and it sometimes talks you out of the trade before entry when the failure condition is already half-present. The pre-mortem is free and it's the cheapest edge in trading.
How a real trader actually uses this
Two days later NVX taps 207.3, wicks the anchored VWAP, and closes back above it with a fat bullish engulfing bar on the 15-minute. You're filled at 207.4 with your 190 shares (or 2 calls). Stop's in at 204.8. You wrote it down; you just execute.
Next session it grinds to 211.5. You sell 95 shares into that strength — into green, while everyone else is waiting for more — and move the stop on the rest to 207.4. Booked: 95 × $4.10 = $389, and the remaining position cannot lose. That single act, trimming into strength and moving to breakeven, is what separates "I had a good read" from "I got paid."
The back half runs to 215.2 two days later and you close it: 95 × $7.80 = $741. Total on the trade: $1,130 on $500 of risk — 2.26R, on an account that was never exposed to more than 1%.
Now imagine the other timeline. It tags the zone, rolls over, and closes at 204.5. You're stopped for −$494. It stings for a minute. But it's 1% of the account, it's exactly what you pre-decided, and it frees your capital and your head for the next one. The stop honored is not a loss of the game — it's the price of staying in it. The traders who blow up aren't the ones who take small planned losses. They're the ones who "give it room."
The same machine in a chop regime
Rewind and change one thing: the macro layer. ES is stuck in a three-week range, EMAs flat and tangled, VIX 17, breadth mixed — a chop regime. Everything else about NVX is the same: leading name, five-confluence zone at 207. What changes?
You halve the size (0.5%, ~95 shares) because a pullback-buy has lower odds without a trend to resume. You demand more confirmation — not just an engulfing bar but a reclaim that holds two bars — because false reclaims are the signature of chop. And you take T1 as the whole trade, because in a range price is as likely to reverse at the middle as to run to a new high; the 3R runner that trend gives you for free is a low-probability wish in chop. Same setup, completely different management, because the regime rewrote the odds. Read at 211.5 you're flat and grateful, not greedy.
The same machine in a high-vol regime
Now VIX is 32, ES gapping 1% each direction daily, correlations at 1. NVX prints the identical five-confluence zone. Here you either stand aside or you size to a quarter (0.25%) and widen the stop to survive the noise — which, because size is set off the stop, means an even smaller position. The trap in high-vol is that the moves are huge and seductive, so the setup "pays more" when it works. But your stop gets run on a random 3-point air-pocket that has nothing to do with your thesis, and correlation-to-1 means your stock-specific edge is drowned out by macro. The professional read in panic is usually the boring one: less size, or nothing. Cash is a position, and it's the winning one on most VIX-32 days.

How the pros use this differently from beginners
Same tools, wildly different results, and it's almost never about the tools. Here's where the gap actually lives:
- Pros hunt fewer, better setups. A beginner takes 15 trades a day chasing every signal. A pro takes three a week and passes on 40 "pretty good" charts to wait for the one where all four layers align. Selectivity is the edge; the market pays for patience, not activity.
- Pros manage risk before reward. The beginner's first thought is "how much can I make?" The pro's first thought is "where am I wrong and what does that cost?" The stop is decided before the target is even considered. Reward is what's left over after risk is defined, not the starting point.
- Pros size the same setup differently by regime and conviction. A beginner uses one position size for everything. A pro is running 1% on an A-setup in a trend and 0.25% on a B-setup in chop, from the identical chart. The sizing dial is where most of their edge is applied, and beginners don't even know it's there.
- Pros trim mechanically; beginners hold for the hero exit. The pro sells half at T1 every time, without emotion, and lets the rest ride risk-free. The beginner refuses to sell any because "what if it runs," then round-trips the winner back to breakeven or a loss. Booking the base hit is unglamorous and it's most of the P&L.
- Pros are flat and fine. A beginner needs to be in a position; being in cash feels like missing out. A pro treats cash as the default and a trade as the exception that has to earn its way in. No setup, no trade, no stress.
- Pros keep a journal and compound the lessons. Every trade gets logged — thesis, screenshot, what worked, what didn't. Over a year that journal becomes a personalized edge no course can sell. Beginners remember their wins and forget their losses, so they never see their own patterns.
- Pros respect correlation. A beginner puts on three semi longs and thinks they're diversified across three trades. A pro knows that's one sector bet at triple size and either picks the best single name or sizes the basket as one unit.
- Pros don't marry the thesis. When the reason they entered stops being true — the sector rolls, VWAP fails to reclaim — they're out, even at a small profit or scratch, no ego. Beginners defend a broken thesis all the way to the stop because being wrong feels worse than losing money.
The mistakes people make
- Counting fake confluence. Four momentum oscillators all saying "oversold" is one signal. Independent tools only. If they'd all fire off the same input, they don't get separate votes. RSI, Stochastic, and Williams %R are the same idea three times — pick one and go find genuinely different evidence.
- Skipping the top-down. Taking a beautiful chart long in a name whose sector is being liquidated in a risk-off tape. The chart was fine. The context vetoed it. You didn't check. The higher timeframe always wins the argument eventually.
- Sizing by feeling. "I really like this one" is not a position-sizing input. The stop and the 1% rule are the only inputs. Doubling size because you're confident is how good traders have bad months and how great setups become account-enders.
- Entering before confirmation. Blind limit orders into a falling knife at "the zone." Wait for the zone to hold — the reversal candle, the VWAP reclaim. Confluence tells you where; price action tells you when. A level is a location, not a signal.
- Moving the stop down.*** The single most expensive habit in trading. You may move a stop up to protect gains. You never move it down to avoid taking a loss. The moment you widen a stop live, you've abandoned the plan and started gambling.
- Not trimming, and round-tripping a winner. Refusing to sell any into strength because you want the home run, then watching +2R become −1R. Take the base hit at T1; let the runner be the bonus, not the whole thesis.
- Options as lottery tickets. Buying cheap far-OTM weeklies for a multi-day swing and getting bled by theta even when you're right on direction. Buy delta and time. The cheap option is expensive because it usually expires worthless.
- Forcing a trade on a no-signal day. Some days nothing lines up. The professional move is to do nothing. Cash is a position. Boredom is not a trade signal.
- Running a trend playbook in a chop regime. The most insidious mistake because your setup is technically valid — you just deployed it in the wrong weather. Classify the regime first, then choose the playbook.
- Buying options into an earnings print. Getting long premium the day before earnings, being right on direction, and losing anyway to the post-print IV crush. Know where the catalyst is on the calendar and never let it ambush your vega.
- Revenge trading after a stop. Taking an unplanned, oversized trade immediately after a loss to "get it back." This is how a −1% day becomes a −5% day. The planned stop was the system working; the revenge trade is you overriding it. Step away.
- Ignoring correlation across the book. Five green-lit longs that are really one macro bet. When the tape turns, they all stop out together and your "diversified 5%" evaporates as a single 5% hit. Count correlated risk as one unit.
FAQ
How many confluences do I actually need? Three genuinely independent ones is the working minimum for a trade; five is an A-setup. But quality beats count — three tight, high-timeframe confluences beat five loose, low-timeframe ones. Weight them, don't just tally them.
What if the market (macro) and the stock disagree? Then you either pass or you size way down. A great stock chart in a risk-off tape is a lower-probability trade; the context is a headwind you'd be paying to fight. When layers conflict, the higher layer usually wins over time, so respect it.
Shares or options — which should I start with? Shares, until stops and sizing are second nature. Options add time decay, volatility, and Greeks on top of a directional read you haven't mastered yet. Add options only once the underlying discipline is automatic, and even then, use them to express directional views with 0.60+ delta and 30–45 DTE, not as leverage lottery tickets.
What's a realistic win rate with this method? Lower than beginners expect and it doesn't matter. At 1:3 you can win 40% and be very profitable. Chasing a high win rate usually means cutting winners early and holding losers — the exact opposite of what makes money. Optimize R-multiples, not accuracy.
Do I really have to write the plan down? Yes. The plan you make before entry is calm and rational; the one you improvise live is written by fear and greed. If it's not on paper (or in your journal) before you click buy, you don't have a plan, you have a hope.
Can I move my stop? Up, to protect profit, yes — that's how you get to a risk-free trade. Down, to avoid a loss, never. If you find yourself wanting to widen a stop, the honest move is to accept the trade is being invalidated and take the small loss you already budgeted for.
What time frame should I trade? Whatever matches your schedule and temperament — but always analyze at least two: a higher one for direction/bias and a lower one for entry timing. Day traders might use daily-for-bias, 15-minute-for-entry; swing traders weekly-for-bias, daily-for-entry. The nesting matters more than the specific numbers.
How do I handle news and catalysts? Know the calendar — earnings, Fed, CPI, jobs. Don't hold short-dated options through a print you didn't intend to trade. A catalyst can override every technical level on the chart, so either build the event into the thesis or be flat for it.
What if I miss the entry? Let it go. "There is always another bus." Chasing an extended move means entering with a worse stop and worse R/R — the two things the whole method exists to protect. A missed trade costs nothing; a chased one costs the account.
How do I know if I'm in a chop regime? Flat, tangled EMAs on the index, no net progress over 2–3 weeks, price oscillating between a clear ceiling and floor, middling VIX. If you can't identify a trend direction in ten seconds, assume chop and switch to range tactics — fade the edges, take profit fast, size down.
Cheat-sheet: build a trade, top to bottom
The top-down stack (all four should point the same way):
- Macro: Index above rising 50/200 EMA? VIX regime? Trend, chop, or panic? → Sets the direction you're allowed to hunt and how much to size.
- Sector: Is the group's ETF outperforming SPX (ratio chart rising) and trending? → Shop the leading aisle only.
- Instrument: Is this name outperforming its own sector, pulling back on falling volume? → Strongest name, strongest group, strongest tape.
- Level: Find the price where 3+ independent tools converge — structure HL, EMA 12/22/55, fib 0.618–0.65 golden pocket, anchored VWAP, volume POC, plus round numbers / GEX walls when present. Weight by timeframe; demand tightness.
The trade math (both jobs must pass):
- Confirm: Wait for the zone to hold — reversal candle / VWAP reclaim. Don't pre-empt. Location ≠ signal.
- Stop first: Place invalidation just beyond the structural level. Measure risk per unit.
- Reward check: Target ≥ 3× risk, set at real friction levels, or the trade doesn't qualify. No 1:3, no trade.
- Size: Units = (1% of account) ÷ risk per unit. Scale down for chop, high-vol, low conviction, and correlated positions. Never by feeling.
The management (where the money is actually made):
- Plan on paper: entry, hard stop, T1, T2, and "this fails if ___."
- Trim half at T1, move stop to breakeven, trail the rest under the rising 22-EMA / prior-bar-low. Honor the stop. Always. Never widen it.
Regime quick-key:
- Trend → buy pullbacks / sell rallies, full size, let runners run.
- Chop → fade the range edges, half size, take T1 and go flat.
- High-vol / panic → quarter size or stand aside; correlations go to 1, edge shrinks, cash wins.
The four pillars, one sentence each:
- Confluence finds the level.
- Reward-to-risk qualifies the trade.
- Position sizing keeps you alive.
- Discipline — trimming into strength, honoring the stop — converts the read into money.
Skip any one of the four and the other three can't save you. Run all four, over and over, and you don't need to be right most of the time. You just need to be built right every time. The read is the fun part; the build is the paycheck. Do the boring parts — the top-down check, the stop-first sizing, the written plan, the mechanical trim — with religious consistency, and the money is the residue of the process, not the goal you chase.
Bound by rules, feared by trade.