
Every trader has stood in front of a chart layered with moving averages, RSI, MACD, volume profile, three kinds of VWAP — and still had no idea what to do. That's not an indicator problem. That's a structure problem. Indicators are adjectives. Structure is the sentence. If you can't read the sentence, no amount of adjectives will tell you what it says.
This guide teaches you to read raw price the way a trader in the seat reads it: what the market is doing right now, where it's likely to go, and — most importantly — the exact price that proves you wrong. By the end you'll be able to glance at any chart, on any timeframe, and answer the one question that comes before every indicator: what is price doing right now?
We're going to build this from the ground up. First the concept — the three things price can do. Then the mechanism — why structure forms, so you're reading real order flow and not superstition. Then the working vocabulary: Break of Structure, Change of Character, impulse and correction, ranges, and the liquidity that moves the whole machine. Then we get practical: worked examples with real numbers, how structure behaves in trending versus choppy versus high-volatility regimes, how to stack timeframes, how to combine structure with three other tools, and the mistakes that quietly drain accounts. We close with how professionals read structure differently from beginners, a FAQ, and a one-page cheat-sheet you can run on any chart in thirty seconds.

The Concept: Price Only Ever Does Three Things
Strip everything away. No EMAs, no oscillators, just candles. At any moment, on any timeframe, price is doing exactly one of three things:
- Trending up — making higher highs and higher lows.
- Trending down — making lower highs and lower lows.
- Ranging — bouncing between a defined ceiling and floor, going nowhere.
That's the entire language. Every setup, every strategy, every "confluence" you'll ever stack is built on top of correctly naming which of these three is happening. Get this wrong and you're long into a downtrend or shorting a range floor — the two fastest ways to bleed an account.
Market structure is simply the record of the highs and lows price leaves behind. Those swing points — the peaks and valleys — are the skeleton of the chart. Connect them in sequence and you get the story of who's winning: buyers or sellers.

What Counts as a Swing Point
A swing high is a candle whose high is higher than the candles on either side of it — a local peak. A swing low is a candle whose low is lower than the candles on either side — a local valley. That's the whole definition. You don't need a fractal indicator to see them; your eye finds them faster than any script. Mark the obvious ones. Ignore the noise.
The strict textbook version is the "three-bar swing": a swing high is a bar with a lower high on each side, a swing low is a bar with a higher low on each side. That's fine as a starting rule, but understand its limit — it will dot dozens of tiny wobbles on a noisy chart and give you visual soup. The professional refinement is to grade swings by significance. A swing that price traveled a long way to reach, that took several bars to build, and that clearly rejected, is a major swing. A one-bar poke that barely stood out from its neighbors is a minor swing. You mark the major ones for structure and treat the minor ones as texture. When in doubt: if you have to squint to justify a swing point, it's not one.
Reading the Sequence
Once you can dot the swing highs and lows, structure reads itself:
- Higher High (HH) + Higher Low (HL) = uptrend. Buyers keep paying up, and dips get bought before the last dip.
- Lower High (LH) + Lower Low (LL) = downtrend. Sellers keep hitting bids lower, and rallies fail before the last rally.
- Equal-ish highs and lows = range. Neither side can extend.
Notice the pairing. It is not enough to see a higher high. An uptrend needs higher highs and higher lows in sequence. A higher high followed by a lower low is not an uptrend — it's the first sign of trouble. Structure is a conversation between the two extremes: buyers speak with higher lows (they defend higher and higher prices), sellers answer with lower highs (they cap the advance lower and lower). Whoever keeps winning that exchange owns the trend.
This is the top of the funnel for everything Hollow Point does. Before EMA 12/22/55, before RSI, before a single confluence gets counted — you name the structure. The trend framework only confirms what structure already told you.
The Mechanism: Why Structure Forms at All
Structure isn't magic and it isn't self-fulfilling superstition. It's the visible residue of order flow — of large participants building and unloading positions that are too big to execute in one click.
When an institution wants to buy 10,000 contracts, it can't just lift the offer. It would move the market against itself instantly — the price it pays on the last contract would be far worse than the first. So it buys in pieces, absorbing sellers on every dip, defending a level. Each time price pushes up and then pulls back to a higher low, that's the footprint of a buyer who won't let price come back to the old price. The higher low is the accumulation. The higher high is the moment that buying overwhelms the last batch of sellers.

The Feedback Loop That Keeps Trends Alive
Trends persist for a mechanical reason, not a mystical one. A trend is a feedback loop:
- Price rises off a higher low.
- Breakout traders pile in as it clears the prior high, adding fuel.
- Shorts who faded the move get stopped out — and a short's stop-loss is a buy order, so their pain pushes price higher still.
- Trend-followers and momentum funds add on the strength.
- That fresh demand creates the next higher low, and the loop repeats.
The higher low forms because there's more demand than supply at successively higher prices. When that stops being true — when a pullback goes deeper than the last one and takes out a prior low — the loop has broken. That break is the first evidence the balance of power has flipped. This is exactly why the Change of Character (which we'll define shortly) is such a powerful signal: it's the first observable moment the feedback loop stops feeding itself.
Why Ranges Are Loaded Springs
Ranges form when buyers and sellers reach rough equilibrium. Price is "fairly valued" for now; big players sit on their hands or quietly transact without moving the tape. But here's the thing that makes ranges so important: a range is where the next trend is loaded. Institutions can't build a monster position in a trending market without chasing price — they build it sideways, in the chop, where the crowd is bored and bleeding out on false breaks. Accumulation happens before a markup; distribution happens before a markdown. The boring range is where the smart money does its work.
Understanding the mechanism matters because it tells you what's real. A higher low isn't bullish because a textbook says so. It's bullish because it's the fingerprint of someone with size who is willing to pay more than the last guy. A range isn't "nothing" because it's flat — it's the loading phase for the move that follows. Your job is to read the fingerprints, not memorize the shapes.
Break of Structure (BOS): The Trend Confirms Itself
A Break of Structure is when price breaks past the most recent swing point in the direction of the existing trend, confirming that trend continues.
In an uptrend, the market is making HHs and HLs. Each time price takes out the prior swing high, that's a bullish BOS — the trend just printed its next higher high, confirming buyers are still in control. In a downtrend, each time price breaks the prior swing low, that's a bearish BOS — sellers extend.
BOS is your continuation signal. It says: nothing has changed, the trend is intact, and pullbacks into demand are still worth buying (in an uptrend) or rallies into supply are still worth selling (in a downtrend).
Trading the BOS the Right Way
Here's the practical read. Once you see a bullish BOS, you don't chase the breakout candle. Chasing the break puts your entry at the worst price of the leg and your stop miles away. Instead, you mark the swing low that launched the break — that pullback low is now your reference. You wait for price to come back toward it, and you look for entry there with your stop just under it. If price makes a higher low above that reference and pushes again, structure is confirming and you're aligned with it.
The mental model: the BOS tells you the trend is alive; the pullback after it tells you where to get in. Break, then retrace, then continue. Your money is made on the retrace, not the break.
Worked example. NQ is trending up on the 15-minute. It prints a swing low at 20,000, rallies to a swing high at 20,120, pulls back to a higher low at 20,050, then pushes through 20,120. That break of 20,120 is a bullish BOS. The 20,050 higher low is your new floor. Price drifts back to 20,060 — you're looking for a long, stop under 20,040 (below the HL), targeting the next leg. If the next leg carries to 20,240, you risked 20 points to make 180 — a clean 1:3-plus candidate with a defined invalidation. Structure told you the direction; the higher low gave you the risk level. That's the whole game in one sequence.
The Close-Not-Wick Rule
The key discipline: a BOS is only valid on a body close beyond the level, not a wick poke. A wick through the prior high that closes back inside is often the opposite of continuation — it's a liquidity grab (we'll get there). Wait for the candle to close past the level before you call it a break.
How much of a close counts? Use a small buffer sized to the instrument. On NQ, a break might need the body to close five to ten points clear of the level, not a single tick. On a $50 stock, maybe fifteen to twenty cents. The point is to filter the noise of a level being kissed versus a level being taken. A close that clears the level by a hair, on a tiny-bodied doji, is a weak break; a close that clears it with a full-bodied impulse candle on rising volume is a strong one. Grade your breaks — don't treat them all as equal.
Change of Character (CHoCH): The Trend's First Crack
A Change of Character is the first break of structure against the prevailing trend. It's the earliest warning that the trend may be ending and a reversal beginning.
Picture that uptrend: HH, HL, HH, HL. As long as each pullback bottoms at a higher low, buyers are in control. The moment a pullback drives through the most recent higher low and closes below it — that's a CHoCH. For the first time, price made a lower low. The character of the market has changed. Buyers just failed to defend the level they'd been defending.
CHoCH is your reversal heads-up. BOS says "same story, continue." CHoCH says "the story just changed, pay attention." The distinction is everything:
- BOS = break with the trend → continuation.
- CHoCH = break against the trend → potential reversal.
They are the same mechanical event — a swing point getting taken out — but the direction relative to trend flips the meaning completely. This is the single most useful pair of concepts in structure reading, and it's where most beginners get lost. So let's nail it.
The Level That Matters Depends on the Trend
In an uptrend, the levels that matter are the higher lows (the floors buyers defend). A break below a higher low = CHoCH (bearish warning). A break above a higher high = BOS (bullish continuation).
In a downtrend, the levels that matter are the lower highs (the ceilings sellers defend). A break above a lower high = CHoCH (bullish warning). A break below a lower low = BOS (bearish continuation).

Say it as a rule you can run in real time: in an uptrend, watch the last higher low; in a downtrend, watch the last lower high. That one level is the hinge. Everything above it (in an uptrend) is continuation territory; a close below it is the first crack.
The Full Sequence: CHoCH Warns, BOS Confirms
Worked example. A stock trends down all morning: LH at 105, LL at 101, LH at 103, LL at 99. Sellers own it. Then price rallies and closes above 103 — the prior lower high. That's a CHoCH: the first higher high in the downtrend, the first crack. You don't flip long yet — a CHoCH is a warning, not a green light. You wait. Price pulls back, holds a higher low at 101, and then breaks above the CHoCH high. Now you have a bullish BOS confirming a new uptrend that the CHoCH first hinted at. That two-step — CHoCH warns, BOS confirms — is how disciplined traders catch reversals without knife-catching.
The reason this sequence is so powerful: the CHoCH gets you looking early, but the BOS keeps you from acting on a fakeout. A single break against the trend can be a stop-run that fails. But a break against the trend, followed by a higher low, followed by another break in the new direction, is a genuine structural shift with three points of confirmation. You trade the third event, not the first.
The Trap of Over-Trusting the CHoCH
The trap to avoid: treating every CHoCH as a guaranteed reversal. In strong trends, a CHoCH on a low timeframe is frequently just a deep pullback that resumes the trend. This is why timeframe weighting matters — a 1-minute CHoCH inside a raging daily uptrend is noise; a daily CHoCH after a months-long uptrend is a genuine regime change. Weight the structure by the timeframe.
There's also a subtler nuance the pros track: internal vs. swing structure. Every trend has big swing points (the major HHs and HLs) and, nested inside each leg, smaller "internal" structure. A CHoCH on internal structure just means one small leg turned over — it often precedes a continuation of the larger trend, not a reversal. A CHoCH on the major swing structure is the one that actually threatens the trend. When you hear "CHoCH," always ask: of what — the small structure or the big structure? The answer changes whether you're looking at a pullback or a top.
Impulse vs. Correction: The Rhythm Inside the Trend
Trends don't move in straight lines. They breathe — a hard push, then a rest, a hard push, then a rest. Learning to tell the push from the rest is what separates traders who buy dips from traders who buy tops.
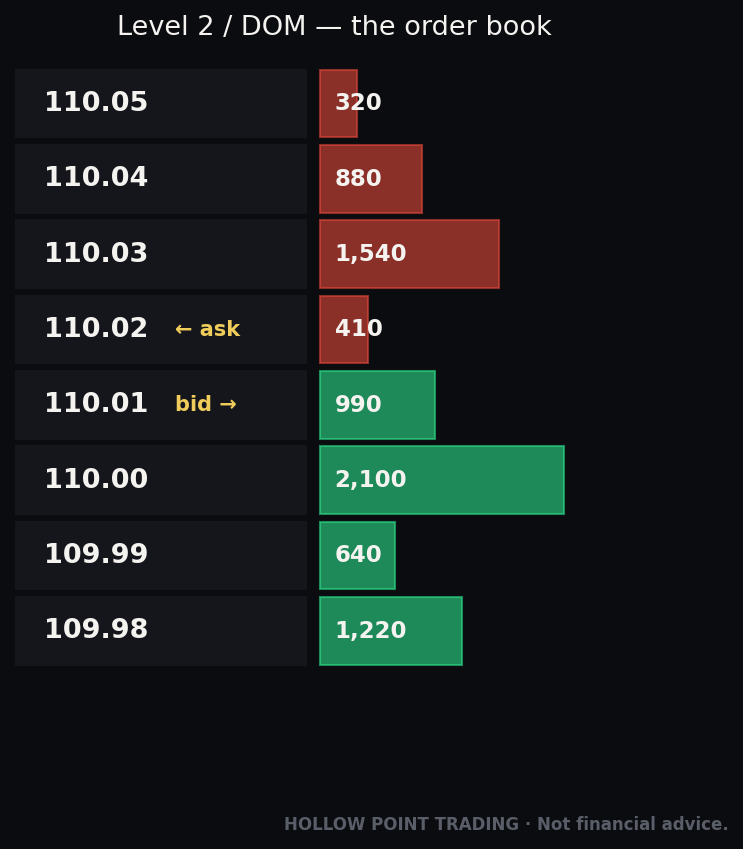
An impulse (or impulsive move) is the trend's dominant thrust: large-range candles, strong momentum, minimal overlap between bars, often on rising volume. It's the market moving with purpose in the trend direction.
A correction (or corrective move) is the counter-move: smaller candles, choppy and overlapping, drifting against the trend on lighter volume. It's the pullback, the pause, the profit-taking.
The Visual Tells
The tells are visual and reliable:
- Impulse: clean, one-directional, big bodies, few wicks against the move, quick. It feels urgent.
- Correction: overlapping candles, mixed colors, slow, small bodies, drifts diagonally. It feels reluctant.
Add volume and you sharpen the read further. Impulse legs typically expand volume — real participation drives them. Corrections typically fade on volume — the crowd steps back, and only profit-takers and small counter-traders are active. When you see a counter-trend move arrive on heavy volume with big bodies, that's your warning: this may not be a correction at all.
Enter With Impulse, at the End of Correction
Why this matters: you want to enter in the direction of impulse, at the end of a correction. The correction is the discount. In an uptrend, an impulse leg up followed by a lazy three-wave pullback into support is your buy zone — you're joining the trend at a better price, with your stop just beyond where the correction should hold. If price instead starts impulsing down, the character has changed and you stand aside.
The mistake beginners make is confusing a deep, slow correction with a reversal, and a sharp correction with a trend change. Speed and shape tell you which is which. A reversal usually announces itself with an impulsive move against the trend — that's the market showing you real supply/demand has flipped. A correction stays lazy. When the counter-move suddenly turns aggressive and impulsive, that's your CHoCH forming in real time.

The Measured-Move Read
There's a quantitative edge hiding here too. Healthy trends tend to produce proportional legs — impulse legs of similar size, corrections that retrace a consistent fraction (often into the 0.382–0.618 zone of the prior impulse). When corrections start getting deeper than they were — a trend that pulled back 38% now pulling back 62%, then 78% — the trend is weakening even before any level breaks. Deepening corrections are the trend running out of fuel in slow motion. Shallowing corrections (each pullback shallower than the last) are the opposite: a trend gaining strength, buyers so eager they won't let price come back far.
Practical drill: on any trend, label each leg "I" or "C" out loud. Impulse up, correction down, impulse up, correction down. The instant you catch yourself wanting to label a counter-trend leg "impulse," structure is warning you. That's the feel you're building.
Ranges, Accumulation & Distribution: Where Trends Are Born and Buried
When price stops trending and starts oscillating between a ceiling and a floor, you have a range (also called consolidation or a trading range). Ranges are not "nothing happening." They're often the most important structure on the chart, because trends are built inside them.
The Four Parts of Every Range
A range has four parts you must be able to mark:
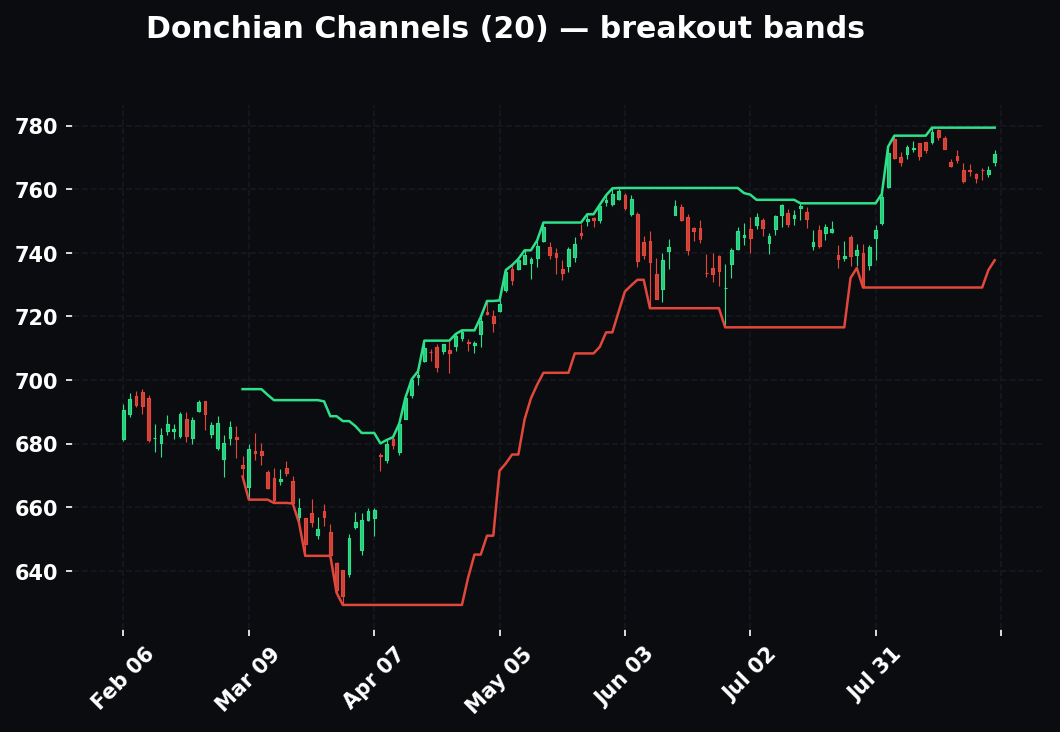
- Range high / resistance — the ceiling, where price keeps getting rejected.
- Range low / support — the floor, where price keeps getting bought.
- The equilibrium — the rough midpoint (the 50% level), where price is "fair." Price tends to accelerate away from equilibrium toward the extremes.
- The edges — where the action is. You trade from the edges toward the middle, or you trade the break of an edge. You never trade the middle.
The half above equilibrium is the premium (expensive — favor selling/shorting toward the top). The half below is the discount (cheap — favor buying toward the bottom). This premium/discount lens is how you avoid buying the top of a range and shorting the bottom. It's the same instinct a value shopper has: you don't buy at full price when you know the item goes on sale at the discount edge every week.
Accumulation and Distribution: Wyckoff's Two Ranges
Now the important part — why ranges form. Wyckoff, a century ago, named the two kinds:
Accumulation is a range where large players are quietly buying — building long positions from sellers who think the downtrend continues. It forms after a downtrend, at the bottom. The tell: price keeps getting bought at the floor, sellers can't push it lower, and eventually price breaks up out of the range into a new uptrend (the "markup"). A false break below the range that snaps right back — a spring — is the classic accumulation signature: big players run the stops under support, fill their longs on the panic, and reverse.
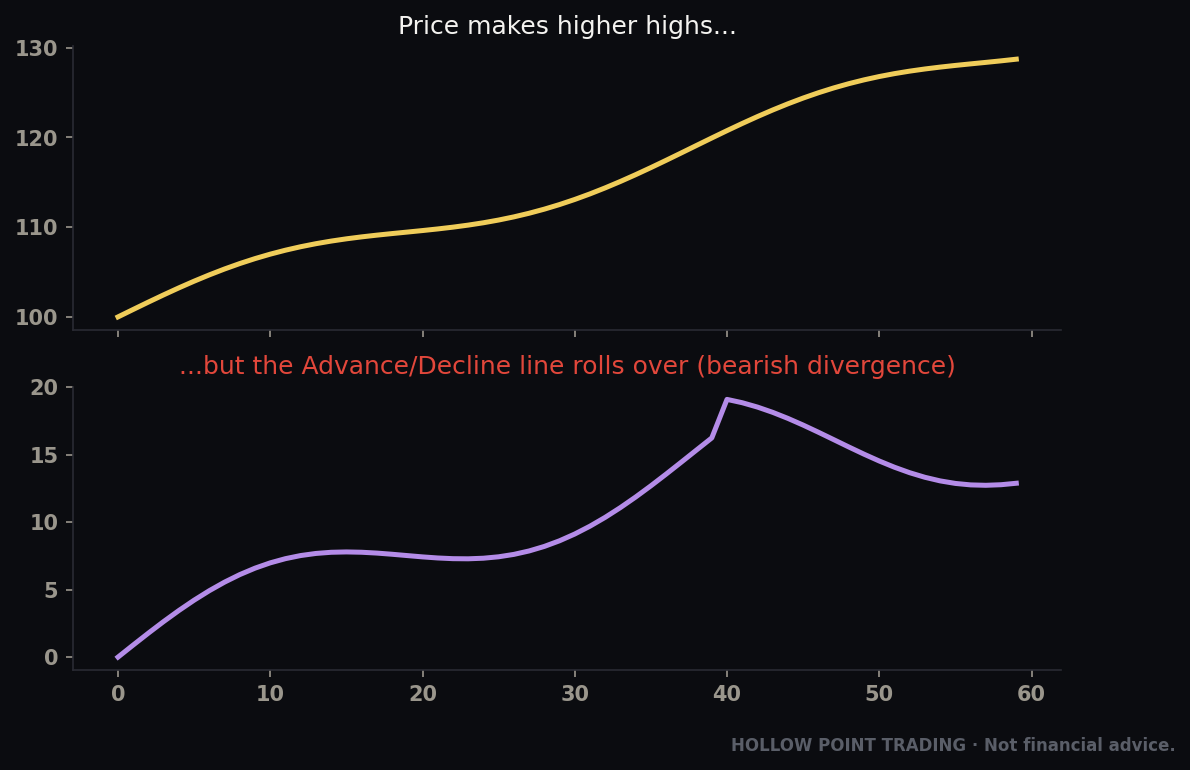
Distribution is the mirror: large players quietly selling their longs to buyers who think the uptrend continues. It forms after an uptrend, at the top. Price keeps getting sold at the ceiling, buyers can't push it higher, and eventually it breaks down into a markdown. The false break above the range that fails — an upthrust — is the distribution signature: run the stops above resistance, sell into the euphoria, reverse.
Reading a Range Live
How to read it live. You can't always know if a range is accumulation or distribution while you're inside it — but context tells you a lot. A range after a long downtrend, at a major support, with springs and shrinking downside follow-through, is likely accumulation — lean long on the breakout. A range after a long uptrend, at resistance, with upthrusts and failing rallies, is likely distribution — lean short on the breakdown. The prior trend is your biggest clue: markets accumulate at lows and distribute at highs.
Volume behavior inside the range is the second clue. In accumulation, you'll often see volume dry up toward the range lows (sellers exhausted) and spike on any push off support (buyers stepping in). In distribution, volume dries up on rallies (buyers exhausted) and spikes on drops off the highs (sellers unloading). The tape is telling you who's tired.
Worked example — an accumulation spring. A stock falls from $80 to $50 over three weeks, then goes sideways between $50 and $54 for eight sessions. Each dip to $50 gets bought; each rally to $54 gets sold. On day nine, price cracks to $48.60 on a spike — right through the obvious $50 floor where every swing trader's stop sits — then closes the day back at $51.20, above the range low. That's a spring. The breakdown failed, the stops got run, and the close back inside the range is the signal. A week later price is at $58 and the markup is underway. The traders who shorted the $50 break got run; the trader who waited for the reclaim got the trend.
Trading a Range Two Ways
The trade two ways. Inside a clean, wide range you fade the edges — buy the discount floor, sell the premium ceiling, stops just beyond. When the range gets old and tight, you shift to the breakout — wait for a decisive body close outside an edge (ideally after a spring/upthrust liquidity grab), then trade the new trend. What you never do is get chopped to death trading the middle or shorting into support because "it looks weak."
The transition matters: wide, fresh ranges are for fading; old, tight ranges are for breaking. A range that's been oscillating cleanly with lots of room is a fade environment — the edges hold. A range that's coiling tighter and tighter, with each swing smaller than the last, is compressing toward a breakout — stop fading, start watching the edges for the break. Reading which phase a range is in keeps you from fading the exact break that ends it.

Liquidity Pools & Stop Hunts: Why the Obvious Level Gets Run First
Here's the concept that makes everything above finally click, and it's the one retail traders discover last and wish they'd learned first.
Liquidity is simply resting orders — pending buy and sell orders sitting at prices, waiting to be filled. Where do orders cluster? At obvious levels:
- Above swing highs — that's where shorts put their stop-losses (stops on a short are buy orders) and where breakout buyers put their entries. A pool of buy liquidity sits just above every visible high.
- Below swing lows — that's where longs put their stops (sell orders) and breakout shorts enter. A pool of sell liquidity sits just below every visible low.
- Above/below equal highs or equal lows — double tops and double bottoms are magnets, because everyone can see them and piles stops in the same spot.
- Round numbers — 20,000 on NQ, $100 on a stock. Psychological clustering.
- Prior day high/low, session high/low, and opening range — institutional reference points where resting orders naturally gather.

Why Big Players Need Your Stops
Large players need this liquidity. To fill a big buy order, they need a flood of sell orders to buy from — and the biggest flood of sell orders sits right below an obvious low, in the form of long-stop-losses. So price gets pushed down through the low, triggers all those stops (a cascade of selling), and the big buyer fills into it — then price reverses hard and goes the other way. That's a stop hunt, or liquidity grab: a sharp poke beyond an obvious level that reverses immediately.
This is why your stop kept getting hit to the tick before price went your way. It wasn't bad luck. Your stop was the liquidity. The market didn't move against you and then reverse by coincidence — it moved against you specifically to reach your order and then reversed because reaching your order was the point.

Turning Liquidity Into an Edge
How to use it — this is the edge. Stop reading obvious levels as "support that should hold" and start reading them as "liquidity that will probably get run before the real move." Concretely:
- Don't put your stop at the most obvious spot with everyone else. Put it beyond the liquidity pool, past where the sweep would reach.
- When price sweeps a low and reverses back above it on a close — that failed break is a high-probability long, because you just watched the liquidity grab that fuels the move. Same logic mirrored for a swept high.
- A liquidity grab often is the CHoCH trigger. Price runs the stops below the last higher low (looks like a bearish break), then closes back inside and rips — the "CHoCH" was a trap, and the real move is the reversal. Reading liquidity keeps you from being the sucker who shorts the sweep.
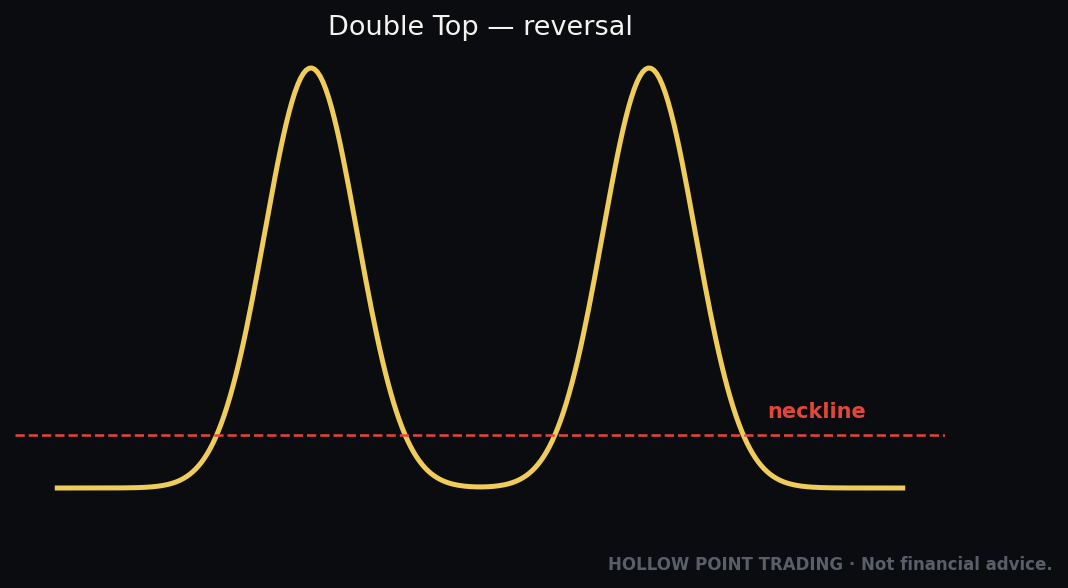
Worked example. Equal lows sit at 19,980 on NQ — obvious, everyone sees the double bottom. Instead of holding, price spikes to 19,972, tags the stops beneath the double bottom, and closes the 5-minute candle back at 20,010. That's a sell-side liquidity sweep and reversal. Your long entry is on that reclaim, stop under 19,972 (below the sweep low), targeting the range high. The "support" didn't hold — but the failure of the breakdown was the actual signal. Traders who only saw "double bottom broke, go short" got run.
Liquidity Runs Toward Liquidity
One more layer the pros use: liquidity doesn't just sit there to be grabbed — it acts as a target. When price sweeps the sell-side below a low and reverses, where is it headed? Toward the nearest unfilled buy-side pool — the last obvious swing high, the equal highs, the round number above. Markets move from one liquidity pool to the next, taking out the stops on one side to fuel the trip to the other. So once you've identified the grab, you've often also identified the target: the opposite pool. That's how you set a profit target that isn't a guess — it's the next resting cluster of orders price is likely reaching for.
How It Fits the Top-Down Process
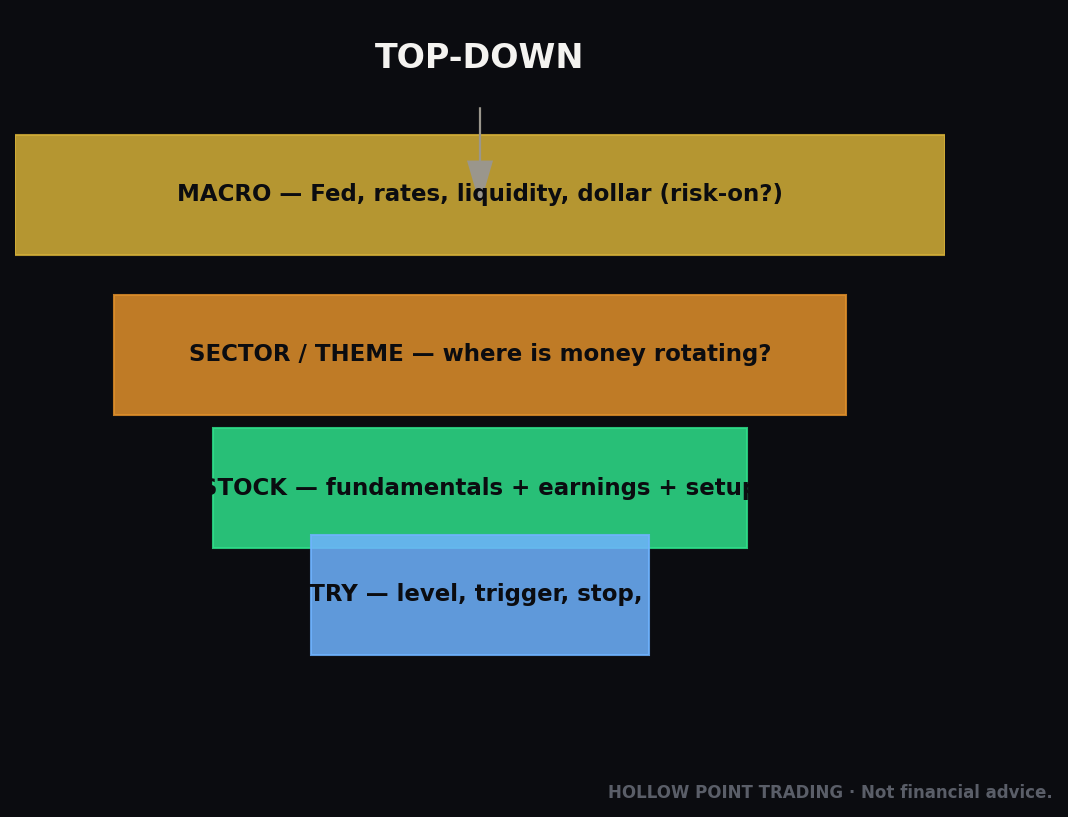
Structure isn't a standalone strategy. It's the first read in Hollow Point's macro → sector → stock funnel, and it's read the same way on every rung.
1. High Timeframe Sets the Bias
Start on the high timeframe to set the bias. Daily and 4H structure tells you the regime. HH/HL on the daily = bullish bias; you're hunting longs. LH/LL = bearish bias; you're hunting shorts. Range = expect chop, trade the edges or stand down. The daily EMA 12/22/55 stack confirms what daily structure already told you — 55 is the trend tell. Structure first, EMAs to confirm.
2. Middle Timeframe Builds the Setup
Drop to the middle timeframe for the setup. On the 1H/15m, wait for structure that aligns with the higher-timeframe bias. Daily's bullish? You want a 15m correction into discount, a liquidity grab of a swing low, and a bullish CHoCH/BOS to trigger. You are using lower-timeframe structure to time an entry in the direction of higher-timeframe structure. That's timeframe-weighted confluence — the higher timeframe gets the heavier vote.
3. Low Timeframe Refines the Entry
Refine entry on the low timeframe. On the 1m/5m, a CHoCH in your favor after the sweep is your fine-tuned trigger, giving you a tight stop and a fat R-multiple. Because the stop sits just beyond the liquidity that already got run, your risk is small and defined — the setup for a clean 1:3 R/R.
4. The Invalidation Is Always a Structure Level
The invalidation is always a structure level. This is the discipline. Your stop isn't a dollar amount or a feeling — it's the price that breaks the structure you're trading. Long off a higher low? The trade is wrong if that higher low breaks on a close. That price, and only that price, is your line. Structure gives you an objective, non-negotiable "I'm wrong here." That's what makes rules enforceable and prediction unnecessary.
Every rung of the funnel — index, sector, name — gets the same three-second read: HH/HL, LH/LL, or range? When all three rungs agree, you have real confluence. When they fight, you have a reason to pass. Structure is the common language that lets the timeframes talk to each other.
The Fractal Nesting You Must Respect
Here's the model that ties the timeframes together: structure is fractal — every higher-timeframe leg is made of lower-timeframe structure. A single daily impulse leg up is, on the 15-minute, a whole sequence of HHs and HLs. A single daily correction down is, on the 15-minute, a small downtrend of LHs and LLs. This is the key insight for entries: when the higher timeframe is correcting in your favored direction, the lower timeframe will show a countertrend that you wait to break.
Concretely — daily is bullish and pulling back. On the 15-minute, that pullback looks like a downtrend (LH/LL). You do not short it, because it's a correction inside a bigger uptrend. Instead you wait for the 15-minute to print a bullish CHoCH — the first sign the pullback is ending — and enter as the lower-timeframe structure flips back into alignment with the daily. The lower-timeframe CHoCH is your timing tool; the higher-timeframe trend is your direction. Marry the two and you're buying the dip with confirmation, not hope.
Structure Across Market Regimes
The same structure rules read differently depending on the market's regime — whether it's trending, chopping, or in a high-volatility blowout. Reading the regime first tells you how much to trust each signal.
Trending Regime
In a clean trend, structure is at its most reliable. BOS after BOS confirms; corrections are shallow and orderly; CHoCHs against the trend mostly fail and resolve as continuation. Your playbook: buy corrections into discount in an uptrend, sell corrections into premium in a downtrend, and largely ignore countertrend CHoCH signals on low timeframes. The trend is your friend and the higher-timeframe structure carries the day. The danger in a trend is impatience — trying to fade it because it "looks extended." Extended trends stay extended; you trade with them until a major CHoCH on a meaningful timeframe says otherwise.
Choppy / Ranging Regime
In chop, the whole vocabulary inverts in usefulness. BOS signals become traps — a "break" of a swing high in a range is usually just price reaching the range ceiling before reversing. CHoCH signals fire constantly and mean little because there's no real trend to change from. Your playbook flips to range logic: fade the edges, respect premium/discount, expect every obvious break to fail. The single most expensive mistake in a chop regime is trading breakout continuation — buying the break of the range high, only to watch it reverse to the range low. In chop, the false break is the base case. If you can't tell whether you're in a trend or a range, assume range until a decisive, high-timeframe BOS proves a trend has started.
High-Volatility Regime
In a high-volatility regime — a news blowout, a gap-and-go, a capitulation flush — structure still works, but the scale changes and wicks get violent. Swings form fast, liquidity grabs are enormous, and stops placed at "normal" distances get vaporized by noise. Your playbook: widen your definition of a valid break (bigger buffers), size down so the wider stop keeps risk constant, and lean heavily on the close-not-wick rule because volatile candles will pierce every level with their wicks and close nowhere near. High-vol regimes are where liquidity grabs are most brutal and most profitable — the sweeps are huge, but so are the reversals. Wait for the reclaim; never front-run the flush.
Combining Structure With Other Tools
Structure is the sentence; the following tools are adjectives that sharpen the read. Used in this order — structure first, tool second — they build genuine confluence instead of contradiction.
Structure + EMAs (12/22/55)
The EMA stack is a trend confirmation layer, not a trend decision layer. When daily structure says uptrend (HH/HL) and price is above a rising, correctly-stacked 12 > 22 > 55, the two agree and your bias is high-conviction. The 55-EMA is the trend tell: in a healthy uptrend, corrections into the 22 or 55 that hold and produce a higher low are prime buy zones — you get structure (the HL) and the EMA (dynamic support) confirming the same price. The disagreement case is the tell too: if structure prints a higher low but price is knifing below a falling 55, the EMA is warning that the trend's momentum has already rolled even though structure hasn't broken yet. That divergence is a reason to demand more confirmation or size down.
Structure + Fibonacci / Golden Pocket
Fibonacci turns "the correction is pulling back" into "the correction should end here." Draw the retracement across the last impulse leg. In a healthy trend, corrections that end in the 0.618–0.65 golden pocket are textbook continuation entries. Stack that with structure: an uptrend impulse leg, a correction into the golden pocket, a liquidity grab of a minor low inside the pocket, and a bullish CHoCH off it — now four things agree at one price. The Fib gives you the zone, structure gives you the trigger and the invalidation (below the pocket / below the swing the Fib is anchored to). Fibs never override structure; they refine where within a correction to expect the structural signal.
Structure + Volume Profile / VWAP
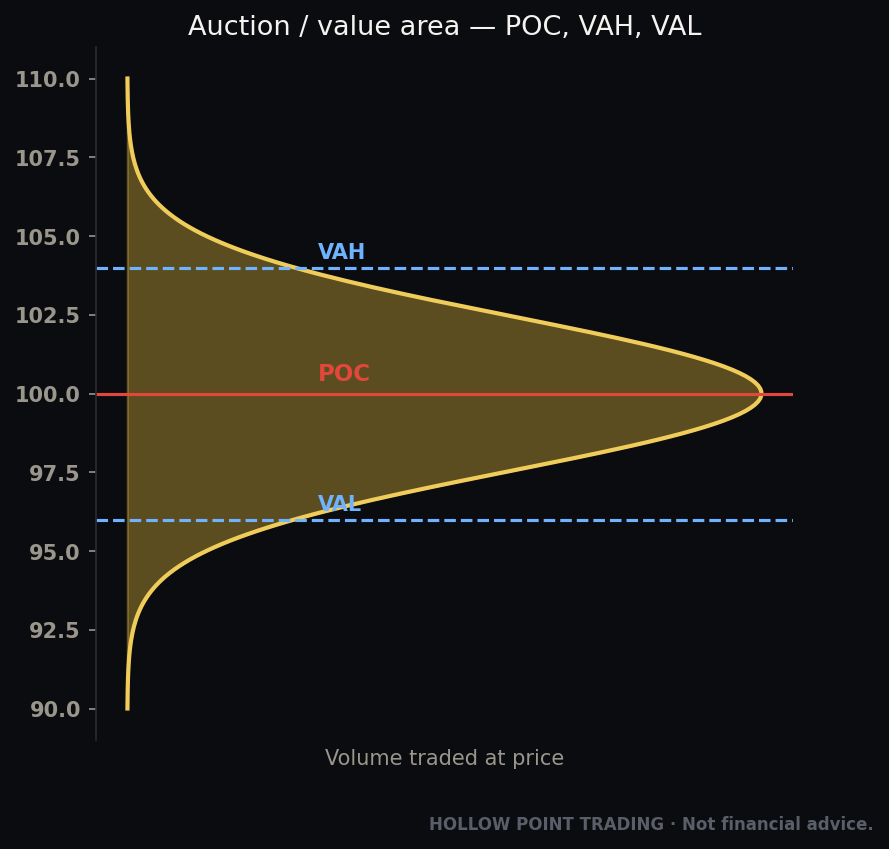
Volume profile and VWAP tell you where the resting business is, which pairs perfectly with liquidity reading. The point of control (POC) and value-area edges are where the most volume traded — high-liquidity shelves that act as magnets and pivots. When a structural level (a higher low) sits on the volume value-area low or on VWAP, you have structure and volume agreeing on the same support, which strengthens the setup. When a liquidity sweep runs price into a low-volume node (a "gap" in the profile), price tends to travel fast through it toward the next high-volume shelf — that's your target logic made concrete. VWAP in particular is where institutions benchmark; a reclaim of VWAP alongside a bullish CHoCH is two independent confirmations that control has flipped.
The rule for all three: the tool is a witness, not the judge. Structure names the trade; the tool corroborates it. When a tool contradicts structure, that's not a veto — it's a reason to demand more confirmation or pass. You never take an indicator signal that fights the structure read.
How the Pros Read Structure Differently From Beginners
The vocabulary is the same. The application is where the gap opens up.
Beginners mark every swing; pros mark the significant ones. A beginner's chart is a mess of dots on every wobble, so their "structure" contradicts itself every few bars. A pro marks the swings that matter — the ones with size, time, and rejection behind them — and gets a clean, stable read.
Beginners treat every CHoCH as a reversal; pros ask "of what structure, on what timeframe." A pro knows an internal-structure CHoCH inside a strong trend usually precedes continuation, while a major-swing CHoCH on the daily is a real regime change. Same word, opposite trades.
Beginners chase breaks; pros wait for the retrace. The beginner buys the BOS candle at the top of the leg with a huge stop. The pro marks the level, waits for price to come back to the higher low, and enters with a tight stop and triple the reward-to-risk.
Beginners see "support"; pros see "liquidity." The beginner buys the obvious double bottom and puts a stop just under it — becoming the fuel. The pro expects that low to get swept first and enters on the reclaim, with a stop beyond the sweep.
Beginners trade one timeframe; pros nest three. The pro sets bias on the daily, times on the 15m, and triggers on the 1m, so every trade is aligned top to bottom. The beginner shorts a 5-minute "top" inside a daily uptrend and wonders why it keeps stopping out.
Beginners predict; pros react and define invalidation. The pro doesn't need to know where price is going. They know the level that proves them wrong, size the position so that level costs a fixed, small amount, and let structure make the call. The beginner is emotionally married to a forecast and moves the stop to avoid being wrong.
Beginners force trades; pros wait for alignment. The pro passes on setups where the timeframes fight, because "no confluence" is itself a decision. The beginner needs to be in a trade and takes the low-conviction one.
Beginners react to the last candle; pros hold the whole map. The pro carries the higher-timeframe structure, the key levels, and the liquidity pools in their head, so a single scary candle doesn't shake them out of a valid thesis. The beginner's entire worldview is the last three bars.
The Common Mistakes
Trading against higher-timeframe structure. Shorting a stock in a daily uptrend because the 5-minute "looks toppy." The higher timeframe wins. Align or stand aside. This is the single most account-draining error because it feels smart — you're catching a top — while you're fighting the strongest force on the chart.
Calling a break on a wick. A wick through a level that closes back inside is usually a liquidity grab, the opposite of a break. Wait for the body close. This one error causes more bad entries than any other, and the fix is free: just wait for the candle to finish.
Treating every CHoCH as a reversal. A CHoCH is a warning, not a signal. In strong trends, low-timeframe CHoCHs are often just deep pullbacks. Let the BOS confirm before you commit to the reversal.
Confusing correction with reversal. A lazy, overlapping counter-move is a pullback to buy. A sharp, impulsive counter-move is a character change to respect. Judge by speed and shape, not by how far it went.
Putting stops at the obvious level. Your stop under the obvious swing low is the liquidity. Place it beyond the sweep, or expect to get run to the tick. The obvious level is exactly where price is designed to go before it reverses.
Over-marking structure. Dotting every tiny wobble as a swing point turns a clean trend into visual soup. Mark the significant highs and lows — the ones your eye finds instantly. If you have to squint to justify a swing, it's noise.
Trading the middle of a range. No edge exists at equilibrium. Trade from the edges or trade the break. The middle is where accounts get chopped, because price whipsaws through the midpoint with no directional information.
Reaching for indicators before naming structure. If you can't say "HH/HL, uptrend, buying discounts" in one sentence, no indicator will save you. Structure first. Always.
Fading a strong trend because it "looks extended." Extension is not a reason to reverse. Trends end with a structural signal — a major CHoCH — not with your feeling that they've gone too far. Wait for the break; don't predict the top.
Buying the breakout in a chop regime. In a range, the base case is that the break fails. Buying the break of the range high, only to ride it back to the range low, is the signature chop-regime death. Fade the edges until a decisive high-timeframe BOS proves a real trend has started.
Moving your stop because you "still believe." The invalidation was the price that breaks the structure. If it breaks, you're wrong — that's the entire point of an objective stop. Moving it turns a small, planned loss into an unplanned large one and destroys the edge that made the setup worth taking.
Ignoring the target-side liquidity. Entering with no idea where price is headed leaves money on the table or has you exit too early. The next liquidity pool — the opposite swing high/low, the equal highs, the round number — is your logical target. Mark it when you enter.
Frequently Asked Questions
What's the difference between BOS and CHoCH again, in one line? Both are a swing point being broken on a close. BOS breaks with the trend (continuation); CHoCH breaks against the trend (first reversal warning). Same event, direction relative to trend flips the meaning.
Do I need a swing-detection indicator? No. Your eye finds significant swings faster and more accurately than a fractal script, which will over-mark noise. Learn to dot the obvious ones by hand; use an indicator only as a training aid if you're unsure, and turn it off once your eye is calibrated.
How many candles make a valid swing? The textbook is three (a lower high on each side of a swing high). But significance matters more than a bar count — a swing price traveled far to reach, took time to build, and clearly rejected from is a real swing regardless of the exact count. Grade by significance, not just mechanics.
What timeframe should I trade structure on? Structure works on all of them because it's fractal. Use at least two: a higher timeframe for bias and a lower one for entry timing. The Hollow Point default is daily/4H for bias, 15m/1H for the setup, 1m/5m to trigger.
How do I know if a range is accumulation or distribution? Look at the prior trend and the failed-break behavior. A range after a downtrend, at support, with springs (failed breakdowns) is likely accumulation — lean long on the break up. A range after an uptrend, at resistance, with upthrusts (failed breakouts) is likely distribution — lean short on the break down.
Price broke my level but it was just a wick — what now? That's usually a liquidity grab, not a break. If it closes back inside on the candle, treat it as a reversal signal in the opposite direction of the wick, not a continuation. Wait for the close before you decide anything.
Where exactly do I put my stop? Beyond the structure that invalidates the trade, and beyond the liquidity pool — not on the obvious swing point where everyone else's stop sits. If you're long off a higher low that got its stops swept, your stop goes under the sweep low, not under the original visible low.
How is this different from support and resistance? Support/resistance are static horizontal levels. Structure is the dynamic relationship between swings over time — it tells you the trend, not just a level. Structure also explains why a support level breaks or holds (liquidity, accumulation), which raw S/R can't.
Can structure be wrong? Structure isn't a prediction, so it can't be "wrong" — it's a description of what price has done. What can be wrong is your trade thesis, and structure gives you the exact price that proves it wrong (the invalidation). That's the feature, not a bug: you always know where you're wrong before you enter.
What if the timeframes disagree? That's a pass, or a much smaller, faster trade. When the daily says up and the 15m says down, you either wait for them to align or you take only the higher-timeframe-aligned setups. Fighting timeframes is a reason to do nothing, and doing nothing is a valid, profitable decision.
The Cheat-Sheet: Read Any Chart in 30 Seconds
Run this sequence, top to bottom, on every chart before you touch an indicator:
1. Name the structure. Dot the obvious swing highs and lows. HH + HL = uptrend. LH + LL = downtrend. Equal highs/lows = range. Say it out loud.
2. Set the bias from the higher timeframe. Daily/4H structure = your directional lean. Trade with it, not against it.
3. Read the regime. Trending (trust BOS, buy corrections), chopping (fade edges, expect breaks to fail), or high-vol (widen stops, size down, wait for reclaims)?
4. Locate price in the structure. Trending: is this an impulse (stand aside / let it run) or a correction (get ready to join)? Ranging: is price in premium (favor shorts) or discount (favor longs)?
5. Watch the key level. Uptrend → the last higher low is the line. Downtrend → the last lower high is the line. Range → the edges.
6. Classify the break.
- Break with trend (through prior HH or LL) on a close = BOS → continuation.
- Break against trend (through last HL or LH) on a close = CHoCH → reversal warning; wait for BOS to confirm.
- Wick through that closes back inside = liquidity grab → fade it.
7. Find the liquidity. Obvious highs/lows, equal highs/lows, round numbers, prior-day and session levels = pools. Expect the sweep before the real move. Put your stop beyond the pool, not on it. The opposite pool is your target.
8. Define invalidation. The exact price that breaks your structure, beyond the sweep. That's your stop. If you can't name it, you don't have a trade.
9. Only now, add indicators. EMA 12/22/55 to confirm trend, Fib/golden pocket to refine the correction zone, VWAP/volume profile for level and target confluence, RSI/volume for divergence and conviction. They confirm the structure read — they never override it.
The Quick Reference Table
- Swing high — candle higher than neighbors on both sides. Mark significant ones only.
- Swing low — candle lower than neighbors on both sides. Mark significant ones only.
- HH + HL — uptrend. Buy discounts/corrections. Watch the last higher low.
- LH + LL — downtrend. Sell premium/rallies. Watch the last lower high.
- Range — equal-ish highs/lows. Fade edges (wide range) or trade break (tight range).
- BOS — close through swing with trend. Continuation. Enter the retrace, not the break.
- CHoCH — close through swing against trend. Reversal warning. Wait for BOS to confirm.
- Impulse — big bodies, one direction, rising volume. Trade with it.
- Correction — small overlapping bodies, drifting, fading volume. Enter at its end.
- Premium — above range midpoint. Favor shorts.
- Discount — below range midpoint. Favor longs.
- Spring — failed breakdown below range low. Accumulation signature → lean long.
- Upthrust — failed breakout above range high. Distribution signature → lean short.
- Liquidity pool — resting orders above highs / below lows / at round numbers. Gets run first.
- Liquidity grab / stop hunt — sharp poke beyond a level that reverses on the close. Fade it.
- Invalidation — the price that breaks your structure, beyond the sweep. Your stop.
If you internalize nothing else: price is trending up, trending down, or ranging — and the last swing point in the trend direction is the line that decides which. Everything else is detail. Name the structure first, every time, and you'll never again stare at a loaded chart with no idea what to do. You'll already know what price is doing — because you learned to read the sentence before you started counting the adjectives.
That's the job. Not predicting the next candle. Reading the one in front of you, knowing the price that proves you wrong, and letting the structure — not your hope — make the call.
Bound by rules, feared by trade.