
If you have ever looked at an options screen and felt your eyes glaze over, you are in exactly the right place. Today we are going to take one of the most useful — and most misunderstood — ideas in all of options trading and make it so plain that you could explain it to a friend at dinner tonight.
The idea is the spread. And within spreads, there are two flavors: the kind where you pay money to get in (a debit spread) and the kind where you get paid to get in (a credit spread). By the end of this guide you will know what each one is, exactly how it makes or loses money, when to reach for each, and — most importantly — how to keep a small mistake from ever becoming a big one.
We are going to move slowly. Every new word gets defined the moment it appears. There are lots of small examples with real-ish numbers. Let's go.
First, a five-minute refresher on options
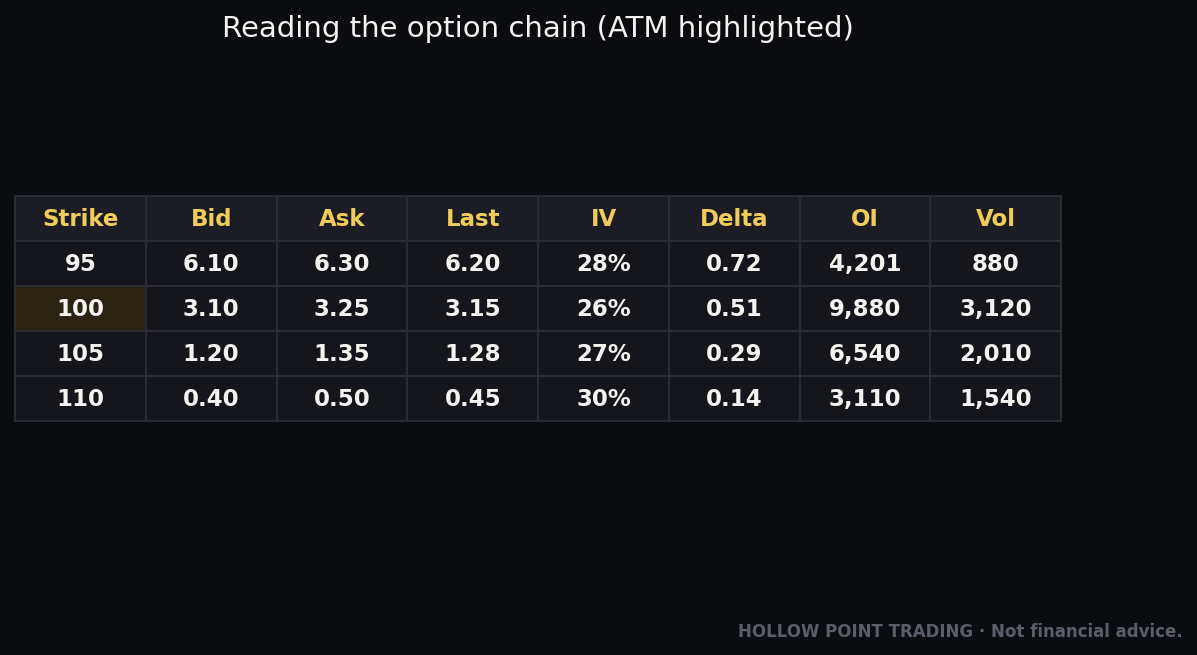
You cannot understand a spread until you understand the single building block it is made from: the option contract. So let's nail that down first, in plain English.
An option is a contract that gives you the right, but not the obligation, to buy or sell a stock at a set price, before a set date. Two words in there matter a lot:
- Right, not obligation means you get to choose. You can walk away.
- Set price is called the strike price (or just "strike"). It is the price written into the contract — the price at which the deal happens if you use it.
There are two types of options:
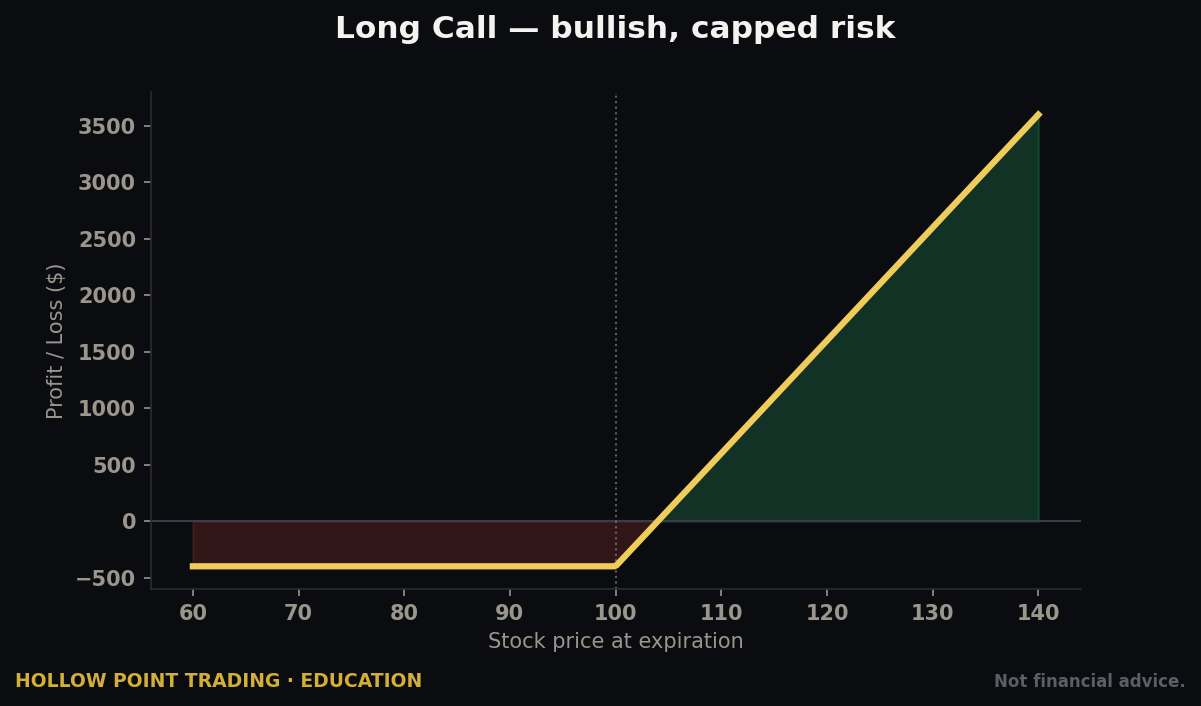
- A call option gives you the right to buy a stock at the strike price. You buy calls when you think the price is going up.
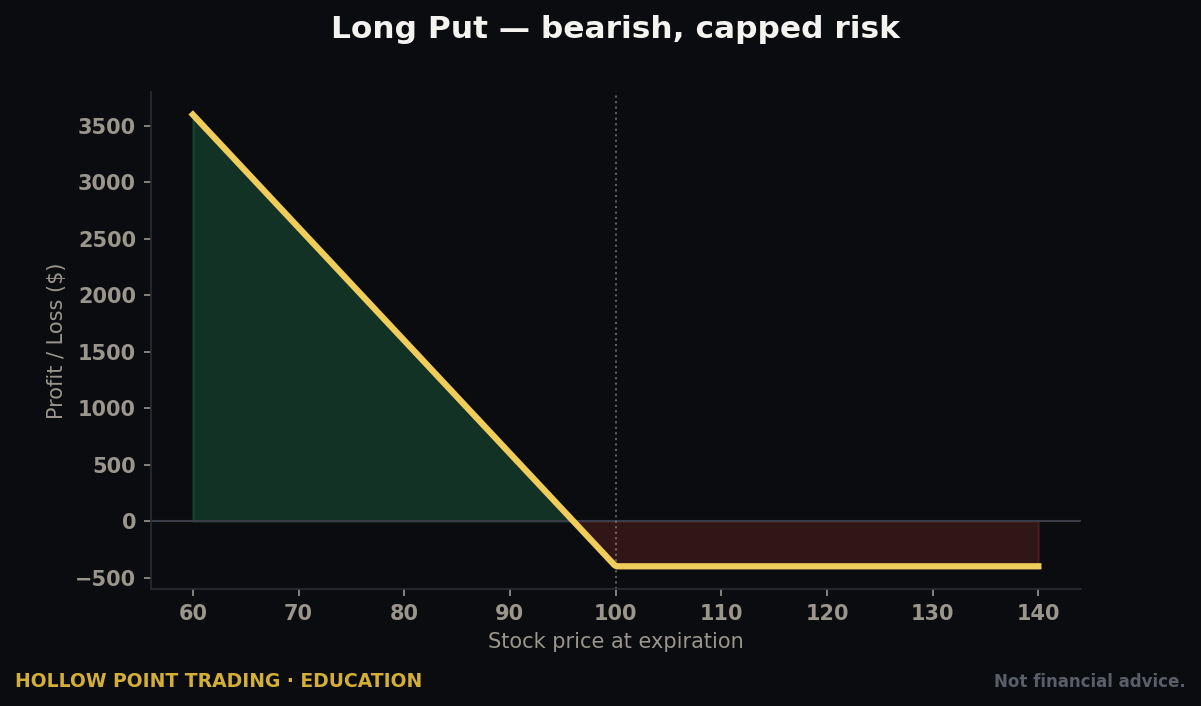
- A put option gives you the right to sell a stock at the strike price. You buy puts when you think the price is going down.
Two more essential terms:
- Expiration date — the deadline. After this date, the option is done. It either got used or it expired worthless.
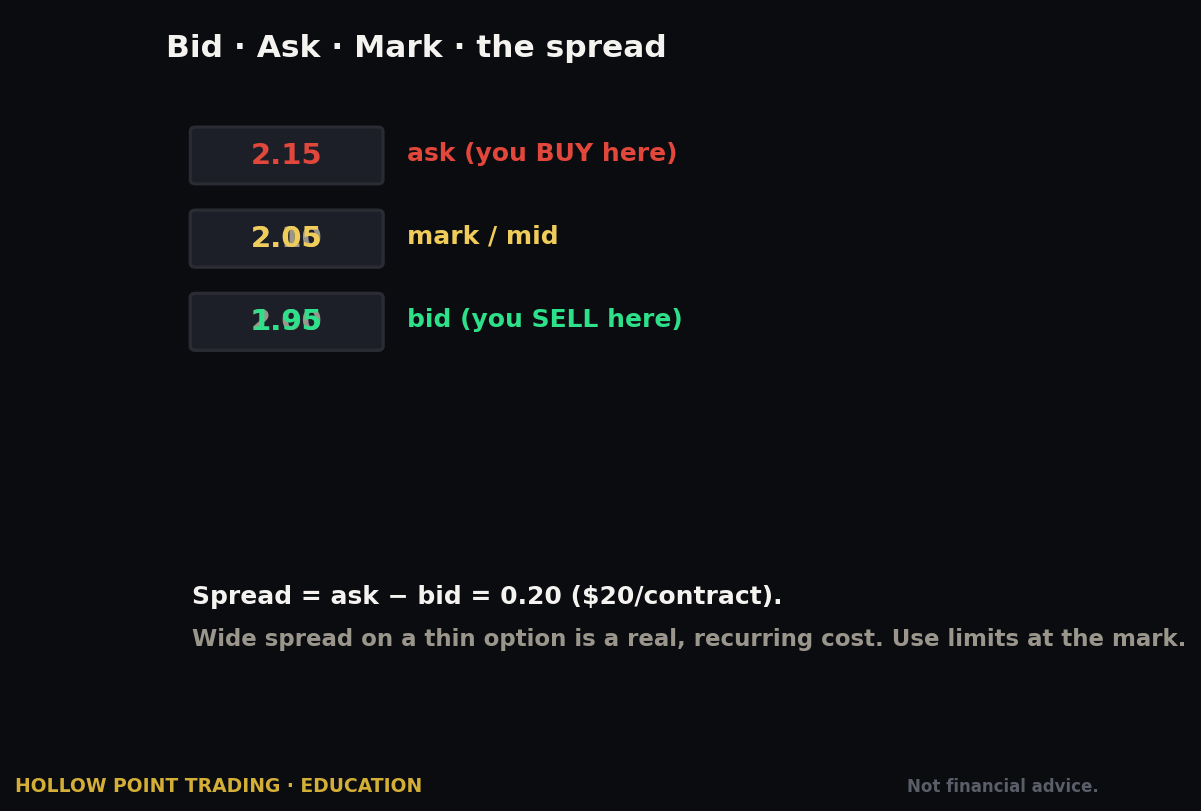
- Premium — the price you pay to buy an option, or the money you collect if you sell one. Think of premium as the sticker price of the contract itself.
One crucial detail that trips up every beginner: one option contract almost always controls 100 shares of stock. So if an option is quoted at "$2.00," you do not pay $2. You pay $2 × 100 = $200. We will use this multiplier constantly, so tattoo it on your brain: quoted price times 100.
That is genuinely all the background you need. Now let's build a spread.
What is a spread? (The plain-English version)
A spread is when you buy one option and sell another option at the same time, on the same stock, usually with the same expiration date — but at different strike prices.
That's it. Two options, working as a team. You are not placing two separate bets; you are placing one bet made of two pieces that balance each other out.
Here is the intuition. When you buy an option by itself, you pay full price and you have unlimited potential — but you also bleed money as time passes and you can lose the entire premium. It's like buying a lottery ticket: cheap thrill, usually a loser. A spread tames that. By selling a second option against the one you bought, you use the money from the sale to offset your cost. You give up some of the upside in exchange for a cheaper, safer, more defined trade.
The magic word there is defined. In a spread, you know your absolute worst-case loss before you ever place the trade. That is the whole reason spreads exist, and it's why they are the perfect training wheels for a new options trader. You are never exposed to a surprise that wipes out your account.
Now — the two options you combine can net out in one of two directions. Either the one you bought costs more than the one you sold (so you pay the difference), or the one you sold brings in more than the one you bought costs (so you collect the difference). Those two outcomes are our two heroes:
- Pay the difference → debit spread
- Collect the difference → credit spread
Let's take them one at a time.
Debit spreads: paying to get in
A debit simply means money leaving your account. (Just like a debit card takes money out.) A debit spread is a spread where, on balance, you pay to enter. The option you buy is more expensive than the option you sell, so cash flows out of your account when you open the trade.
You use a debit spread when you have a directional opinion — you think the stock is going to move, and you know which way. You are the one making the bet, and you pay a small entry fee to place it.
There are two everyday kinds:
- A bull call spread — you think the stock goes up. Built from calls.
- A bear put spread — you think the stock goes down. Built from puts.
Let's walk one all the way through.
How a bull call spread works, step by step
Imagine a stock — we'll call it XYZ — trading at $100. You think it's heading higher over the next month, toward maybe $108. Here's how you build a bull call spread:
Step 1 — Buy the closer call. You buy a call with a strike of $100 (the right to buy XYZ at $100). Let's say it costs $4.00, which is $400 real money.
Step 2 — Sell a farther call. At the same time, you sell a call with a strike of $105. Someone pays you $2.00 for it — that's $200 into your pocket. (Selling an option means you collect premium now, but you take on an obligation, which we'll cover.)
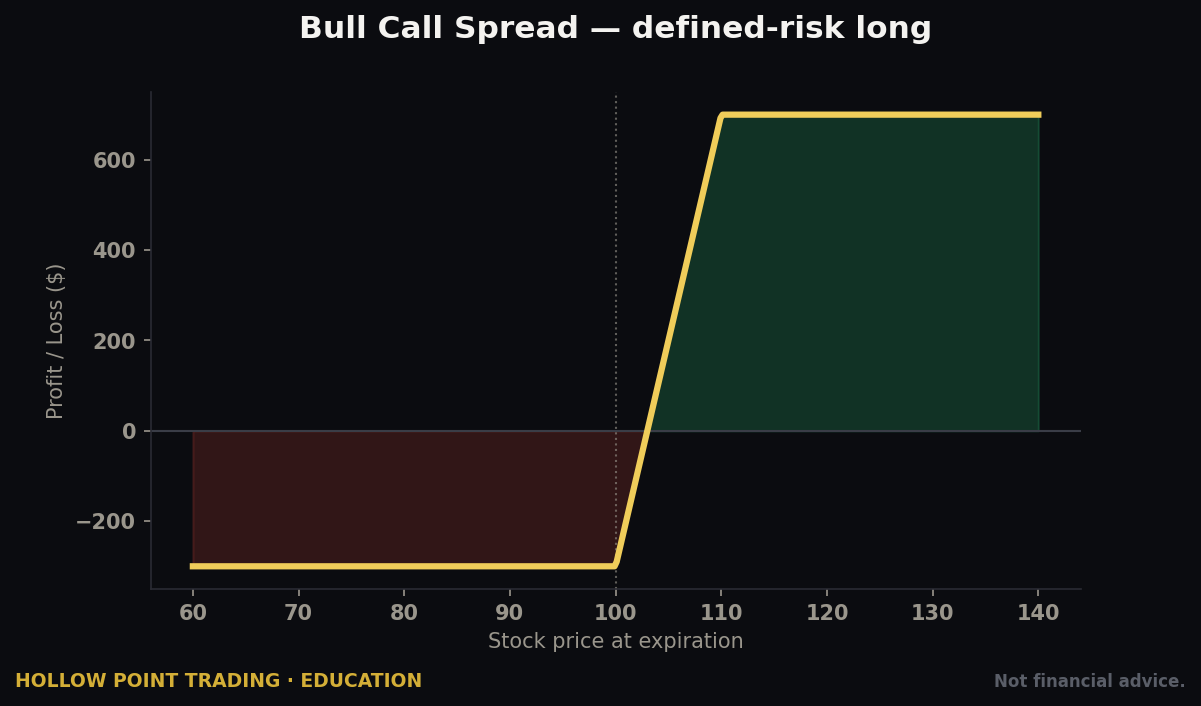
Step 3 — Net it out. You paid $400 and collected $200. Your net cost is $400 − $200 = $200. That $200 is your debit — the money you spent to own this trade. Because one contract is 100 shares, your quoted numbers were $4.00 − $2.00 = $2.00 net, times 100 = $200.
Now here is the beautiful part — the numbers you can calculate before risking a dime:
- Maximum loss = the amount you paid = $200. That's it. If XYZ crashes to $50, you still only lose $200. The trade cannot hurt you more than your entry cost.
- Maximum gain = the distance between your two strikes, minus what you paid. The strikes are $105 and $100, a distance of $5 (which is $500 for 100 shares). Subtract your $200 cost: $500 − $200 = $300.
- Breakeven = your lower strike plus what you paid per share = $100 + $2.00 = $102. Above $102 at expiration, you're in profit.
Let's see it play out at expiration in three scenarios:
- XYZ finishes at $108 (you were right). Your $100 call is worth $8. Your sold $105 call is worth $3 — but you owe that, since you sold it. Net value: $8 − $3 = $5 per share = $500. You paid $200. Profit: $300. That is your maximum. Notice you don't get more even though the stock ran to $108 — the sold call capped your gain at the $105 strike. That cap is the price you paid for a cheaper, safer trade.
- XYZ finishes at $103 (you were partly right). Your $100 call is worth $3; your $105 call is worthless (nobody exercises the right to buy at $105 when the stock is $103). Net value: $300. You paid $200. Profit: $100.
- XYZ finishes at $97 (you were wrong). Both calls expire worthless. Net value: $0. Loss: your full $200 — and not a penny more.
Sit with that last line for a second. You had a strong directional opinion, you were flat wrong, the stock fell three dollars against you — and your loss was exactly the small, known amount you decided on before you clicked buy. That is what "defined risk" feels like.
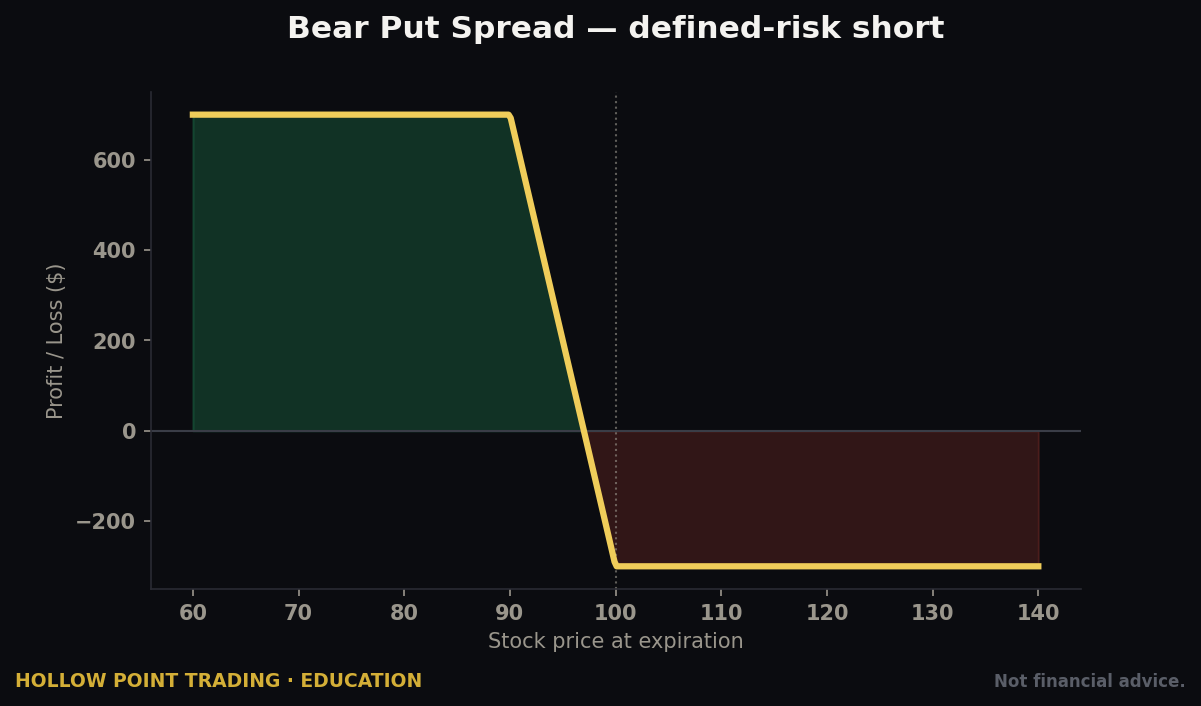
The bear put spread is the mirror image: you buy a put at a higher strike and sell a put at a lower strike, you pay a debit, and you profit when the stock falls. Same math, opposite direction.
Credit spreads: getting paid to get in
A credit means money coming into your account. A credit spread is a spread where you collect cash the moment you open it. Here, the option you sell is more expensive than the option you buy, so the net cash flow is into your account.
If a debit spread is making a bet, a credit spread is more like being the house — you collect a premium up front, and you get to keep it as long as the stock doesn't do a specific thing. You are essentially getting paid to be patient and to be right about a level the stock won't cross.
The two everyday kinds:
- A bull put spread — you think the stock will stay up (or at least not fall below a certain level). Built from puts.
- A bear call spread — you think the stock will stay down (or at least not rise above a certain level). Built from calls.
How a bull put spread works, step by step
Same stock, XYZ at $100. This time your opinion is softer: you don't necessarily think it will rocket up — you just think it won't fall below $95 over the next month. A credit spread lets you get paid for that view.
Step 1 — Sell the closer put. You sell a put with a strike of $95, collecting $2.00 ($200). By selling it, you take on an obligation: if XYZ falls below $95, you may be forced to buy shares at $95.
Step 2 — Buy a farther put for protection. You buy a put with a strike of $90, paying $1.00 ($100). This is your insurance policy — it caps how badly the trade can go against you.
Step 3 — Net it out. You collected $200 and spent $100. Your net credit is $100. That $100 lands in your account today, and it is the most you can possibly make on the trade.
The pre-calculated numbers:
- Maximum gain = the credit you collected = $100. Full stop. The best case is that you simply keep everything you were paid.
- Maximum loss = the distance between strikes, minus the credit. Strikes $95 and $90 are $5 apart ($500), minus your $100 credit = $400.
- Breakeven = the strike you sold minus the credit per share = $95 − $1.00 = $94. As long as XYZ stays above $94, you make money.
The three scenarios at expiration:
- XYZ finishes at $100 (you were right — it stayed up). Both puts expire worthless. Nobody wants to sell at $95 or $90 when the stock is $100. You owe nothing, and you keep the full $100 credit. Maximum gain, achieved by the stock simply not doing the bad thing.
- XYZ finishes at $94 (right at breakeven). Your sold $95 put is worth $1; your bought $90 put is worthless. You owe $1 per share = $100, exactly offset by the $100 you collected. You break even.
- XYZ finishes at $88 (you were wrong — it fell hard). Your sold $95 put is worth $7 (you owe it); your bought $90 put is worth $2 (protects you). Net you owe $7 − $2 = $5 per share = $500. Subtract the $100 you kept: loss of $400 — your defined maximum. Even though XYZ cratered to $88, your protective long put stopped the bleeding at $400.
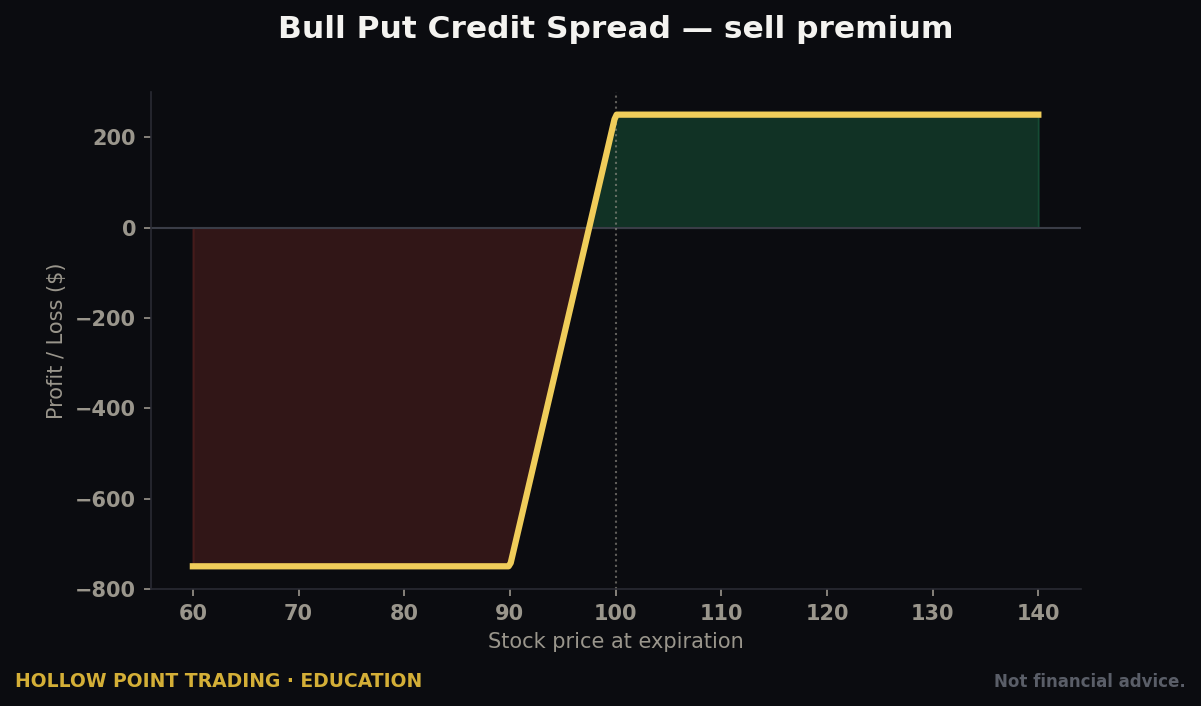
Notice the personality difference. With the credit spread, your best outcome is a small, known gain and your worst is a larger, known loss. It's the reverse shape of the debit spread. You win often (the stock just has to avoid one zone), but each win is capped and each loss is bigger than each win. With the debit spread, you win less often (the stock has to actually move your way), but the winners are bigger than the losers. Keep that contrast in your pocket — it's the heart of choosing between them.
Paying vs. getting paid: the honest trade-off
Beginners often assume "getting paid to enter" must be better than "paying to enter." It sounds like free money. It is not. Here is the honest accounting.
When you pay (debit spread), you have a small, fixed cost and a larger potential reward. You're risking a little to make a lot — but you need to be right about direction and timing, or your cost quietly erodes to zero.
When you get paid (credit spread), you collect a small, fixed reward and carry a larger potential loss. You win as long as the stock doesn't cross your line — which happens fairly often — but a single bad move can cost you several winners' worth. You're risking a lot to make a little, more frequently.
Neither is "better." They are tools for different opinions:
- "I think it's going to MOVE, and I know which way." → Pay. Use a debit spread. You want a big move; you're happy to pay a small fee for a bigger payoff.
- "I think it's going to STAY — above or below some level — or just chop sideways." → Get paid. Use a credit spread. You want nothing dramatic to happen; you're happy to collect a premium for standing still.
There is one more subtle force worth naming in plain English: time decay. Every option loses a little value every day it exists, simply because there's less time left for the stock to move. This daily erosion is called theta (from the Greek letter traders use for it). Here's the key:
- Time decay hurts the debit-spread buyer — you own net options, and they melt a bit each day, so you need the move to happen before your ice cube shrinks.
- Time decay helps the credit-spread seller — you sold net options, so as they melt, the amount you might owe shrinks, and the trade drifts in your favor just by the calendar turning.
That's why credit spreads are often called "time is on your side" trades and debit spreads are "time is against you" trades. It's not a reason to always pick one — it's just another input into matching the tool to your view.
A fully worked beginner example, start to finish
Let's do one complete trade the way you'd actually think through it Monday morning, using the HPT way of reasoning from the big picture down to the single trade.
The setup. It's a calm week. The overall market (think of a broad index like the S&P 500) is grinding gently higher — no panic, no euphoria. The technology sector is holding up fine. Within it, a stock we'll call TECHCO is trading at $200, sitting quietly above a price floor it has bounced off three times at $190. Nothing about the chart says "explosion." It says "steady."
The opinion. You do not have a strong "this rockets to $220" view. You have a "this probably doesn't break $190" view. That is a stay opinion, not a move opinion.
The tool. A stay opinion → get paid → credit spread. Specifically a bull put spread, betting TECHCO stays above your line.
The construction.
- Sell the $190 put, collect $3.00 ($300).
- Buy the $185 put for protection, pay $1.50 ($150).
- Net credit: $1.50 = $150 collected today.
The pre-trade math (always do this before clicking):
- Max gain: $150 (the credit).
- Strike distance: $190 − $185 = $5 = $500. Max loss: $500 − $150 = $350.
- Breakeven: $190 − $1.50 = $188.50.

The HPT risk check. Here's where a disciplined trader stops and asks the question that separates survivors from tourists: is this trade shaped right? Hollow Point's baseline is a 1:3 reward-to-risk target — for every $1 you're willing to lose, you want a shot at making $3. This trade risks $350 to make $150 — that's roughly 1:0.4, the opposite shape. Credit spreads are naturally lopsided this way. That doesn't make them forbidden, but it does mean you only take them when your read on the "stay" zone is genuinely strong, your position is small, and you have a plan to cut the loss early rather than ride it to the max. We'll come back to this in the mistakes section, because it is the single most important discipline in the whole guide.
The outcome. Three weeks pass. TECHCO wobbles between $196 and $205 but never comes close to $190. On expiration day it's at $201. Both puts expire worthless. You keep the full $150. The stock did nothing dramatic — exactly what you wanted — and you got paid for correctly predicting boredom.
The alternative universe. Suppose instead your read had been "TECHCO is about to break OUT to the upside on earnings." That's a move opinion. You'd flip to a debit spread — buy the $200 call, sell the $210 call, pay maybe $3.00 ($300) net. Max loss $300, max gain $700, and now the reward-to-risk is a friendly 1:2.3, much closer to the HPT ideal. Same stock, same day, opposite tool, because the opinion was different. Internalize that and you've understood the whole guide.

The beginner mistakes to avoid
Every new spread trader steps on the same rakes. Here are the big ones, and how to sidestep them.
1. Forgetting to multiply by 100. A spread quoted at "$2.00 net" is $200 of real money, and its max loss might be "$3.00" = $300. Beginners size positions off the small quoted numbers and get a shock. Always translate to real dollars before you commit.

2. Confusing "wins often" with "wins overall." Credit spreads win a high percentage of the time, which feels amazing — until one loss erases five wins because the loss is bigger than each win. A high win-rate is not the same as making money. Track your dollars, not your streak.
3. Riding a credit spread to maximum loss. The most expensive beginner habit alive. Because credit spreads win so often, beginners freeze when one goes wrong, hoping it comes back — and it rides from a $50 loss to the full $350. Decide in advance: "If my loss hits roughly 1.5–2× the credit I collected, I close it." Small, planned exits are what keep the math survivable.
4. Trading too big. With defined risk it's tempting to think "I can only lose $350, so who cares." But five of those at once is $1,750, and correlated stocks can all go wrong on the same day. A common beginner guardrail: risk no more than 1–2% of your account on any single trade. On a $10,000 account, that's $100–$200 of max loss per trade — which might mean trading a single narrow spread, and that's fine.
5. Picking strikes at random. The strikes are not arbitrary. In a credit spread, the strike you sell should sit beyond a real level the stock respects — a support floor, a resistance ceiling. In a debit spread, your strikes should bracket the move you actually expect. Strikes chosen off a chart level beat strikes chosen off a feeling, every time.

6. Ignoring expiration timing. Options that expire in a few days decay violently; options months out barely move day to day. Beginners often pick expirations that are far too short, then watch time decay shred a debit spread before the move arrives. A gentle starting zone is 2 to 6 weeks out — enough time to be right, not so much that your money is tied up forever.
7. Letting an option get "assigned" by surprise. When you sell an option (which you do in both spread types), you can be assigned — forced to honor the contract — especially if it's deep in-the-money near expiration. The clean beginner rule: close your spread before expiration rather than letting it expire, so you never deal with surprise share obligations. Take the trade off the table; don't let it resolve itself in ways you don't control.
8. Confusing the two spreads under pressure. When money's on the line, beginners blank on which is which. Anchor it forever: Debit = you paid (Debit card takes money out). Credit = you were paid (Credit lands in your account). Say it out loud before every trade.
The cheat-sheet: your one-page decision guide
Print this. Tape it near your screen. Read it before every single spread.

Step 1 — What's my opinion?
- Stock will MOVE (and I know the direction) → I want a debit spread.
- Stock will STAY put / chop / hold a level → I want a credit spread.
Step 2 — Which flavor?
| My view | Spread | I buy | I sell | Cash flow |
|---|---|---|---|---|
| Up, big move | Bull call (debit) | Lower call | Higher call | Pay |
| Down, big move | Bear put (debit) | Higher put | Lower put | Pay |
| Won't fall below level | Bull put (credit) | Lower put | Higher put | Get paid |
| Won't rise above level | Bear call (credit) | Higher call | Lower call | Get paid |
Step 3 — Do the four numbers BEFORE clicking:
- Max loss (debit: what I paid; credit: strike distance − credit)
- Max gain (debit: strike distance − paid; credit: the credit)
- Breakeven
- Reward-to-risk ratio — is it anywhere near HPT's 1:3 goal? If it's ugly, is my read strong enough to justify it?
Step 4 — Risk gates (all must pass):
- Max loss ≤ 1–2% of my account. ✔
- Strikes sit at real chart levels, not guesses. ✔
- Expiration is ~2–6 weeks out. ✔
- I have a written exit plan for when I'm wrong. ✔
Step 5 — After entry:
- Set an alert at breakeven.
- Plan to close before expiration, win or lose.
- If a credit spread's loss hits ~1.5–2× the credit, close it. No hoping.
How this fits the bigger Hollow Point picture
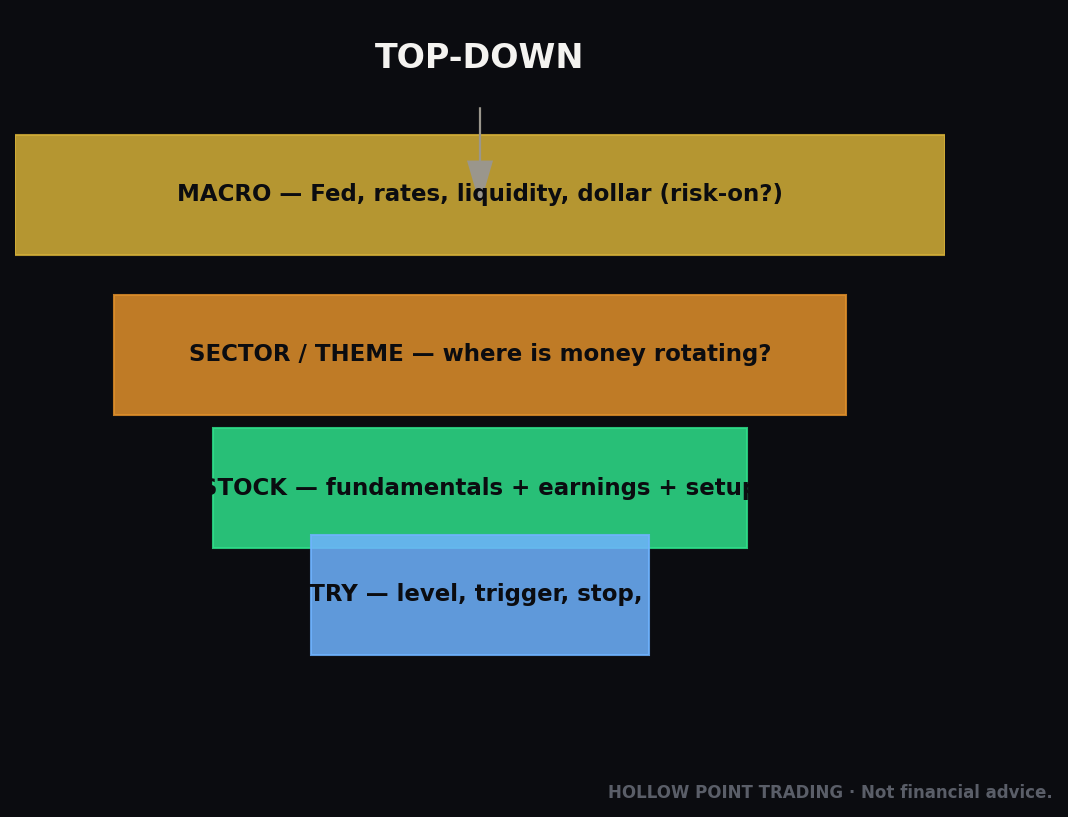
Spreads are not a strategy on their own. They are the delivery vehicle for a strategy — the disciplined tool you reach for once your homework already told you what to expect. At Hollow Point, that homework flows in one direction: macro, then sector, then stock.
You start with the macro picture — is the broad market calm, trending, or fragile? That tells you whether "move" trades or "stay" trades even make sense this week. In a jumpy, headline-driven market, stay trades (credit spreads) get run over; in a quiet, trending one, they thrive. Then you drop to the sector — is money flowing into this corner of the market or out of it? Only then do you get to the individual stock and its chart levels, where the strike prices actually live. The spread is the last decision, not the first.
This is also where the deepest HPT principle lands: protect capital first, chase profit second. Spreads exist because they make your worst case knowable and small before you ever risk a dollar. That is not a limitation — it is the entire point. A trader who never blows up gets to keep playing, and the trader who keeps playing is the one who eventually wins. Defined risk is how beginners survive their beginner mistakes — and you will make some.
Notice, too, how spreads bake in the discipline HPT preaches. A naked lottery-ticket option tempts you to hope and hold. A spread has your exit built into its structure — the max loss is a wall you set yourself. It quietly enforces "discipline over prediction." You are not trying to be a genius who calls the market perfectly. You are trying to be a professional who manages risk so well that being right just often enough is more than enough.
Start small. Trade one narrow spread with money you could set on fire without changing your life. Do the four numbers every time. Keep a simple log — what you thought, what you did, what happened. After twenty trades you'll have something no article can give you: your own evidence about which setups you read well and which you don't. That log is worth more than any tip.
Debit or credit. Pay or get paid. Move or stay. It really does come down to matching one honest opinion to the right tool, sizing it so a loss can't hurt you, and letting your rules — not your feelings — hold the wheel.
That's the whole game. Now go read your charts, do your four numbers, and trade like the house instead of the gambler.
Bound by rules, feared by trade.