
Imagine you're about to drive across the country for the first time. You wouldn't just start the engine and guess at every turn. You'd get a map, decide your route, plan where to stop for gas, and figure out how much money the trip costs. A trading plan is that map — except the road is the market, and running out of gas means running out of money.
Here's the honest truth most beginners learn the hard way: the market does not care how smart you are. It does not care how much you read, how good your gut feels, or how badly you need the money. The only thing that protects you is a written set of rules you decided on before your money was on the line — when your brain was calm instead of panicking. That written set of rules is your trading plan.
This guide walks you through building your first one, from a completely blank page. By the end you'll have a real, usable, one-page plan you could print out and follow on Monday morning. No prior knowledge assumed. Every term defined. Let's build it.
What a Trading Plan Actually Is (in plain English)
A trading plan is a written document — literally one page is fine to start — that answers, in advance, every important question you'll face while trading. What will I trade? When will I trade it? What has to be true before I risk money? How much will I risk? When do I get out if I'm wrong? When do I get out if I'm right?
Think of it like a recipe. A recipe tells you the ingredients, the amounts, the steps, and the oven temperature. You don't reinvent the dish every time you're hungry — you follow the recipe, and you get a predictable result. A trading plan does the same thing for your money. It removes the moment-to-moment guessing that destroys beginners.
A quick definition before we go further. Trading means buying something (a stock, a currency, a futures contract) hoping to sell it later for more than you paid — or "selling short," which is a more advanced move where you profit if the price goes down. For now, just picture buying low and selling higher. The plan is the framework that tells you which thing to buy, when, and how much.
Why does a beginner specifically need this? Because beginners feel emotions the strongest and have the least experience managing them. When real money moves, your heart rate spikes. Greed whispers "hold longer." Fear screams "sell now." A plan is the calm, rational version of you leaving instructions for the panicked version of you. It's the difference between a professional and a gambler.
Step One: Choose Your Market (What You'll Trade)
A market is simply the arena where a certain type of thing is bought and sold. You cannot trade "everything." You pick one arena and get good at it. Here are the beginner-friendly options, defined simply:
- Stocks (equities): Tiny ownership slices of a company. Buy a share of Apple, you own a microscopic piece of Apple. Prices move on company news, earnings, and the overall economy. Beginner-friendly because they're intuitive — you already know these companies.
- Futures: A contract to buy or sell something at a set price on a future date. The most popular for traders is a stock index future — a single instrument that moves with a whole basket of stocks at once. Powerful but fast-moving; usually a step-two market, not day one.
- Forex (foreign exchange): Trading one country's money against another's, like US dollars versus euros. Open 24 hours, but the price drivers (interest rates, central banks) are abstract for beginners.
- Crypto: Digital currencies like Bitcoin. Open 24/7, extremely volatile ("volatile" means big, fast price swings), and unforgiving for a new trader.
The beginner rule: pick ONE market and stay there for at least three months. Mastery comes from repetition on the same instrument, not from dabbling in five. Most beginners should start with a small handful of large, well-known stocks or a single index-tracking fund, because they move in ways that are relatively steady and heavily reported in the news.
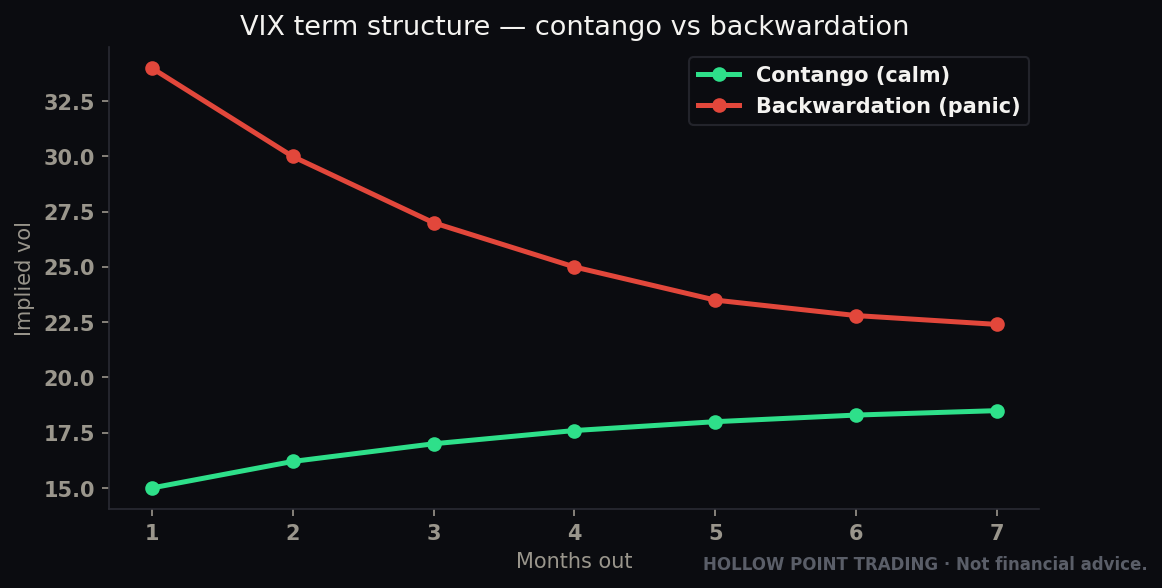
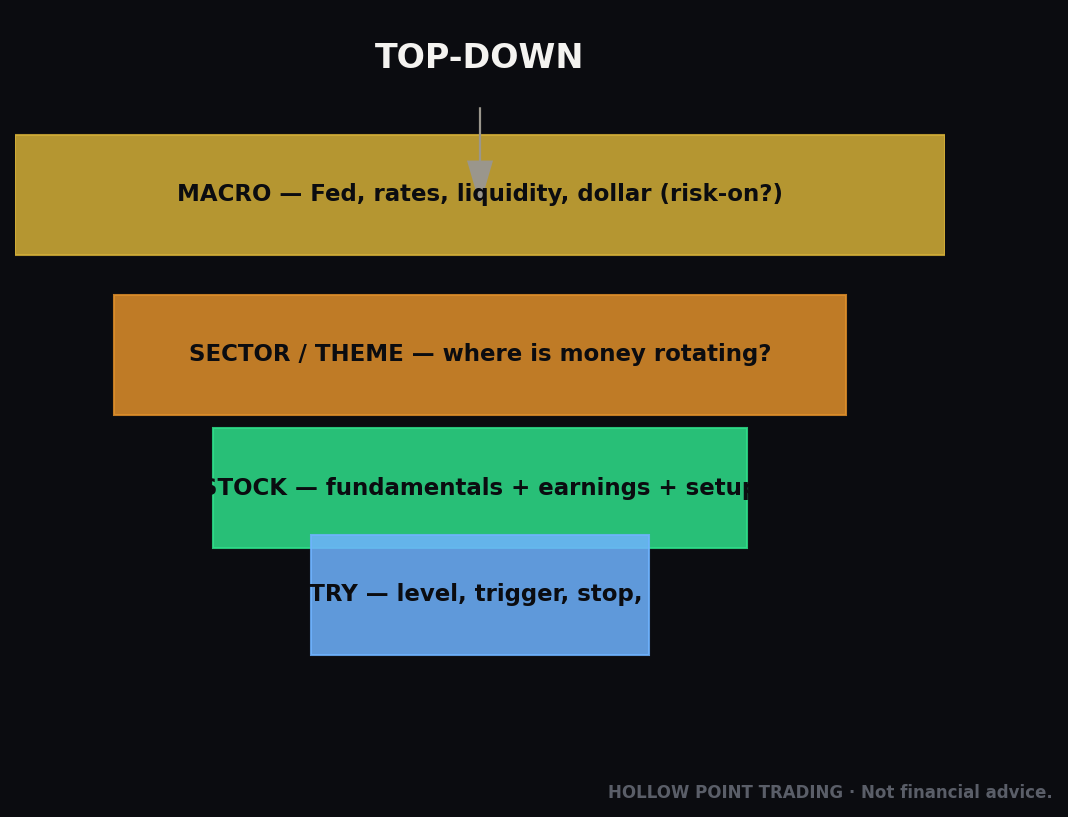
This is also where the Hollow Point Trading (HPT) way of thinking begins. HPT teaches a top-down approach: macro → sector → stock. In plain English:
- Macro is the big picture — is the overall market (and economy) healthy or scared today?
- Sector is the neighborhood — technology, energy, banks, healthcare. Some neighborhoods are strong while others are weak.
- Stock is the individual house on that street.
You don't buy a house in a burning neighborhood in a collapsing city. You want a strong stock, in a strong sector, in a healthy overall market. Choosing your market is just the first layer of that funnel.

Worked example: Maria decides her market is US large-company stocks. She narrows to a watchlist of five names she understands: Apple, Microsoft, Coca-Cola, Nike, and Visa. That's it. She's not watching 200 tickers — she's watching five. When she checks the macro (broad market up on the day) and sector (technology strong), she leans toward Apple or Microsoft. That funnel just did half her thinking for her.
Step Two: Choose Your Timeframe (When You'll Trade)
A timeframe is how long you hold a trade and, related to it, how "zoomed in" your chart is. A chart is just a picture of price over time. Each little candle or bar on it represents a chunk of time — one minute, one hour, one day. A 1-minute chart shows a new bar every minute (very zoomed in, very noisy). A daily chart shows one bar per day (zoomed out, calmer).
Here are the main trading styles, defined by timeframe:
- Scalping: Holding for seconds to minutes, many trades a day. Extremely fast and stressful. Not for beginners.
- Day trading: Opening and closing all trades within the same day, holding nothing overnight. Fast-paced, requires focused screen time.
- Swing trading: Holding for a few days to a few weeks. You check the market once or twice a day. This is usually the best starting point for a beginner — slower pace, fewer decisions, less emotional whiplash.
- Position/investing: Holding for months or years. Closer to investing than active trading.
The beginner rule: start slower than you think you should. New traders are drawn to fast timeframes because they look exciting and promise quick money. In reality, faster timeframes mean more decisions per hour, and every decision is a chance to make an emotional mistake. Swing trading on the daily chart gives your slow, rational brain time to actually work.
HPT also uses the idea of timeframe confluence — a fancy phrase for "do multiple timeframes agree?" Confluence just means several separate signals lining up and pointing the same direction. If the weekly chart, the daily chart, and the 1-hour chart are all showing strength, that's stronger than one chart showing strength alone. As a beginner you'll keep it simple: pick one higher timeframe to judge the overall direction (the daily), and one lower timeframe to time your actual entry (the 1-hour). Higher timeframe sets the story; lower timeframe picks the moment.
Worked example: Maria chooses swing trading. Her higher timeframe is the daily chart — she uses it to decide "is this stock generally going up?" Her lower timeframe is the 1-hour chart — she uses it to find a good spot to actually click buy. She checks charts twice a day: once in the morning, once after the close. That's a sustainable routine she can keep for years, not a frantic one that burns her out in a week.
Step Three: Define Your A+ Setup (What Has to Be True)
This is the heart of your plan. A setup is a specific, repeatable pattern of conditions that, when they all appear together, tell you it might be a good time to trade. An "A+ setup" is your very best, cleanest, highest-confidence version of that pattern — the one you wait for like a patient hunter, ignoring everything less.
Here's the mindset shift most beginners miss: you are not trying to trade a lot. You are trying to trade only when your specific, pre-defined conditions are met. Professionals pass on 95% of what they see. They wait for the pitch right down the middle. Your A+ setup is the definition of "right down the middle" so you know it when you see it — and, just as importantly, so you know when to sit on your hands.

A beginner A+ setup should be built from a few simple, objective ingredients. "Objective" means anyone looking at the chart would agree it's there — no guessing, no "I feel like it." Let's define a few common building blocks:
- Trend: The general direction price has been moving. An uptrend is a series of higher highs and higher lows — like a staircase going up. A downtrend is the opposite. "The trend is your friend" because trading with the direction is easier than fighting it.
- Moving average: A line on your chart that shows the average price over the last X bars, smoothing out the noise. A common one is the 50-day moving average. When price is above a rising moving average, that's a simple sign of an uptrend. HPT's own framework uses specific averages (the 12, 22, and 55), but for your first plan, one clean average is plenty.
- Support and resistance: Support is a price level where buyers have repeatedly stepped in and pushed price back up — a "floor." Resistance is a level where sellers repeatedly capped price — a "ceiling." Price bouncing off a known floor is a classic setup ingredient.
- Pullback: A temporary dip against the trend. In an uptrend, price doesn't go straight up — it climbs, dips a little, climbs again. Buying the dip within an uptrend, near support, is one of the most beginner-friendly setups that exists.

A simple beginner A+ setup, fully spelled out:
"I will only buy when: (1) the daily chart shows a clear uptrend with price above a rising 50-day moving average, AND (2) the sector is also strong, AND (3) price has pulled back to a support level or the moving average and shows a sign of bouncing (a strong up-day), AND (4) the overall market is not falling apart that day."
Notice every condition is checkable. There's no "I have a good feeling." That's what makes it a plan and not a hope.
Worked example: Maria is watching Apple. The daily chart is a clean staircase of higher highs — uptrend, check. Price is above a rising 50-day average — check. Technology sector is green today — check. Apple has dipped three days in a row down to its 50-day line and today it's putting in a strong green day, bouncing right off it — check. The broad market is calm and slightly up — check. All five conditions are met. This is an A+ setup. If even one condition were missing — say the market was crashing — Maria does nothing and waits. That discipline is the edge.

Step Four: Risk Rules (How You Protect Your Money)
If you remember only one section of this entire guide, make it this one. Risk management — the rules for how much you can lose — is the single biggest difference between traders who survive and traders who blow up. HPT's core ethos is blunt about it: protect capital first. You cannot make money if you've lost all your money. Offense wins games; defense wins careers.
Let's define the essential tools:
- Stop-loss: A pre-set price at which you will automatically sell to cut your loss if the trade goes against you. It's your emergency exit, decided before you enter. You place it at a price that would prove your setup wrong — for example, below the support level you were buying at. If price falls there, your reason for the trade is gone, so you leave.
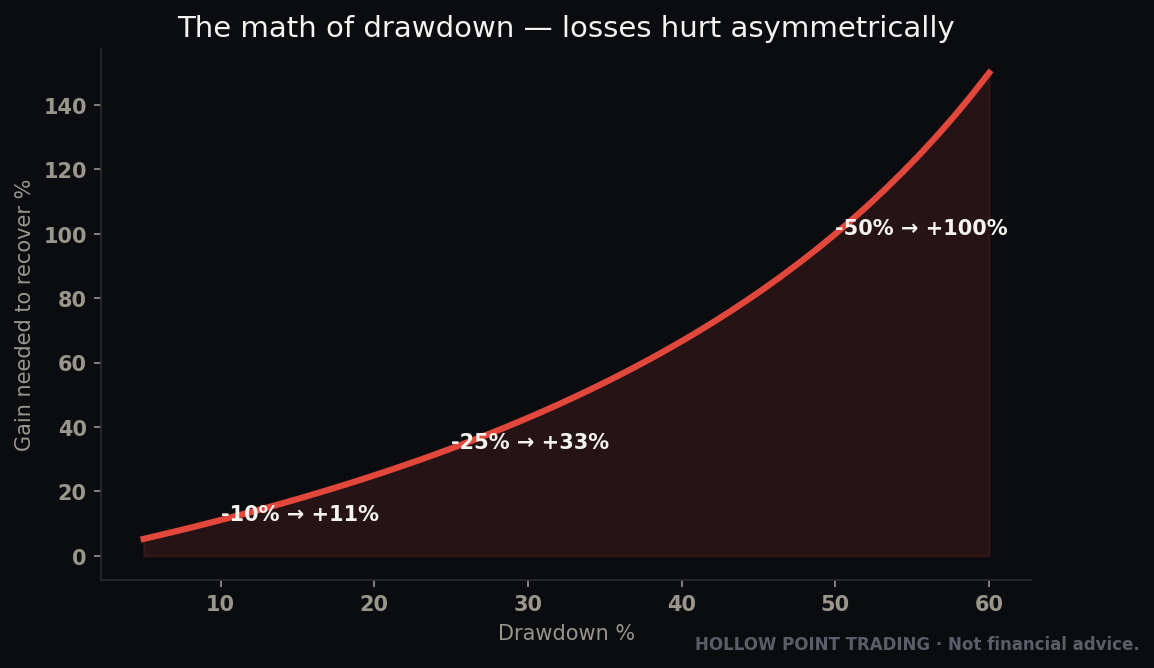
- Risk per trade: The maximum amount of money you'll allow yourself to lose on any single trade. The golden beginner rule: risk no more than 1% of your account on one trade. So a $5,000 account risks $50 per trade, max. Why so small? Because it means you could be wrong ten times in a row and still have almost all your money. Survival first.
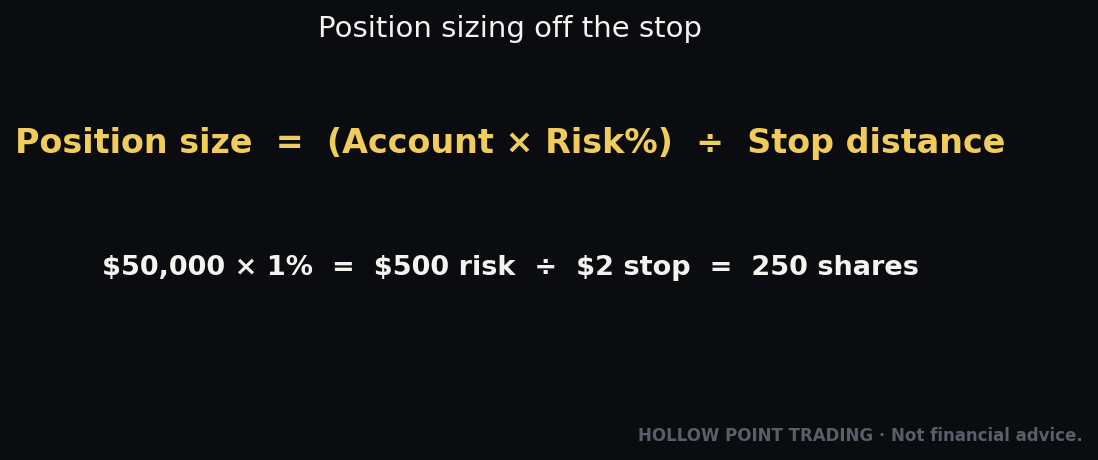
- Position size: How many shares (or contracts) you buy. This is not a random number — you calculate it from your risk. This is the most important math in trading, and it's simple.

The position-size formula (memorize this):
Shares to buy = (Dollars you're willing to risk) ÷ (Distance from entry to stop, per share)
Worked example: Maria's account is $5,000. Her 1% risk is $50. She wants to buy Apple at $200. She'll place her stop-loss at $195 — just below the support that would prove her wrong. The distance from entry to stop is $200 − $195 = $5 per share.
Shares to buy = $50 ÷ $5 = 10 shares.
So Maria buys 10 shares. If she's wrong and price hits $195, she loses 10 × $5 = $50 — exactly her 1% limit. Notice she didn't ask "how many shares can I afford?" She asked "how many shares keep my loss at $50 if I'm wrong?" That reversal in thinking is what separates traders from gamblers.

Now the reward side. HPT mandates a minimum 1:3 reward-to-risk ratio, often written 1:3 R/R. This means for every $1 you're willing to lose, you aim to make at least $3. It's a rule about only taking trades where the potential prize is much bigger than the potential loss.
Worked example continued: Maria risks $5 per share (down to her $195 stop). At 1:3, her profit target must be at least $15 per share up — so $200 + $15 = $215. She'll aim to sell at $215. Here's the beautiful part: with 1:3, she only has to be right one out of every three times to break even. If she's right even half the time, she makes good money. She doesn't need to be a genius or a fortune-teller. She needs to be a disciplined bookkeeper who only takes trades where the math is stacked in her favor.

Why a beginner should care this much: Most new traders obsess over finding winners. Professionals obsess over controlling losers. If your losses are small and fixed, and your winners are three times bigger, you can be wrong constantly and still come out ahead over time. The risk rules aren't the boring part of the plan — they're the whole engine.
Step Five: Know Your Session Times (When the Market Is Open)
A trading session is the window of time a market is open and active. This matters because a market isn't equally busy all day. Liquidity — the amount of buying and selling happening — changes throughout the session, and that changes how price behaves.
For US stocks, the regular session runs 9:30 AM to 4:00 PM Eastern Time. Within that, the key windows for a beginner to understand:
- The Open (9:30–10:30 AM ET): The busiest, wildest hour. Overnight news gets digested and price whips around violently. Beginners often lose the most money here by jumping into the chaos. A common beginner protection: don't trade the first 15–30 minutes. Let the dust settle.
- Midday (11:30 AM–1:30 PM ET): The quiet lunch lull. Price often drifts sideways with less conviction. Fewer clean setups; easy to get chopped up (small back-and-forth losses).
- The Close (3:00–4:00 PM ET): Activity picks up again as traders position for the next day. Can offer good moves but also sharp reversals.
There are also global session times worth naming, because the world's money hands off around the clock: the Asia session, the London session, and the New York session. When London and New York overlap (roughly 8:00–11:00 AM ET), volatility is highest across many markets. As a beginner in US stocks you mostly care about your own session — but knowing the handoffs exist helps you understand why price sometimes moves before you even wake up.
The beginner rule: pick your trading window and honor it. You do not have to trade all day. In fact you shouldn't. Decide, for example, "I trade only between 10:00 and 11:30 AM ET, after the open settles." Outside that window, the market doesn't exist for you. This single rule prevents a huge amount of tired, bored, revenge-driven trading.
Worked example: Maria has a day job. She can't watch the market from 9:30 to 4:00. So she becomes a swing trader who reviews charts at 9:00 AM before work and 4:30 PM after the close. She places her orders with pre-set stops and targets, then walks away. Her "session" is fifteen minutes, twice a day. She built her plan around her real life, not a fantasy version of it. That's the correct order of operations.

Step Six: The Daily Routine (Your Repeatable Process)
A routine is the exact same sequence of steps you run every trading day, in order, no matter what. Pilots use pre-flight checklists — even after thousands of flights — because a checklist doesn't get tired, distracted, or overconfident. Your daily routine is your pre-flight checklist. It makes your good habits automatic.
Here's a simple beginner daily routine, built the HPT top-down way:
Before the market opens:
- Check the macro. Is the overall market (the broad index) up or down in pre-market? Any big scheduled news today? "News" here means things like earnings reports (a company announcing its profits) or economic data releases, which can move everything.
- Check the sectors. Which neighborhoods are strong or weak today?
- Review your watchlist. Go through your small handful of stocks. Does any of them match your A+ setup, or is any close to matching?
- Write your plan for the day. For each candidate: "If price does X, I'll enter at Y, stop at Z, target at T, buying N shares." Everything decided in advance.
During your trading window:
- Wait. Only act if your pre-written condition actually triggers. If it doesn't, you do nothing — and doing nothing is a successful day.
- Execute mechanically. If the setup triggers, place the trade exactly as written: entry, stop-loss, position size, target. No improvising.
After the market closes:
- Journal every trade (next section).
- Review: Did I follow my plan? Not "did I make money" — did I follow my rules? Those are different questions, and the second one matters more.
The beginner rule: grade yourself on process, not profit. In the short term, you can follow every rule perfectly and still lose (the market is partly random), or break every rule and get lucky and win. If you judge yourself by money, you'll accidentally reward your worst habits. Judge yourself by whether you followed the plan. Do that long enough and the money follows.
Step Seven: Journaling (How You Actually Improve)
A trading journal is a written record of every trade you take and why. This is the tool that turns experience into skill. Without a journal, you'll repeat the same mistake fifty times and never notice the pattern. With one, the pattern jumps off the page and you fix it.
You don't need fancy software. A simple spreadsheet or notebook works. For each trade, record:
- Date and stock
- The setup: which A+ conditions were present
- Entry, stop, and target prices
- Position size (shares) and dollars risked
- Result: win or loss, and how much
- Did I follow my plan? Yes or no — the most important column
- How I felt: calm, anxious, greedy, bored. Emotions leave fingerprints on bad trades.
- One lesson
Worked example: After a month, Maria reviews her journal. She notices something she never would have caught in the moment: every single one of her losing trades has "No" in the Did I follow my plan? column, and most say "anxious" or "bored" under feelings. Her planned trades are actually profitable. Her impulsive ones — taken outside her window, out of boredom — are bleeding her account. The journal just handed her the single most valuable insight of her young trading career: her strategy works; her discipline is the leak. No amount of new indicators would have told her that. Her own honest record did.
The beginner rule: journal every trade the same day, honestly. The temptation is to record only the good trades or to fudge the "did I follow my plan" column to protect your ego. Don't. The journal only helps you if it's brutally honest. It's a mirror, and a mirror that flatters you is useless.
Putting It All Together — Your One-Page Plan Cheat-Sheet
Here's your entire first trading plan, condensed. Copy this, fill in your own answers, and you have a real, working plan.
MY TRADING PLAN
- Market: ____________ (e.g., US large-cap stocks, watchlist of 5)
- Style & timeframe: ____________ (e.g., swing trading; daily for direction, 1-hour for entry)
- My A+ setup — I only buy when ALL are true:
- Overall market healthy (macro)
- Sector strong
- Stock in clear uptrend, above rising moving average
- Price pulled back to support/average and showing a bounce
- My invalidation level (stop) is clearly identifiable
- Risk rules:
- Risk per trade: 1% of account = $______
- Position size = (dollars risked) ÷ (entry − stop, per share)
- Reward-to-risk: minimum 1:3
- Stop-loss placed on EVERY trade, no exceptions
- Session window: ____________ (e.g., review 9 AM & 4:30 PM; no trading first 15 min of open)
- Daily routine: Macro → Sector → Watchlist → Write plan → Wait → Execute → Journal → Review
- Journal: Every trade, same day, honest — including "Did I follow my plan?"
The Beginner Mistakes to Avoid (Learn These for Free)
Every one of these has drained a beginner account. You get to skip the tuition:
- Trading without a written plan. "It's all in my head" means it changes the second you're scared. Write it down.
- Risking too much per trade. The fastest way to blow up. One percent isn't timid — it's how you stay in the game long enough to get good.
- No stop-loss. "It'll come back" is the most expensive sentence in trading. Sometimes it doesn't come back. The stop is non-negotiable.
- Overtrading. Taking trades out of boredom, revenge, or FOMO ("fear of missing out"). More trades ≠ more money. Your best days are often the ones you sit still.
- Chasing. Buying something after it's already rocketed up, far from your entry, because you can't stand missing it. The setup is the setup; if you missed it, let it go.
- Ignoring the top-down picture. Buying a stock while the whole market is crashing because "the chart looked good." Macro first, always.
- Not journaling. Guarantees you repeat mistakes forever.
- Judging yourself by money instead of discipline. Rewards luck, punishes good process. Grade the process.
- Changing the plan mid-trade. Moving your stop farther away because you don't want to be wrong turns a small, planned loss into a catastrophe. Decide before; obey during.
How This Fits the Bigger HPT Picture
Everything in this guide is the foundation the entire Hollow Point Trading approach stands on. The advanced tools — the indicator suites, the multi-timeframe confluence scoring, the precise entry patterns — are all upgrades to individual steps you just learned, not replacements for the framework.
The macro → sector → stock funnel you used to pick trades is HPT's core lens for reading any market, on any day. The 1:3 reward-to-risk rule and protect-capital-first ethos aren't beginner training wheels you'll outgrow — they're permanent laws that professionals never abandon. The discipline-over-prediction mindset — grading yourself on whether you followed rules rather than whether you guessed right — is the philosophy that runs through every level of HPT trading.
As you grow, you'll refine each piece. Your single moving average might become HPT's 12/22/55 framework. Your one A+ setup might become a small library of named patterns. Your "check the sector" step might become a scanner that ranks a hundred names. But the shape of your plan — market, timeframe, setup, risk, session, routine, journal — never changes. You're not building a beginner plan you'll throw away. You're building the permanent skeleton that every future upgrade hangs on.
Start Monday. One market. One setup. One percent of risk. A stop on every trade. A journal every night. Do only that, honestly, for three months, and you will already be ahead of the overwhelming majority of people who ever try this. Not because you predicted the market — because you refused to trade without a map.
Bound by rules, feared by trade.