
A candlestick is not a squiggle. It is a fully documented argument between buyers and sellers, settled at the close, printed forever. Every open, high, low, and close is a record of who won a specific fight over a specific slice of time. Learn to read the record and you stop guessing what a chart "feels like" and start reading what actually happened.
This is the definitive guide. Every major pattern gets its own section — the structure, the psychology underneath it, where it works, where it fails, how to trade it, and the confluence that turns a pretty candle into a real edge. We build it the Hollow Point way: macro sets the weather, sector sets the tide, the stock sets the entry — and no candle gets traded naked. A pattern is a trigger, never a thesis.
The Anatomy — Read This Once, Own It Forever
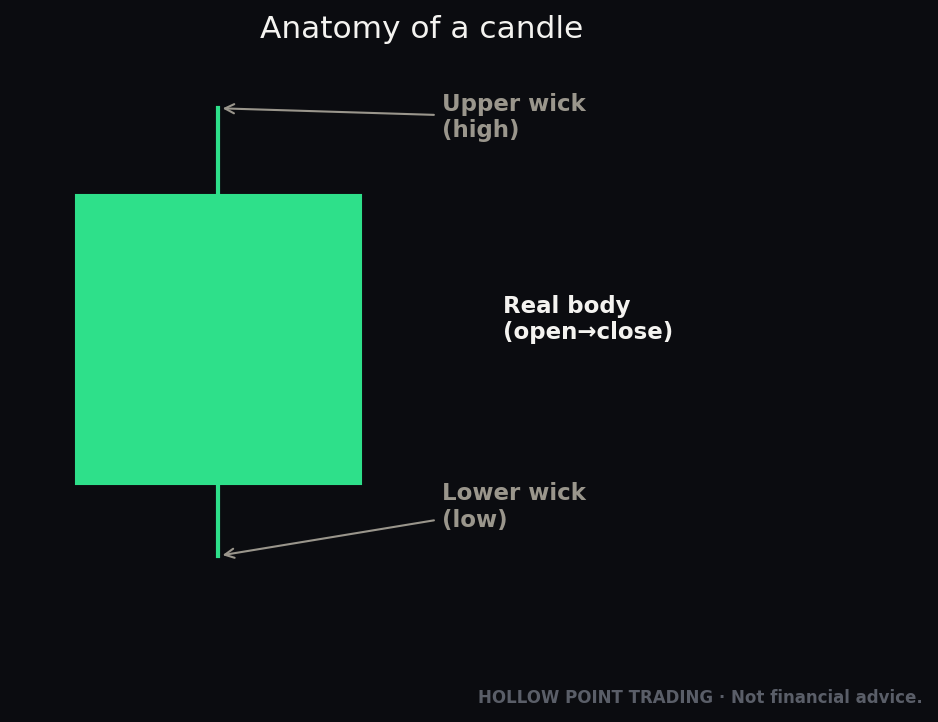
Before a single pattern, lock down the vocabulary. A candle has four data points and two visible parts.
- Body — the thick block between the open and the close. Green (or white/hollow) means the close finished above the open; buyers held the period. Red (or black/filled) means the close finished below the open; sellers held it.
- Wicks (also called shadows or tails) — the thin lines above and below the body, marking the high and the low. A wick is rejected price — territory the market visited and refused to hold.
- Range — high to low, the full battlefield.
- Real body size — the conviction. Big body, decisive period. Small body, indecision.
The single most important mental model: the body is the outcome, the wicks are the failed attempts. A long lower wick means sellers pushed price down and got violently rejected — buyers dragged it back up before the close. That rejection is information. That is the whole game.
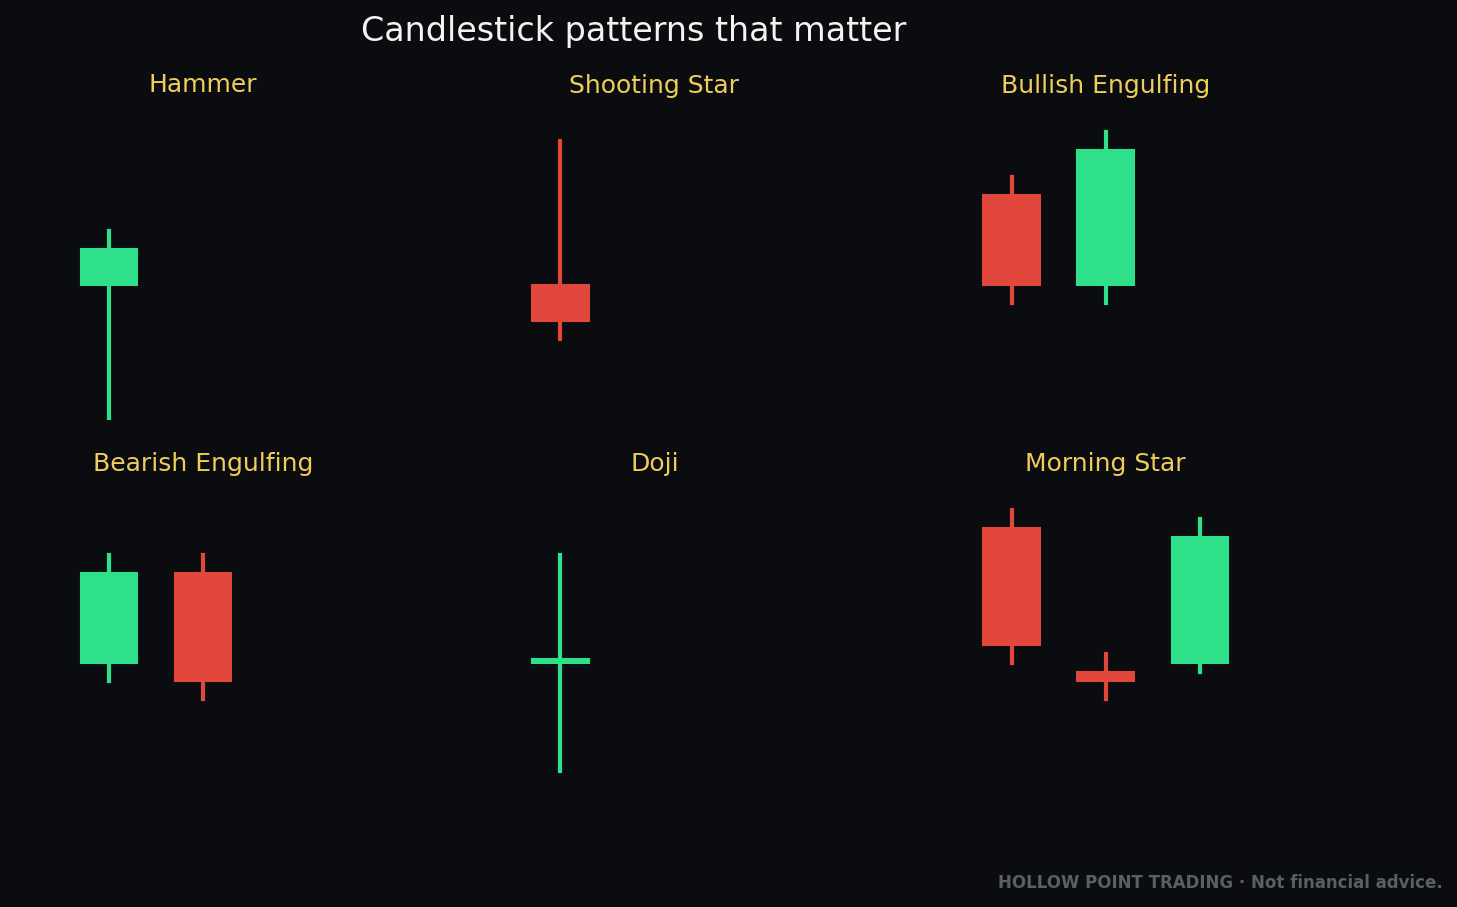
Two rules that override everything else in this guide:
- A candle is only as good as its location. A hammer at random support in the middle of nowhere is noise. A hammer on the 55-EMA, at a prior day low, into a golden pocket, on a volume spike — that is a signal. Location first, pattern second.
- Wait for the close. Intrabar, every candle is a liar. A "hammer" with two minutes left can close as a bearish marubozu. The pattern does not exist until the period closes. Discipline over prediction — always.
Now the catalog.
SINGLE-CANDLE PATTERNS
One candle, one story. These are the fastest signals on the board and the easiest to misread, because a single candle carries the least context. Every one of them demands confluence.
The Doji — Indecision, Printed
Structure: Open and close are virtually identical, so the body is a thin horizontal line or nonexistent. Wicks can be any length. The battle was fought and nobody won — price ended exactly where it started.

Psychology: Equilibrium. Buyers and sellers exhausted each other to a draw. The meaning of a doji is entirely dependent on what came before it. After a long trend, a doji is the sound of momentum dying — the trend's fuel ran out. In a range, a doji is just noise.
There are four doji you must distinguish:
Standard doji — small wicks both sides, cross-shaped. Pure indecision. On its own, weak. In an uptrend after five green marubozus, it is a warning flare.
Long-legged doji — long wicks both top and bottom, close snapping back to the open. This is violent indecision — price ranged hard in both directions and settled dead center. Maximum uncertainty, often a genuine pivot when it lands at a key level.
Dragonfly doji — open, high, and close all cluster at the top; a long lower wick and no upper wick. A "T" shape. This is functionally a doji-hammer: sellers drove price down all period and buyers erased every bit of it by the close. Bullish at support.
Gravestone doji — the inverse. Open, low, and close cluster at the bottom; long upper wick, no lower wick. An upside-down "T." Buyers pushed up all period and got completely rejected by the close. Bearish at resistance.

Where it works: At the exhaustion end of an extended move, sitting on a real level. Dragonfly at prior-day-low support after a three-day flush. Gravestone into the 55-EMA from below after a relief rally.
Where it fails: In chop. A doji inside a tight range means nothing — the whole range is indecision. Low-timeframe doji (1m, 2m) print constantly and are mostly meaningless.
How to trade it: A doji is a pause, not an entry. Trade the resolution. After a dragonfly at support, enter on the next candle breaking the doji's high, stop below the doji's low. The doji defines your risk perfectly — the low is the line the whole rejection depends on.
Confluence that confirms: Volume expansion on the doji (real fight, not a quiet drift). A level underneath — VWAP, EMA, POC, prior day high/low. RSI divergence. A doji that coincides with the daily 55-EMA is the tell Hollow Point weights heaviest.
The Hammer — The Bottom's Signature
Structure: Small real body at the top of the range, a long lower wick at least twice the body length, little to no upper wick. Body color barely matters, though green is marginally stronger. Appears after a downtrend — that context is mandatory.

Psychology: This is the most reliable single-candle reversal, and its story is clean. Sellers opened in control and drove price down hard — the long lower wick is that push. Then, somewhere near the low, buyers overwhelmed them and dragged price all the way back to the top by the close. The sellers' best shot was thrown and rejected. The low becomes a line in the sand: "we tried below here and got rejected."
Where it works: At the end of a clean downtrend, into support, on a volume spike. The bigger the lower wick relative to recent candles, the more violent the rejection, the stronger the signal. A hammer that also tags a fib golden pocket or the 55-EMA is a high-quality trigger.
Where it fails: In a strong, orderly downtrend with no support nearby — a hammer in free-fall is just a pause before more selling. Also fails when the body is fat: if the body is nearly as big as the wick, the rejection wasn't decisive. And a hammer on no volume is a shrug, not a fight.
How to trade it: Enter on a break of the hammer's high on the next candle (confirmation entry), or aggressively at the close for a better price with more risk. Stop goes below the hammer's low — if price trades back under that low, the rejection failed and the read is dead. Target a prior structure high or resistance for at least 1:3 R/R. If the math doesn't give you 1:3, you don't take it.
Confluence that confirms: Support level, volume spike, RSI oversold or bullish divergence, MACD histogram contracting, a higher-timeframe demand zone. The 12/22/55 EMA stack flattening or the 55 acting as the floor.
The Inverted Hammer — The Quieter Bottom Signal
Structure: Small body at the bottom of the range, long upper wick (2x+ body), minimal lower wick. Appears after a downtrend. Visually identical to a shooting star — context is the only difference.

Psychology: After a downtrend, buyers made a strong push up (the long upper wick) but couldn't hold it into the close. Sounds bearish — but appearing at the bottom of a move, it signals that buyers finally showed up with force for the first time. The failed push is still a shift in who is willing to fight. It needs confirmation more than the hammer does.
Where it works: At support after a downtrend, with a strong confirming candle the next period. The inverted hammer is a two-candle signal in practice — the hammer plus its confirmation.
Where it fails: Without confirmation. Because buyers lost the close, an unconfirmed inverted hammer often just resumes the downtrend. Treat it as a heads-up, not a trigger.
How to trade it: Wait for the next candle to close green and above the inverted hammer's body. Enter there, stop below the pattern's low, target 1:3.
Confluence that confirms: Same support/volume/RSI stack as the hammer, but weight the confirmation candle heavily. No confirmation, no trade.
The Hanging Man — The Hammer's Evil Twin
Structure: Identical shape to the hammer — small body up top, long lower wick — but appears after an uptrend. Same candle, opposite location, opposite meaning.
Psychology: In an uptrend, that long lower wick reveals something new: sellers were able to drive price down hard mid-period for the first time. Buyers recovered it by the close, so it looks fine — but the fact that sellers could push that far is a crack in the trend. It's a warning that supply is waking up.
Where it works: At the top of an extended uptrend, into resistance, especially with a bearish confirming candle next. Confirmation is critical because the close was still bullish.
Where it fails: In a powerful uptrend with no resistance overhead — buyers recovering the wick often just means the dip got bought and the trend continues. This is the trap of the hanging man: it fails more than the hammer works.
How to trade it: Only on confirmation — a red candle closing below the hanging man's body. Enter short there, stop above the pattern's high, target the nearest support at 1:3.
Confluence that confirms: Resistance, exhaustion after a long run, bearish RSI divergence, declining volume into the highs, price extended far above the 55-EMA (mean-reversion pressure).
The Shooting Star — The Top's Signature
Structure: Small body at the bottom of the range, long upper wick (2x+ body), little lower wick. Appears after an uptrend. The bearish mirror of the hammer.

Psychology: The cleanest single-candle top signal. Buyers pushed price to a new high (the long upper wick) and got slammed — sellers dragged price all the way back down to the open by the close. The high becomes the rejected line: "we tried above here and got crushed." A shooting star into resistance is one of the highest-quality short triggers on the board.
Where it works: At the top of an uptrend, into resistance, on a volume spike, ideally after price is extended. Rejection off a prior high, a call wall, or an anchored VWAP from a major high adds real weight.
Where it fails: Mid-trend with room to run, or on low volume. A shooting star in a grinding bull with no overhead supply often gets absorbed and price makes new highs.
How to trade it: Enter short on a break of the star's low next candle, or at the close aggressively. Stop above the star's high — the rejected level. Target the nearest support/POC/VWAP for 1:3.
Confluence that confirms: Resistance level, volume spike, bearish RSI divergence, a gravestone-like structure, GEX call wall overhead acting as a ceiling, price stretched above the EMA stack.
The Marubozu — Total Domination
Structure: A big body with no wicks (or nearly none) on either end. Open equals the high or low, close equals the other extreme. Bullish marubozu: opens at the low, closes at the high, all green. Bearish marubozu: opens at the high, closes at the low, all red.
Psychology: One-sided annihilation. A bullish marubozu means buyers controlled every tick — price never traded below the open, never got rejected at the high. Pure demand. It signals continuation and strength, not reversal. When a marubozu breaks a level, that break is high-conviction because there was zero hesitation.
Where it works: As a breakout/continuation confirmation. A bullish marubozu closing above resistance is a far stronger break than a doji-ish close above it. Marubozus also mark the start of impulsive moves — great for confirming a trend is alive.
Where it fails: As an exhaustion signal, a lone marubozu at the end of a parabolic run can be a blow-off top — the last buyers piling in. Context flips its meaning. Also, chasing a marubozu's close means chasing an extended candle; your stop is far and R/R suffers.
How to trade it: Use it as confirmation of a break or trend, not as a standalone entry. Enter on the retest of the level it broke, not at its extended close — that keeps your risk tight and your R/R honest.
Confluence that confirms: Volume expansion (real participation), a clean level being broken, alignment with the higher-timeframe trend and the EMA stack.
The Spinning Top — Balanced Indecision
Structure: Small real body centered in the range, with upper and lower wicks of similar length longer than the body. Like a doji but with a visible body — slightly less balanced, still mostly indecisive.

Psychology: Both sides fought hard (long wicks both ways) but neither could close the deal (small body). Momentum is stalling. Like the doji, its meaning comes from context: after a trend, it's an early warning of exhaustion; in a range, it's more noise.
Where it works: As a momentum-loss flag at the end of a run, especially clustered with other indecision candles at a level. Multiple spinning tops at resistance = distribution.
Where it fails: As a standalone entry — it's a warning, never a trigger. Trading spinning tops in isolation is a good way to churn commissions.
How to trade it: Don't trade it directly. Use it to tighten stops, take partials, or wait for the resolution candle that breaks its range.
Confluence that confirms: Extension of a prior trend, a level, RSI divergence, declining volume — the standard exhaustion stack.
TWO-CANDLE PATTERNS
Two candles give context a single candle can't. The second candle's relationship to the first — does it engulf it, get swallowed by it, pierce it — carries the signal. These are more reliable than single candles precisely because they show a shift, not just a moment.
Bullish Engulfing — The Takeover
Structure: A first candle that is red (down), followed by a second candle that is green (up) and whose body completely engulfs the first candle's body — opening below the first's close and closing above the first's open. The bigger the engulfing, the stronger. Appears after a downtrend.

Psychology: A complete transfer of control in one period. Day one, sellers were winning. Day two, buyers didn't just push back — they erased the entire prior candle and then some. Every seller who sold during that first candle's body is now underwater. That trapped supply becomes fuel: as price rises, they cover, adding buy pressure. This is one of the most reliable and tradeable reversal patterns in existence.
Where it works: At the end of a downtrend, into support, with the engulfing candle on expanded volume. The engulfing candle closing above a level (breaking the prior day high, reclaiming VWAP, reclaiming the 55-EMA) makes it a premium trigger.
Where it fails: Into strong resistance overhead — buyers takeover but immediately hit a wall. Also weak when the engulfing candle's volume is thin, or when it happens inside chop where "engulfing" is meaningless because bodies overlap constantly.
How to trade it: Enter at the close of the engulfing candle, or on a shallow pullback into it next period. Stop below the low of the engulfing candle (or the pattern low). Target prior structure for 1:3. Because the engulfing candle is large, watch your entry — a pullback entry to the candle's midpoint often gives far better R/R than chasing the close.
Confluence that confirms: Support, volume spike on the engulfing bar, RSI divergence, MACD bullish cross, reclaim of a key EMA or VWAP, higher-TF demand zone. When the engulfing bar reclaims the daily 55-EMA, Hollow Point weights it as a bias flip.
Bearish Engulfing — The Takeover, Inverted
Structure: A green (up) first candle followed by a red (down) second candle whose body completely engulfs it. Appears after an uptrend.
Psychology: Mirror image. Buyers were winning, then sellers erased the entire prior candle in one period, trapping everyone who bought during it. Those trapped longs become sell pressure as price falls and they bail. Strong, reliable top signal.
Where it works: Top of an uptrend, into resistance, on volume. Closing below a level — breaking prior day low, losing VWAP, losing the 55-EMA — turns it premium.
Where it fails: Into strong support beneath, on thin volume, or inside a range.
How to trade it: Short the close or a pullback into the engulfing candle's body. Stop above the pattern high. Target support for 1:3.
Confluence that confirms: Resistance, volume spike, bearish RSI divergence, MACD bearish cross, loss of a key EMA/VWAP, GEX call wall overhead.
The Harami — The Pause Inside
Structure: A large first candle followed by a small second candle whose body sits entirely inside the first candle's body. The opposite of engulfing — the second candle is "pregnant" (harami is Japanese for pregnant) inside the first. Bullish harami: big red candle, then a small green candle inside it, after a downtrend. Bearish harami: big green candle, then a small red one inside it, after an uptrend.

Psychology: Momentum stall. In a bullish harami, the big red candle shows sellers in full control — then, suddenly, the next period can't make a new low and closes as a small quiet candle. The selling stopped. That abrupt loss of momentum after a strong push is the tell. It's softer than an engulfing (control hasn't transferred, it's just paused), so it needs more confirmation.
Where it works: At the end of an extended, climactic move, at a level. The harami says "the freight train just lost its engine." Confirmation on the next candle is important.
Where it fails: In weak trends (the "momentum" it's flagging the loss of was never strong), and without confirmation — a harami frequently just resolves in the original trend direction.
How to trade it: Wait for a confirmation candle breaking the harami's direction (green close above the small candle's high for a bullish harami). Enter there, stop beyond the large candle's extreme, target 1:3. A harami cross — where the second candle is a doji instead of a small body — is the stronger version, because the indecision is even more pronounced.
Confluence that confirms: Extension into a level, RSI divergence, volume drying up on the inside candle (momentum genuinely gone), higher-TF support/resistance.
Tweezer Tops and Bottoms — The Matched Rejection
Structure: Two (or more) adjacent candles that share a nearly identical high (tweezer top) or identical low (tweezer bottom). At a top, two candles wick to the same high and get rejected; at a bottom, two candles wick to the same low and hold. Often the first candle is trend-direction and the second is a reversal candle.
Psychology: A tested and defended level, twice. A tweezer bottom means price hit a low, bounced, came back to the exact same low, and bounced again — sellers tried twice to break it and failed both times. That double rejection confirms buyers are defending a precise price. Strong when the matched level is a known support/resistance.
Where it works: At established levels, prior day high/low, round numbers, POC. The precision of the matched wicks is the signal — it shows algorithmic/institutional defense of a level.
Where it fails: When the "match" is loose (highs a percent apart aren't tweezers), or at a random price no one is watching.
How to trade it: Enter on the second candle's confirmation (a bullish close for a tweezer bottom), stop just beyond the matched low/high — a very tight, well-defined stop, which is exactly what you want. Target 1:3+.
Confluence that confirms: The matched level coinciding with a real S/R, EMA, or VWAP; volume; RSI divergence between the two touches (second touch lower momentum = classic divergence).
Piercing Line — The Half-Reclaim (Bullish)
Structure: After a downtrend, a red candle, then a green candle that opens below the prior close (often a gap down) and closes above the midpoint of the prior red candle's body — but not above its open (if it closed above the open, it'd be engulfing). It "pierces" more than halfway back into the prior candle.
Psychology: A near-takeover. Sellers gapped price down to start, looking to continue the trend — and buyers not only absorbed it but shoved price back above the halfway point of the prior day's selling. The 50%+ reclaim is the threshold that matters; below half it's weak, above half it shows real demand. Slightly less powerful than a full bullish engulfing, but the same story.
Where it works: At support after a downtrend, on volume, especially after a gap-down that gets bought. The deeper the pierce (closer to a full engulf), the stronger.
Where it fails: If the close is below the prior midpoint — then it's not a piercing line, it's just a bounce, and it usually fails. The 50% rule is non-negotiable.
How to trade it: Enter on confirmation or the close, stop below the pattern low, target 1:3.
Confluence that confirms: Support, volume, RSI divergence, the reclaim coinciding with a VWAP or EMA.
Dark Cloud Cover — The Half-Reclaim (Bearish)
Structure: The mirror. After an uptrend, a green candle, then a red candle that opens above the prior close (often gaps up) and closes below the midpoint of the prior green body, but not below its open.
Psychology: Buyers gapped price up to continue the trend, and sellers not only absorbed the gap but drove price back below the halfway mark of the prior day's rally — trapping the gap-up buyers. Bearish, the near-mirror of a bearish engulfing.
Where it works: At resistance after an uptrend, on volume, after a failed gap-up. Deeper penetration = stronger.
Where it fails: If it doesn't close below the prior midpoint (then it's just a stall), or on thin volume.
How to trade it: Short on confirmation or the close, stop above the pattern high, target 1:3.
Confluence that confirms: Resistance, volume, bearish divergence, loss of VWAP/EMA, overhead GEX call wall.
THREE-CANDLE PATTERNS
Three candles tell the most complete story — setup, turn, and confirmation are all baked into the pattern. They print less often but carry the highest single-pattern reliability, because the pattern is its own confirmation.
Morning Star — The Dawn (Bullish Reversal)
Structure: Three candles. (1) A large red candle continuing the downtrend. (2) A small-bodied candle (any color, or a doji — then it's a morning doji star) that gaps or trades down, showing indecision. (3) A large green candle that closes well into — ideally above the midpoint of — the first candle's body. The classic "the darkness before dawn."
Psychology: A three-act play. Act one: sellers in full control, big red bar. Act two: momentum stalls — the small candle shows the selling ran out of force, neither side dominant. Act three: buyers seize control decisively with a big green bar, confirming the reversal. The small middle candle is the pivot — the moment the trend's back broke. This is one of the most reliable reversal patterns because it shows the full transition: dominance, exhaustion, reversal.
Where it works: At the bottom of a downtrend, into support, with the third candle on strong volume and closing above a level. A morning star bottoming into the daily 55-EMA or a golden pocket is a high-conviction long.
Where it fails: Mid-downtrend with no support, or when the third candle is weak (doesn't reclaim much of the first candle) — a limp third bar means buyers didn't really take over.
How to trade it: Enter at the third candle's close or on a pullback next period. Stop below the low of the middle candle (the star) — the pivot low. Target prior structure for 1:3. The stop is naturally tight because the middle candle is small.
Confluence that confirms: Support, volume expansion on candle three, RSI oversold/divergence, MACD bullish cross, EMA reclaim, higher-TF demand.
Evening Star — The Dusk (Bearish Reversal)
Structure: The mirror. (1) A large green candle continuing an uptrend. (2) A small-bodied candle or doji (evening doji star) showing indecision at the top. (3) A large red candle closing well into the first candle's body.
Psychology: Buyers dominate (big green), momentum stalls (small candle at the highs — buyers exhausted), sellers take decisive control (big red). The classic top formation. The small candle at the peak is often the literal high of the move.
Where it works: Top of an uptrend, into resistance, third candle on volume, closing below a level.
Where it fails: Mid-uptrend with room to run, or with a weak third candle.
How to trade it: Short the third close or a pullback. Stop above the middle candle's high. Target support for 1:3.
Confluence that confirms: Resistance, volume, bearish divergence, MACD bearish cross, loss of EMA/VWAP, GEX call wall.
Three White Soldiers — The March (Bullish)
Structure: Three consecutive long green candles, each opening within the prior candle's body and closing near its own high, at progressively higher levels. Small upper wicks. A steady, orderly advance. Best appearing after a downtrend or consolidation.
Psychology: Sustained, methodical accumulation. Not a violent spike — a staircase. Each candle closes strong, each open holds above the prior body, showing buyers step in on every minor dip. This is what a healthy trend change looks like: no panic, just relentless demand. One of the most bullish continuation/reversal signals when it emerges from a base.
Where it works: Breaking out of consolidation or reversing a downtrend, with steady or building volume. Confirms a trend is genuinely underway.
Where it fails: When the candles have long upper wicks (buyers getting rejected each time — exhaustion, not strength), or when it appears after an already-extended run — three soldiers at the top of a parabolic move can be the blow-off, the last buyers exhausting themselves. Also, don't chase the third soldier — you're buying an extended move with a far stop.
How to trade it: Enter on the first or second soldier if you catch it early, or on a pullback after the third. Stop below the most recent soldier's low or the pattern base. Because chasing the third candle wrecks R/R, prefer the pullback entry. Target the next resistance for 1:3.
Confluence that confirms: Emergence from a base, rising volume, EMA stack turning up (12 over 22 over 55), reclaim of key levels, sector and macro alignment.
Three Black Crows — The Descent (Bearish)
Structure: Three consecutive long red candles, each opening within the prior body and closing near its own low, progressively lower, with small lower wicks. Appears after an uptrend or at the top of a range.
Psychology: Sustained, methodical distribution. Each candle closes weak, each open fails inside the prior body — sellers hit every bounce. Steady, orderly liquidation, the bearish mirror of the soldiers. Strong reversal signal off a top.
Where it works: Off the top of an uptrend or breaking down from a range, with steady/building volume.
Where it fails: With long lower wicks (sellers getting rejected each time), or when price is already deeply oversold and extended — three crows into major support can mark a bottom (seller exhaustion), not more downside. Chasing the third crow gives terrible R/R.
How to trade it: Short the first/second crow early or a pullback after the third. Stop above the recent crow's high. Target support for 1:3.
Confluence that confirms: Breakdown from a top/range, rising volume, EMA stack rolling over (12 under 22 under 55), loss of key levels, sector and macro weakness.
Three Inside Up / Down — The Confirmed Harami
Structure: This is a harami plus a confirmation candle, packaged as three. Three inside up (bullish): (1) big red candle, (2) small green candle inside it (a bullish harami), (3) a green candle closing above the first candle's high — confirmation. Three inside down (bearish): (1) big green, (2) small red inside it, (3) red closing below the first candle's low.
Psychology: It solves the harami's biggest weakness — its need for confirmation — by building the confirmation into the pattern. Candle one: trend dominance. Candle two: momentum stalls (the harami). Candle three: the reversal confirms by breaking the range. Because the confirmation is required, this is more reliable than a bare harami.
Where it works: At levels after extended moves, with candle three on volume. The confirmation close beyond candle one's extreme is the trigger.
Where it fails: When candle three is weak or fails to break the first candle's range — no confirmation, no trade.
How to trade it: Enter on candle three's confirming close, stop beyond the pattern's extreme (the first candle's far end), target 1:3.
Confluence that confirms: Support/resistance, volume on the confirmation, RSI divergence, EMA/VWAP reclaim or loss.
Three Outside Up / Down — The Confirmed Engulfing
Structure: An engulfing pattern plus confirmation. Three outside up (bullish): (1) red candle, (2) green candle engulfing it (bullish engulfing), (3) a green candle closing higher still — confirmation. Three outside down (bearish): (1) green, (2) red engulfing it, (3) red closing lower.
Psychology: Takes the already-strong engulfing pattern and adds a third candle proving follow-through. Candle two transfers control (the engulf), candle three proves the new side holds it. This is among the most reliable three-candle reversals precisely because it combines a decisive takeover with confirmed continuation.
Where it works: At levels after trends, with the third candle continuing the move on volume.
Where it fails: When candle three stalls or reverses — the takeover happened but follow-through didn't, often a trap.
How to trade it: Enter on candle three's close or a pullback, stop beyond the engulfing candle's far extreme, target 1:3.
Confluence that confirms: All of the engulfing confluence, plus the follow-through of candle three, EMA/VWAP alignment.
The Confluence Doctrine — How Hollow Point Actually Trades These
A pattern is a trigger. A trade is a pattern standing on a stack of agreeing evidence. Here is the framework that turns candles into an edge.
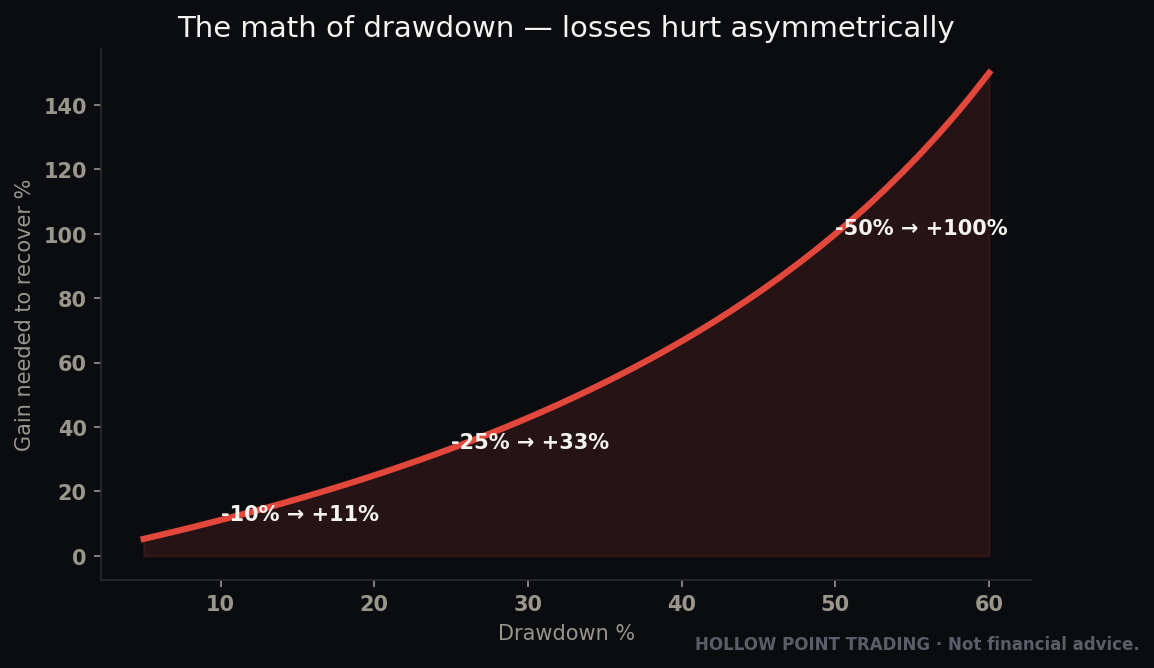
Top-down first — macro to sector to stock. Never trade a bullish reversal on a stock in a sector that's bleeding inside a macro tape that's risk-off. The candle is the last box you check, not the first. If macro and sector don't support the direction, the best hammer on the chart is a coin flip. This ordering is the whole HPT philosophy: the environment gives the pattern permission to work.
Location — the level under the candle. A pattern is only tradeable at a decision point: prior day high/low, session high/low, a POC/VAH/VAL from the volume profile, VWAP or an anchored VWAP, a fib golden pocket (0.618–0.65), a round number, or a moving average. A hammer at the daily 55-EMA is a trade. A hammer floating in space is a screenshot.
The EMA framework — 12 / 22 / 55. Hollow Point reads trend off the 12, 22, and 55 EMAs, not the standard 9/21. The daily 55-EMA is the bias tell: above it, favor longs and trust bullish reversals; below it, favor shorts. A reversal pattern that reclaims or rejects the 55 is weighted heaviest. Stack aligned and turning (12 over 22 over 55 for bulls) is trend confirmation for continuation patterns like the soldiers.
Volume — the truth serum. A reversal candle must have expanded volume relative to recent bars. Volume is participation, and a rejection nobody participated in isn't a rejection. Engulfing on a volume spike is real; engulfing on dead volume is a headfake. For continuation patterns, rising volume confirms the trend has fuel.
RSI and MACD — the momentum backup. RSI divergence (price making a lower low while RSI makes a higher low) beneath a bullish reversal candle is a premium tell. MACD line crossing signal, histogram flipping in your direction, adds independent momentum confirmation. These are secondary — they confirm, they don't lead.
Options positioning — the invisible levels. GEX call walls act as ceilings; put walls act as floors; the gamma flip separates pinning from trending regimes. A shooting star into a call wall is a far better short than one in open air. When the data's available, read it. When it isn't, say so and move on — never invent a wall.
The 1:3 rule — the math gate. Every trade must offer at least 1:3 reward-to-risk from the entry, with the stop at the pattern's invalidation and the target at real structure. If the nearest logical target is less than three times your risk, the trade does not exist — no matter how perfect the candle. This single rule kills more bad trades than any pattern knowledge, and it's non-negotiable.
Timeframe confluence. A pattern agreeing across timeframes is exponentially stronger than one in isolation. A bullish engulfing on the 15m that aligns with a hammer on the 1H that sits on daily support is a trade you press. A 1m hammer against a bearish daily is a scalp at best. Weight the read toward the higher timeframe.
Common Mistakes — The Ways Traders Blow These Up
Trading the pattern, ignoring the location. The number one killer. Patterns in no-man's-land are noise. Level first, always.
Entering intrabar. The candle isn't a hammer until it closes a hammer. Jumping in with time left on the bar is trading a shape that doesn't exist yet. Wait for the close. Every time.
Skipping confirmation on the weak patterns. Inverted hammers, hanging men, haramis, spinning tops, dojis — these are warnings, and demand a confirming candle. Only the engulfing, the marubozu break, the shooting star/hammer at a strong level, and the three-candle patterns are strong enough to act near-immediately, and even they trade better on a pullback.
Ignoring volume. A reversal on no volume is a shrug. Demand participation.
Chasing extended candles. Buying the close of the third soldier or a big marubozu means a far stop and broken R/R. Wait for the pullback into the pattern. Patience is the entry.
Fighting the higher timeframe. A bullish 1m pattern against a bearish daily trend is trading into a headwind. Higher timeframe wins; align with it.
Forcing the 1:3. If the math doesn't work, don't "just take it." The rule protects you from your own pattern-recognition enthusiasm.
Manufacturing confluence. Seeing what you want to see — calling a loose double-touch a "tweezer," a 40% reclaim a "piercing line," a mediocre candle a "hammer." Weak pattern gets called weak. The market doesn't reward wishful reading.
When Patterns Fail — And What Failure Tells You
A failed pattern is itself a signal. When a bullish engulfing at support gives a clean setup and price instead breaks below the pattern low, that failure means demand couldn't hold a spot where it should have — supply is stronger than it looked. Failed bottoms often become fast shorts. The invalidation of your long is the thesis for the reverse.
This is why the stop is the read. When price violates the pattern's invalidation level, the story the candle told is proven false. Respect it instantly — the trader who "gives it room" past a broken hammer low is no longer trading a hammer, they're hoping. Discipline over prediction. The rules are the edge; the pattern is just the trigger that lets the rules fire.
The patterns that fail most: single candles without confirmation, anything in chop, reversals against a strong higher-timeframe trend, and continuation patterns at the end of extended moves (blow-off soldiers/crows). The patterns that fail least: three-candle reversals at major levels with volume and top-down alignment. Trade accordingly — size and conviction should scale with the confluence, not with how badly you want the trade.
The Full Cheat Sheet — Bookmark This
SINGLE CANDLE
| Pattern | Shape | Bias | Context | Trade Trigger | Stop |
|---|---|---|---|---|---|
| Doji | Open ≈ close, thin body | Indecision | End of trend | Break of doji range | Beyond doji extreme |
| Dragonfly Doji | T-shape, long lower wick | Bullish | At support | Break of high | Below low |
| Gravestone Doji | ⊥-shape, long upper wick | Bearish | At resistance | Break of low | Above high |
| Hammer | Small body top, long lower wick | Bullish | After downtrend | Break of high | Below low |
| Inverted Hammer | Small body bottom, long upper wick | Bullish | After downtrend | Confirmation candle | Below low |
| Hanging Man | Small body top, long lower wick | Bearish | After uptrend | Bearish confirmation | Above high |
| Shooting Star | Small body bottom, long upper wick | Bearish | After uptrend | Break of low | Above high |
| Bullish Marubozu | Big green, no wicks | Bullish cont. | Breakout/trend | Retest of break | Below break level |
| Bearish Marubozu | Big red, no wicks | Bearish cont. | Breakdown/trend | Retest of break | Above break level |
| Spinning Top | Small body, wicks both sides | Indecision | End of trend | Resolution candle | Beyond range |
TWO CANDLE
| Pattern | Structure | Bias | Trade Trigger | Stop |
|---|---|---|---|---|
| Bullish Engulfing | Green body swallows prior red | Bullish | Close or pullback | Below pattern low |
| Bearish Engulfing | Red body swallows prior green | Bearish | Close or pullback | Above pattern high |
| Bullish Harami | Small green inside big red | Bullish | Confirmation candle | Below big candle low |
| Bearish Harami | Small red inside big green | Bearish | Confirmation candle | Above big candle high |
| Tweezer Bottom | Two matched lows | Bullish | 2nd candle confirm | Below matched low |
| Tweezer Top | Two matched highs | Bearish | 2nd candle confirm | Above matched high |
| Piercing Line | Green closes >50% into prior red | Bullish | Close or confirm | Below pattern low |
| Dark Cloud Cover | Red closes >50% into prior green | Bearish | Close or confirm | Above pattern high |
THREE CANDLE
| Pattern | Structure | Bias | Trade Trigger | Stop |
|---|---|---|---|---|
| Morning Star | Red, small, big green | Bullish | 3rd close / pullback | Below star low |
| Evening Star | Green, small, big red | Bearish | 3rd close / pullback | Above star high |
| Three White Soldiers | 3 rising green | Bullish cont. | Pullback entry | Below recent soldier |
| Three Black Crows | 3 falling red | Bearish cont. | Pullback entry | Above recent crow |
| Three Inside Up | Harami + green break up | Bullish | 3rd confirming close | Below pattern low |
| Three Inside Down | Harami + red break down | Bearish | 3rd confirming close | Above pattern high |
| Three Outside Up | Engulf + green continue | Bullish | 3rd close / pullback | Below engulf low |
| Three Outside Down | Engulf + red continue | Bearish | 3rd close / pullback | Above engulf high |
THE CONFLUENCE CHECKLIST — before any candle becomes a trade:
- Macro tape supports the direction?
- Sector supports the direction?
- Pattern sits on a real level (S/R, EMA, VWAP, POC, fib)?
- Right side of the daily 55-EMA?
- Volume expanded on the signal candle?
- RSI / MACD confirm (divergence, cross)?
- Options positioning (walls) not blocking the path?
- Higher timeframe agrees?
- Does the setup give at least 1:3 R/R to real structure?
- Is the invalidation level crystal clear?
Nine and ten are the gates. If you can't state exactly where you're wrong, and the reward isn't three times that risk, you don't have a trade — you have a hope. Put it down.
Candlesticks aren't magic. They're a language — the recorded psychology of every fight between buyers and sellers, printed in bodies and wicks. Learn the vocabulary in this guide, but never forget the grammar: location, confluence, confirmation, and the 1:3 rule. The pattern tells you something might happen. The rules tell you whether to act, where you're wrong, and what you stand to make. Master both, and the chart stops being noise and starts being a conversation you can actually hear.
Bound by rules, feared by trade.