
Why patterns work at all
A chart pattern is not magic and it is not astrology. It is a picture of what a crowd of buyers and sellers did to each other over a defined window of time, drawn in price. Every pattern in this guide is really the same thing wearing different clothes: a fight between people who own the asset and people who want it, resolving into a moment where one side gives up. The shape tells you where they fought. The volume tells you how hard. The breakout tells you who won. Your job is to read all three and then wait — with discipline — for the tape to prove the winner before you commit a dollar.
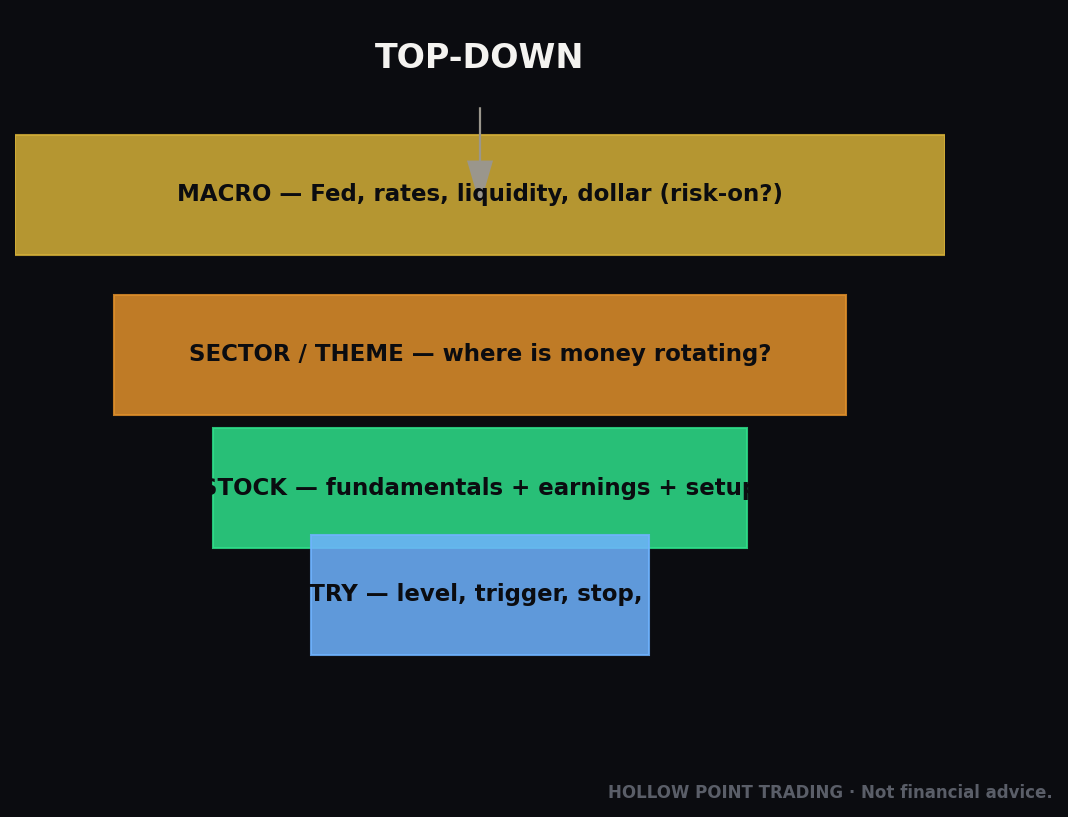
At Hollow Point we treat patterns as the bottom of a stack, not the top. The read always runs macro -> sector -> stock. A textbook inverse head and shoulders on a biotech means very little if the ten-year yield is ripping and the whole risk complex is bleeding. The pattern is the trigger; the macro and the sector are the permission. When all three point the same direction, you have confluence, and confluence is the only thing that pays.
Two ideas run through everything below and you should tattoo them on the inside of your eyelids.
The first is the measured move. Almost every pattern gives you a way to project a target off the size of the structure itself. The height of the pattern, added to (or subtracted from) the breakout point, is the market telling you how much energy is stored in the coil. This is what lets you size a trade to a real target instead of a hope.
The second is the HPT undercut-retest-breakout sequence, and it is the single most important thing in this document. The clean textbook breakout — price slicing straight through the neckline on a green candle — is the version that gets printed in books and the version that gets you stopped out. Real markets hunt liquidity. Before a durable move, price very often pokes through the obvious level in the wrong direction first, sweeping the stops of everyone who placed them at the textbook spot, and then reverses. The undercut is the fakeout. The retest is price coming back to the level to confirm it flipped from resistance to support (or the reverse). The breakout is the real move that follows, now standing on swept, exhausted supply. We will apply this three-beat sequence to every single pattern, because it is the difference between buying the trap and buying the release.
Now the terms, defined once. A swing high is a peak with lower highs on either side; a swing low is a trough with higher lows on either side. Structure is the sequence of those swings: higher highs and higher lows (HH/HL) is an uptrend, lower highs and lower lows (LH/LL) is a downtrend. The neckline is the horizontal (or lightly sloped) level that, once broken, confirms a pattern. Volume is the number of shares or contracts traded per bar — our fuel gauge. The EMA 12/22/55 framework is the HPT trend engine: price above a rising 55 is structurally bullish, below a falling 55 is structurally bearish, and the 12/22 cross times the shorter swings. And 1:3 R/R means we only take trades where the distance to our target is at least three times the distance to our stop. That single rule means we can be wrong more than half the time and still print money.
With that loaded, let's build the catalogue.
Part One: Reversal Patterns
A reversal pattern marks the end of a trend. Price was going one way, the pattern forms, and price leaves going the other way. The tell in every reversal is the same: the trend runs out of the fuel that was driving it. In an uptrend, that means buyers can no longer make higher highs; in a downtrend, sellers can no longer make lower lows. The pattern is the visual record of that exhaustion.
Head and Shoulders Top
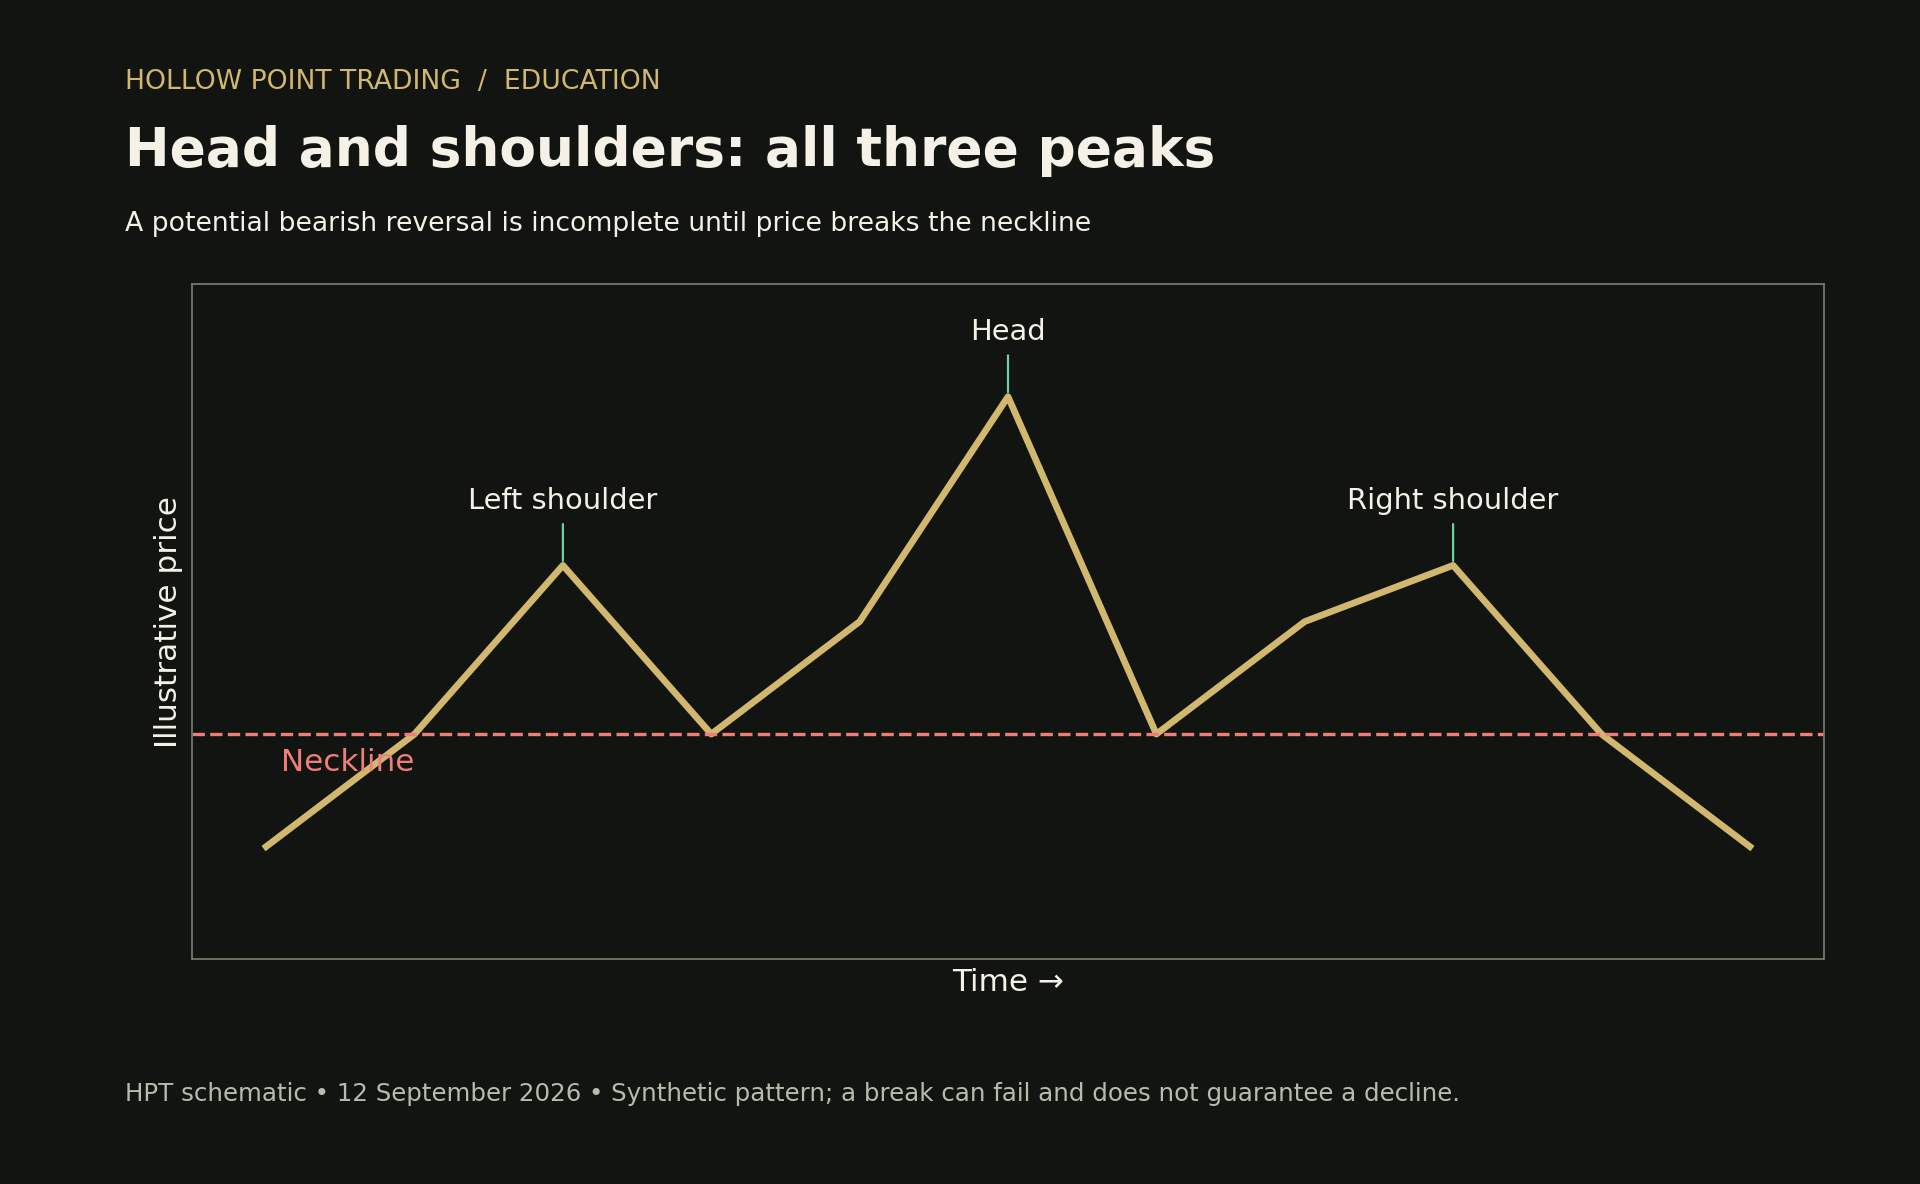
The head and shoulders is the most famous reversal pattern on earth, and for good reason — it maps exhaustion cleanly. It appears at the top of an uptrend and has three peaks. The left shoulder forms on a strong push up followed by a pullback. The head is a higher high — the last gasp of the trend, the point of maximum greed. The right shoulder is a lower high, the critical tell: buyers tried to make a new high and failed. The pullback lows from either side of the head define the neckline.
Structure: Left shoulder peak, higher head peak, lower right shoulder peak. The right shoulder failing to exceed the head is the whole story — it is the moment the trend's HH/HL sequence breaks.
Volume signature: This is what separates a real head and shoulders from a random squiggle. Volume should be highest on the left shoulder and the rally into the head, then lighter on the head's push than the left shoulder (early distribution), and lightest of all on the right shoulder. Declining volume across the three peaks is smart money selling into strength. The breakdown through the neckline should come on a volume expansion.
Measured move: Take the vertical distance from the top of the head to the neckline. Subtract that distance from the neckline at the breakdown point. If the head peaks at 220, the neckline sits at 200, the height is 20, and the target is 200 - 20 = 180.
Entry and invalidation: The textbook entry is the close below the neckline. The HPT entry is the retest — see below. Invalidation is a reclaim back above the neckline, or more conservatively a move back above the right shoulder high. That reclaim tells you the breakdown failed and the sellers who pressed it are now trapped.
Failure rate: Roughly 15-20% of confirmed head and shoulders tops fail to reach target, which makes it one of the more reliable patterns when confirmed. The catch is the word "confirmed" — unconfirmed H&S patterns (no neckline break) fail constantly, and most beginners front-run them.
HPT undercut-retest-breakout: The most tradeable version does not break the neckline cleanly. Instead price breaks the neckline, then throws back up into it — the retest — sweeping the stops of early shorts and tempting dip-buyers. That throwback into the underside of the neckline, rejecting there with the EMA 55 now overhead and rolling, is your short entry. Your stop goes above the retest high (a tight stop), your target is the measured move, and the geometry usually hands you a clean 1:3 or better. The "undercut" flavor on the top pattern is the false new high — the head or right shoulder poking marginally above the prior peak to trigger breakout-buyers before reversing. Same idea, mirror image: the trap comes first.
Inverse Head and Shoulders (Bottom)
Flip everything. The inverse head and shoulders forms at the bottom of a downtrend and signals a bullish reversal. A left shoulder low, a lower low for the head (maximum fear), a higher right shoulder low (sellers tried for a new low and failed), and a neckline across the two intervening rally highs.
Structure: The right shoulder's higher low is the first crack of a new HL — the birth of an uptrend.
Volume signature: Ideally volume dries up into the head (seller exhaustion) and then surges on the breakout above the neckline. Volume confirmation on the upside breakout matters more here than on tops, because tops can fall of their own weight but bottoms need active buying to lift.
Measured move: Height from the head low to the neckline, added to the neckline breakout point. Head at 80, neckline at 100, height 20, target 120.
Entry and invalidation: Textbook entry on the neckline break; HPT entry on the retest of the neckline as new support. Invalidation is a loss of the right shoulder low.
Failure rate: Similar to its cousin, around 15-20% when confirmed. Bottoms formed against a supportive macro backdrop fail less than bottoms fought against a falling market.
HPT sequence: The undercut is textbook-gorgeous here. Price forms the right shoulder, then dips below the right shoulder low or a nearby support shelf — a stop-run that shakes out the last weak longs and triggers breakdown shorts — before snapping back and driving through the neckline. That undercut-and-reclaim is a higher-probability long than chasing the clean break, because you enter with the sellers already trapped underneath you. Retest of the neckline from above, holding, with the 12 crossing up through the 22 and price reclaiming the 55, is the confirmation to press.
Double Top
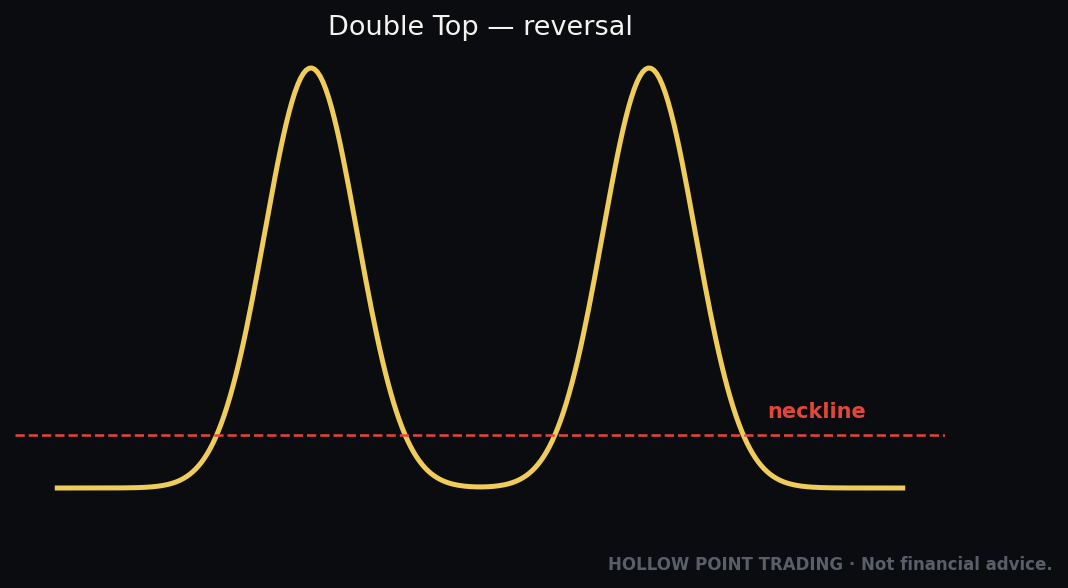
Two peaks at roughly the same price with a trough between them. The letter M. It says buyers tried the same ceiling twice and got rejected both times — supply is stacked at that level and demand cannot absorb it. The trough between the peaks defines the neckline; the break of that trough low confirms.

Structure: Peak, pullback to the intervening low, second peak that fails at or near the first, then break of the intervening low.
Volume signature: Lower volume on the second peak than the first is the tell — the second run at the highs came on weaker participation, meaning fewer real buyers. Breakdown expands volume.
Measured move: Height from the peaks to the neckline, projected down from the neckline break. Peaks at 50, neckline at 45, height 5, target 40.
Entry and invalidation: Enter on the neckline break or its retest. Invalidation is a reclaim above the neckline, and hard invalidation is a new high above the twin peaks.
Failure rate: Higher than head and shoulders — roughly 25-35% of double tops fail or reverse before target, largely because so many are called prematurely on the second touch before the neckline actually breaks. A double top is not a double top until the neckline goes.
HPT sequence: The classic trap is the marginal new high on the second peak — price ticks above the first peak by a hair, triggering breakout longs and running stops sitting above resistance, then rolls over hard. That failed breakout (an "undercut" of resistance from below, i.e. a false break up) is often a better short entry than the neckline break itself, because the reversal is fresh and violent. If you miss it, the neckline retest from below is your second chance.
Double Bottom
The mirror: two troughs at roughly the same price, the letter W. Sellers tried the same floor twice and could not break it. The intervening peak is the neckline; breaking above it confirms the bullish reversal.

Structure: Trough, bounce to the intervening high, second trough holding at or near the first, then break above the intervening high.
Volume signature: Ideally lighter volume on the second trough (seller exhaustion) and a volume surge on the breakout through the neckline.
Measured move: Height from troughs to neckline, added above the breakout. Troughs at 30, neckline at 35, height 5, target 40.
Entry and invalidation: Neckline break or retest as new support. Invalidation is a loss of the double-bottom lows.
Failure rate: 25-35%, same caution as the double top — the second bottom is not confirmation, the neckline break is.
HPT sequence: The money version is the undercut of the first low. Price makes the first bottom, bounces, then on the second leg dips marginally below the first low — sweeping the stops parked under obvious support and triggering breakdown shorts — before reversing sharply. This "undercut and rally" is one of the single highest-probability long setups in all of trading, because you know exactly where you are wrong (back below the swept low) and the trapped shorts become your fuel. Retest of the neckline from above with the 55 flattening and turning up seals it.
Triple Top and Triple Bottom
Three touches instead of two. A triple top is three failed pushes into the same ceiling; a triple bottom is three failed probes of the same floor. The logic intensifies with each touch — more sellers (or buyers) proven present at the level — but so does the risk that the level finally breaks through rather than reversing, because heavily-tested levels weaken.
Structure: Three peaks (or troughs) at a common level with two intervening swings. The neckline is the extreme of the intervening swings; break confirms.
Volume signature: Declining volume across the three touches (top) or drying up across the three probes (bottom), with expansion on the confirming break.
Measured move: Pattern height projected from the neckline break, same method as the doubles.
Entry and invalidation: Break or retest of the neckline. Invalidation is a fourth touch that breaks through the level instead of reversing.
Failure rate: Comparable to doubles, 25-35%, with the added nuance that the more times a level is tested, the more likely it eventually snaps — so triples that drag on are more dangerous than clean ones.
HPT sequence: Same trap logic. The third touch frequently overshoots the prior two by a hair — the undercut/overshoot that runs stops — before the reversal. Enter on the reclaim, not the poke.
Rounding Top and Rounding Bottom
Slow, curved reversals with no sharp neckline — a gradual roll of sentiment rather than a violent flip. The rounding bottom (the "saucer") is the more famous and more reliable: price grinds down, flattens, and curves back up in a smooth arc, often over weeks or months. The rounding top is its bearish mirror, an inverted-U dome.

Structure: No single neckline — instead a smooth parabola. Confirmation comes when price breaks out above the left-side high of the saucer (bottom) or below the left-side low of the dome (top).
Volume signature: The most beautiful volume signature in all of chart-reading. On a rounding bottom, volume forms its own bowl — high on the way down, drying to almost nothing at the base (total apathy, the point of maximum boredom), then rising again on the way up. Volume tracks the price arc.
Measured move: Depth of the bowl from the base to the breakout level, projected up (or down for a dome).
Entry and invalidation: Enter on the breakout above the rim, or on the first pullback that holds the breakout level. Invalidation is a return into the bowl below the rising 55.
Failure rate: When the full arc is present with the matching volume bowl, rounding bottoms are quite reliable — roughly 20% failure. The problem is they are slow, and impatience kills more of these trades than the pattern does.
HPT sequence: Because there is no sharp neckline, the undercut-retest logic applies at the rim. Price breaks the rim, pulls back to it, the old rim resistance becomes support, and the 12/22/55 stack turns up in order — that retest-hold is the entry. The saucer with handle is simply a cup and handle, which we cover in the continuation section since it more often marks a pause than a bottom.
Part Two: Continuation Patterns
A continuation pattern is a pause, not a reversal. The trend pushes, gets tired, consolidates sideways or against itself to work off the overbought or oversold condition and let laggards get positioned, and then resumes in the original direction. The mental model: a runner catching their breath, not quitting the race. The single biggest edge in trading is that trends continue more often than they reverse, which is why continuation patterns — traded in the direction of the existing trend and the EMA 55 — are the bread and butter of professional books.
The prerequisite for every continuation pattern is a prior trend — the "flagpole" or "pole." No pole, no continuation pattern. A flag in a sideways chop is just chop.
Bull Flag
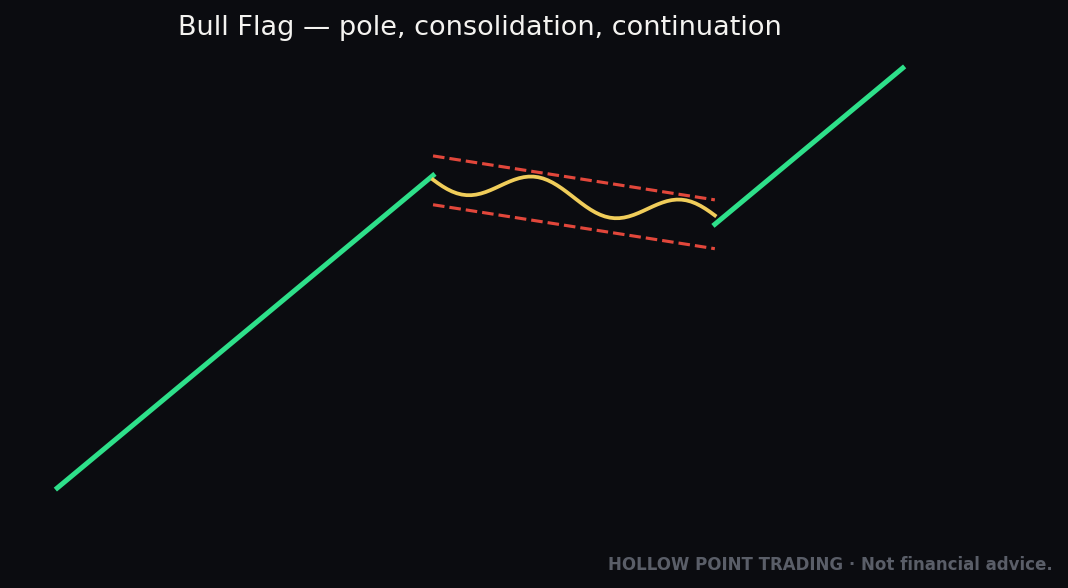
The workhorse. A sharp, near-vertical rally (the pole) followed by a shallow, orderly pullback that drifts down and against the trend inside two parallel lines (the flag). It looks like a flag on a pole. The pullback is buyers taking profit and new buyers stepping in lower — controlled, not panicked.

Structure: Steep pole up, then a tight parallel channel sloping gently down (counter to the trend). The counter-slope is important — a bull flag drifts against the move; if it drifts with the move it is a rising wedge, which is bearish.
Volume signature: Heavy volume on the pole, declining volume through the flag (consolidation on drying volume = healthy), then a volume surge on the breakout above the flag's upper trendline. The volume dry-up in the flag is the tell that this is rest, not distribution.
Measured move: Take the height of the pole and add it to the breakout point. Pole runs from 100 to 120 (height 20), flag pulls back to 115, breakout at 118, target 118 + 20 = 138. A common simplification: the pole's height added to the low of the flag.
Entry and invalidation: Enter on the break of the flag's upper trendline, or on the retest of that line from above. Invalidation is a break below the flag's lower trendline, or a close back below the pole's origin.
Failure rate: Bull flags in strong, liquid uptrends are among the most reliable patterns, roughly 15-20% failure. Failures cluster where the "flag" is actually too deep (retracing more than ~50% of the pole, which signals the trend is genuinely weakening) or where there was no real pole to begin with.
HPT sequence: The clean flag break gets front-run constantly, so the durable version undercuts the flag low first — a quick stab below the lower trendline that runs the stops of everyone who set them under the obvious flag support, then immediately reclaims and rips. That "shakeout" bottom inside or just below the flag, followed by reclaim of the flag and the 12 EMA, is the highest-conviction long. Retest of the broken upper trendline as support, holding above a rising 22 and 55, is the confirmation entry with a tight stop under the retest low — textbook 1:3 geometry.

Bear Flag
The exact mirror in a downtrend. A steep drop (the pole down), then a shallow upward-drifting consolidation channel (the flag), then a breakdown continuation lower.
Structure: Steep pole down, tight parallel channel sloping gently up against the downtrend.
Volume signature: Heavy on the pole down, drying up through the counter-trend bounce, expanding on the breakdown.
Measured move: Pole height subtracted from the breakdown point. Pole from 100 to 80 (height 20), flag bounces to 85, breakdown at 83, target 83 - 20 = 63.
Entry and invalidation: Break of the flag's lower trendline or its retest from below. Invalidation is a reclaim above the flag's upper trendline or the pole's origin.
Failure rate: 15-25%. Bear flags fail more than bull flags in secular bull markets because the macro tide fights them — another reminder that the pattern lives inside a bigger context.
HPT sequence: The undercut here is an overshoot up — price pokes above the flag's upper trendline, running the stops of the shorts and sucking in breakout longs, before rolling back down through the flag. That failed upside break is your short trigger. Retest of the broken flag from below, rejecting under a falling 55, presses the trade.
Pennant
A pennant is a flag's cousin: same steep pole, but instead of a parallel channel the consolidation is a small symmetrical triangle — converging trendlines, a tightening coil. It forms faster than a flag (usually one to three weeks) and represents a sharp, brief equilibrium before continuation.

Structure: Sharp pole, then a small triangle of converging highs and lows. Bullish pole = bull pennant (breaks up); bearish pole = bear pennant (breaks down).
Volume signature: Classic triangle volume — a steady contraction of volume as the coil tightens (the market holding its breath), then an explosion of volume on the breakout in the pole's direction.
Measured move: Pole height projected from the breakout, same as a flag.
Entry and invalidation: Breakout from the pennant in the trend direction, or the retest. Invalidation is a breakout the wrong way (against the pole), which turns the pennant into a failure/reversal.
Failure rate: 20-30%. Pennants are reliable when the pole is genuinely steep and volume contracts cleanly, but their small size makes them easy to misread — a lot of "pennants" are just noise.
HPT sequence: Because the coil is small, the stop-run is small and quick — a poke below the lower trendline (bull pennant) that sweeps stops before the reclaim and rip. Enter the reclaim, not the poke. The apex of the pennant is a natural line in the sand for the 55 EMA to align with.
Symmetrical Triangle
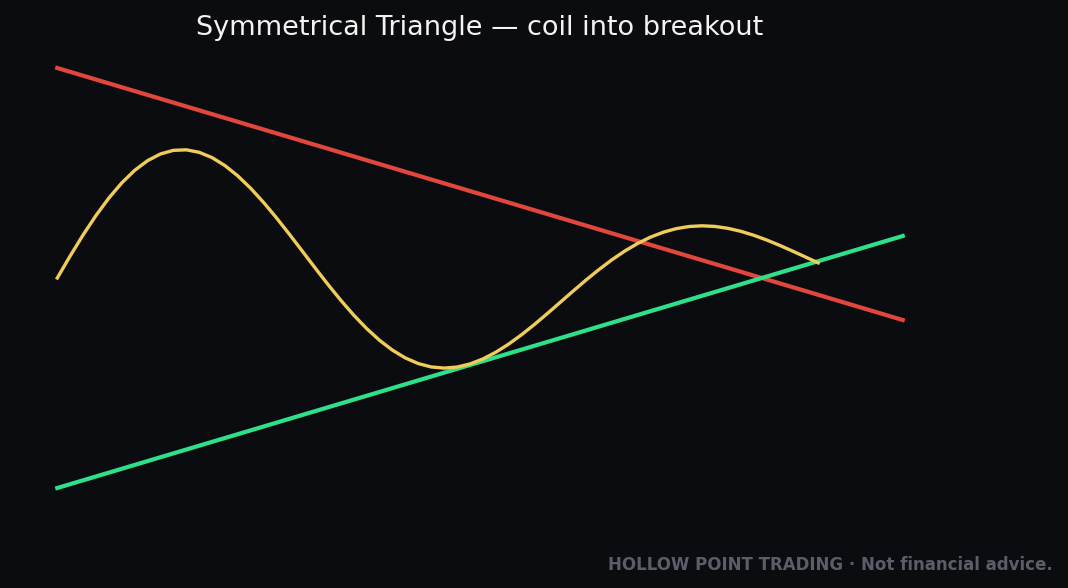
Now we move to the triangle family proper, which can be continuation or reversal but resolve as continuations more often. A symmetrical triangle has a descending upper trendline (lower highs) and an ascending lower trendline (higher lows) converging toward an apex. It is a picture of compression: buyers bidding higher lows, sellers pressing lower highs, the range squeezing until something snaps. It is directionally neutral by itself — you trade the break, not a prediction.

Structure: At least two lower highs and two higher lows forming converging lines. The break usually comes around 60-75% of the way to the apex; a break too close to the apex (past ~75%) is weaker, as the energy has dissipated.
Volume signature: Volume contracts as the triangle matures (the coil tightening), then expands sharply on the breakout. A breakout on weak volume is suspect and prone to failing back into the range.
Measured move: Two methods. (1) The height of the triangle at its widest (the base), projected from the breakout point. (2) Draw a line parallel to the opposite trendline from the breakout — the apex-line projection. Base of 20 with breakout at 100 targets 120 up or 80 down.
Entry and invalidation: Enter on the breakout with volume, or on the retest of the broken trendline. Invalidation is a re-entry into the triangle after a break (a failed breakout) — that snap-back often runs hard the other way.
Failure rate: 25-40% including false breaks, which are common in symmetrical triangles precisely because they attract breakout traders on both sides. Waiting for the retest cuts this dramatically.
HPT sequence: The symmetrical triangle is the poster child for undercut-retest-breakout because it produces so many false breaks. Price breaks one line, sucks in traders, then reverses through the other line — the true move. The disciplined play is to let the first break happen, watch for the reclaim/rejection, and enter on the confirmed direction with the trend and the 55 as your tiebreaker: in an uptrend with a rising 55, favor the upside resolution; in a downtrend, the downside. Confluence resolves the ambiguity the shape leaves open.
Ascending Triangle
A flat upper trendline (a horizontal resistance ceiling being tested repeatedly) and a rising lower trendline (higher lows). This is bullish by construction: buyers are stepping up and paying higher and higher prices while sellers defend one fixed ceiling. Each higher low eats into the supply until the ceiling cracks. In an uptrend it is a continuation; even at the end of a downtrend it often resolves up.
Structure: Horizontal resistance across two or more equal highs; ascending support across two or more higher lows.
Volume signature: Volume contracts into the apex, then surges on the breakout above the flat ceiling. Ideally you also see volume ticking up on each successive push into resistance — buyers getting more aggressive.
Measured move: Height of the triangle (from the flat top down to the start of the rising line) added to the breakout. Ceiling at 50, base at 40, height 10, target 60.
Entry and invalidation: Break above the flat resistance, or the retest of that broken ceiling as new support. Invalidation is a break below the ascending trendline, which kills the higher-low sequence.
Failure rate: 20-30%. Ascending triangles are reliable when they form in an uptrend with the 55 rising beneath them; they fail more when forced against a bearish macro.
HPT sequence: The horizontal ceiling is a stop-magnet. The high-probability version undercuts the rising trendline first — a stab down that runs the higher-low stops and shakes out weak longs — then reclaims and drives through the ceiling. Alternatively, price makes a false break above the ceiling, snaps back to run breakout stops, then does it for real on the retest. Enter the reclaim over the ceiling with a rising 12/22/55 stack; stop under the retest low; measured move gives you the 1:3.
Descending Triangle
The bearish mirror: a flat lower trendline (horizontal support tested repeatedly) and a descending upper trendline (lower highs). Sellers press lower highs while buyers defend one fixed floor, and each lower high grinds down the demand until the floor gives way.
Structure: Horizontal support across equal lows; descending resistance across lower highs.
Volume signature: Volume contracts into the apex, expands on the breakdown below the flat floor.
Measured move: Height of the triangle subtracted from the breakdown. Floor at 40, top at 50, height 10, target 30.
Entry and invalidation: Break below the flat support, or retest of that broken floor as new resistance. Invalidation is a break above the descending trendline.
Failure rate: 20-30%, with the same macro caveat inverted — descending triangles fail more in strong bull markets, where flat "support" keeps getting bought.
HPT sequence: The flat floor is where every stop hides, so the pattern loves to undercut it: a stab below support that runs stops and triggers breakdown shorts, then a snap back up — the bear trap — before the real move. Because of this, the cleanest short is often not the first break of the floor but the retest of the broken floor from below, rejecting under a falling 55. If instead the floor undercut reclaims and holds, respect it — that failed breakdown flips the pattern and you stand aside or flip long.
Rising Wedge
Wedges are triangles where both lines slope the same direction. A rising wedge has both trendlines sloping up, but the lower line rises faster than the upper — the range is narrowing as price grinds higher on weakening momentum. Despite rising prices, it is a bearish pattern. It is the picture of a rally running out of gas: each new high comes on less thrust, higher lows crowding the highs, until support breaks and price falls.
Structure: Two upward-sloping, converging trendlines; lower slope steeper than upper. Can appear as a reversal at the top of an uptrend or as a continuation in a downtrend (a bear-flag-like bounce that wedges up before rolling over).
Volume signature: Volume declines as the wedge rises — the crucial tell that the advance is hollow. Breakdown comes on expanding volume.
Measured move: Conservative target is the origin of the wedge — where the two lines began. Many traders project the height of the wedge's back (widest part) down from the break.
Entry and invalidation: Break below the lower trendline, or its retest from below. Invalidation is a decisive reclaim back into and above the wedge.
Failure rate: 30-40% — wedges are among the most subjectively drawn and therefore most failure-prone patterns. They pay when volume confirms the hollow rally; they trap when you force the lines.
HPT sequence: The rising wedge frequently makes one final overshoot above the upper line — a stop-run high that suckers in the last breakout longs — before breaking down. That failed new high is the tell. Enter short on the break of the lower line's retest, with the 55 rolling over above, stop over the wedge high, target back toward the wedge origin.
Falling Wedge
The bullish mirror. Both trendlines slope down and converge, with the upper line falling faster than the lower — price grinding lower on fading selling pressure. It is a bullish pattern: sellers are exhausting themselves, lower lows come on less force, and eventually buyers break resistance to the upside. Appears as a reversal at the bottom of a downtrend or as a bull-flag-like continuation dip in an uptrend.
Structure: Two downward-sloping converging trendlines; upper slope steeper than lower.
Volume signature: Volume declines through the wedge (selling drying up), surges on the upside breakout.
Measured move: Conservative target is the wedge's origin; aggressive is the back-height projected up from the break.
Entry and invalidation: Break above the upper trendline, or its retest as support. Invalidation is a break below the lower line.
Failure rate: 30-40%, same subjectivity caveat as the rising wedge.
HPT sequence: The falling wedge loves a final undercut low — a marginal new low below the lower line that runs the stops of trapped longs and triggers fresh shorts, then reverses hard through the upper line. That undercut-and-reclaim is the entry, with the 12 crossing up through the 22 and price reclaiming the 55. Retest of the broken upper line from above confirms; stop under the undercut low; measured move to the wedge origin or beyond gives the 1:3.
Rectangle / Trading Range
A rectangle is a horizontal channel — price oscillating between a flat support floor and a flat resistance ceiling, at least two touches each. It is pure equilibrium: buyers and sellers agreeing to disagree inside a defined box. As a continuation pattern it forms mid-trend (a pause), and it resolves in the trend's direction more often than not, though it can be traded either way — range-bound between the walls, or on the eventual breakout.
Structure: Parallel horizontal support and resistance, multiple touches each, no directional bias within the box.
Volume signature: Volume tends to be flat-to-declining inside the range (indecision), then expands on the breakout. Watch for volume rising on pushes toward one wall — that hints at the eventual breakout direction.
Measured move: Height of the box projected from the breakout. Box from 40 to 50 (height 10), break above 50 targets 60; break below 40 targets 30.
Entry and invalidation: Two styles. Range trade: buy the support retest, sell the resistance retest, stops just outside the box. Breakout trade: enter on the confirmed break of a wall or its retest. Invalidation is a re-entry into the box after a break (failed breakout) or a break of the opposite wall in the range trade.
Failure rate: Breakouts from rectangles false-break frequently — 30-40% including fakeouts — because the walls are obvious and stops pile up just outside them. The retest filters most of this.
HPT sequence: The rectangle is a stop-hunt machine precisely because the walls are so clean. Expect the undercut of support (or overshoot of resistance) to run the stops parked just outside the box before the real move — often in the opposite direction of the fake. The disciplined play: let the wall get poked, watch whether price reclaims the box (fakeout, fade it back to the other wall) or holds outside on a retest (real breakout, join it). Trend and the 55 break the tie on which resolution to favor.
Cup and Handle
The cup and handle is a bullish continuation (occasionally a bottoming reversal) that looks exactly like its name: a rounded "U" cup — a saucer-shaped consolidation — followed by a smaller, shallower pullback (the handle) on the right side, then a breakout. William O'Neil made it famous; it is the signature base of many big growth-stock runs. The cup is the market digesting a prior advance in a smooth, patient bowl; the handle is the final shakeout of weak hands before the launch.
Structure: A prior uptrend into the left rim, a rounded U-shaped cup (avoid sharp V-bottoms — the roundness signals healthy digestion), a recovery to the right rim near the old high, then a small handle drifting down in the upper third of the cup (a shallow pullback, ideally retracing less than a third of the cup's depth), then breakout above the rim/handle resistance.
Volume signature: Volume drops into the base of the cup (apathy at the bottom), rises as price recovers the right side, dries up again through the handle (the final shakeout on light volume), then explodes on the breakout. This volume pattern is the pattern's fingerprint — a cup and handle without the breakout volume surge is suspect.
Measured move: Depth of the cup (rim to base) added to the breakout point. Rim at 100, base at 80 (depth 20), breakout at 101, target 101 + 20 = 121. A more conservative version uses the handle's height.
Entry and invalidation: Break above the handle's resistance (or the rim), ideally on the retest of that breakout as support. Invalidation is a break below the handle's low, and hard invalidation is a fall back below the mid-point of the cup.
Failure rate: 20-30% when the full structure and volume are present; much higher when the "cup" is a sharp V or the handle is too deep (a deep handle means the base is not done). Patience separates the winners.
HPT sequence: The handle is the undercut. The most powerful cup and handle breaks make a marginal new low below the handle — running the stops of everyone who bought the handle and triggering shorts — before reclaiming and blasting through the rim. That undercut-of-the-handle-low then reclaim is the tell that supply is finally exhausted. Enter on the reclaim of the handle high / rim, with the 12/22/55 stacking up in order beneath price; stop under the handle undercut low; measured move to the cup-depth target hands you the 1:3 or better. Retest of the broken rim as support is the second-chance entry for anyone who missed the initial break.
Making Patterns Pay: Confluence, Sizing, and Discipline
A pattern by itself is a coin flip with an edge. Stacked with confluence, it becomes a trade. Here is how HPT turns shapes into risk.
Never trade a pattern naked
Every pattern in this guide should be checked against the same confluence stack before you commit:
- Macro -> sector -> stock. Is the broad tape (indices, yields, dollar, VIX) supporting the direction the pattern implies? Is the sector leading or lagging? A bullish pattern in a leading sector during a risk-on tape is a different animal from the same pattern in a bleeding sector against a falling market. The pattern is the trigger; the top-down context is the permission.
- EMA 12/22/55. Is the pattern resolving with the 55? A bull flag above a rising 55, breaking as the 12 crosses up through the 22, is confluence. The same flag below a falling 55 is fighting the tide. The daily 55 is the bias tell.
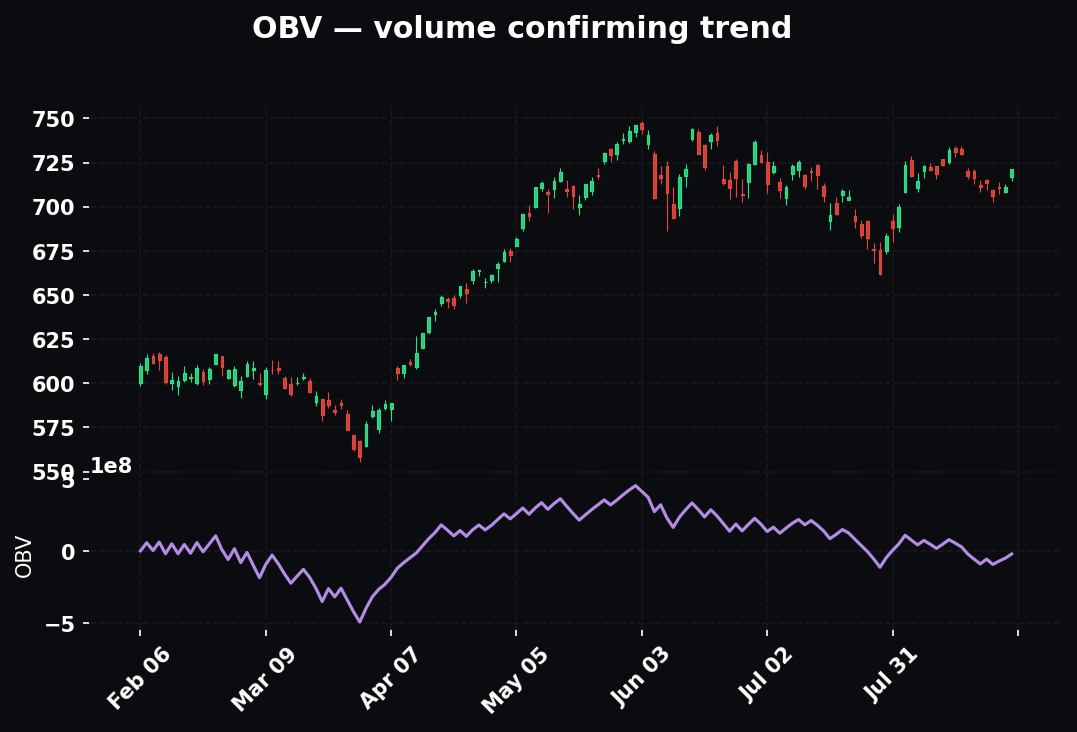
- Volume. Does the volume signature match the pattern? Contraction into the coil, expansion on the break. If volume disagrees with the shape, believe the volume.
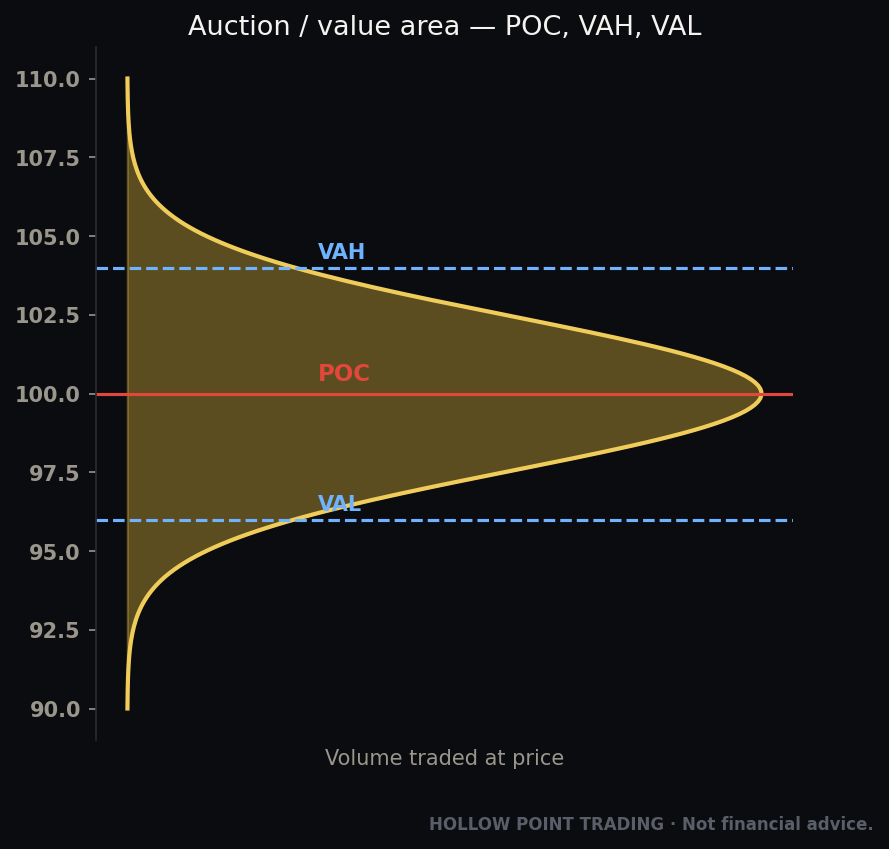
- Levels. Does the breakout align with prior structure — a prior high, a value area edge, a round number, a session level? A neckline that also sits at the prior swing high is worth more than one floating in space.
- Multiple timeframes. Does the higher timeframe agree? A 15-minute bull flag inside a daily downtrend is a lower-quality trade than one nested inside a daily uptrend. Timeframes that agree are confluence; timeframes that disagree are your warning.
Size to the measured move, respect 1:3
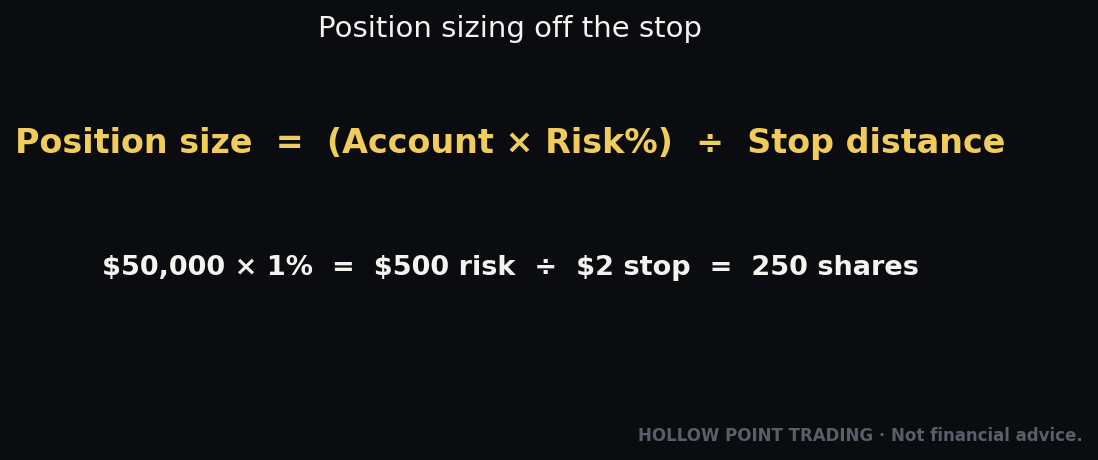
Once you have the pattern and the confluence, the measured move gives you a target and the invalidation gives you a stop. Do the arithmetic before you enter. If the distance from your entry to the target is not at least three times the distance from your entry to your stop, the trade does not qualify — pass it, no matter how pretty the pattern. This one rule is why HPT can be wrong on more than half of trades and still compound. The undercut-retest entries throughout this guide exist largely because they tighten the stop — entering on the retest with a stop just under the swept low shrinks your risk and stretches your R/R into 1:3+ territory on setups that would only be 1:1 if you chased the naked breakout.
Discipline over prediction
The final and most important idea. You do not need to predict which way a symmetrical triangle breaks, whether a double top confirms, or if a cup and handle completes. You need to react to what the tape actually does, with a plan already written. Wait for the neckline break. Wait for the undercut and reclaim. Wait for the retest to hold. The market pays patience and punishes anticipation. Front-running an unconfirmed pattern — calling the double top on the second touch, buying the flag before it breaks — is where the failure rates in this guide come to collect. The pattern is not a prediction; it is a conditional plan. If X happens, I do Y, risking Z to make 3Z. If X does not happen, I do nothing. Nothing is a position.
Common Mistakes That Turn Winning Patterns Into Losers
- Trading the pattern before it confirms. The single most expensive error. A shape is not a signal until the level breaks and holds. Most published failure rates assume confirmation; unconfirmed patterns fail far more.
- No prior trend for a continuation pattern. A flag or pennant in sideways chop is not a flag. Continuation patterns require a pole.
- Ignoring volume. A breakout on weak volume is the market whispering that it does not mean it. Volume divergence from the pattern's signature is a veto.
- Forcing the lines. Wedges and triangles are drawn subjectively, and the human eye finds patterns that are not there. If you have to cheat the trendline to make it touch, it is not a pattern.
- Chasing the naked breakout instead of waiting for the retest or undercut-reclaim. This is how you buy the trap. The clean break is the version that runs your stops.
- Fighting the macro and the 55. A perfect pattern against the higher-timeframe trend is a low-probability trade. Confluence, or pass.
- Skipping the R/R math. If it is not 1:3, it is not a trade, however good the chart looks.
- Marrying a losing pattern. When invalidation prints — a reclaim of the neckline, a re-entry into the range, a break of the flag the wrong way — you are out. A failed pattern often runs hard the other way; the fastest money is sometimes trading the failure.
When Patterns Fail — And How to Trade the Failure
Every pattern has an invalidation, and every invalidation is itself a signal. A double bottom that breaks its neckline, retests, and then loses the neckline anyway is a failed double bottom — and the trapped longs who bought the break become fuel for a fast move down. A head and shoulders whose breakdown gets reclaimed above the neckline traps the shorts and often rockets. The undercut-retest-breakout framework already builds this in: when the undercut does not reclaim — when the stop-run keeps going instead of reversing — that is the pattern failing, and it is frequently the highest-momentum trade on the board, taken in the opposite direction with the same discipline. The lesson: do not be attached to a direction. Be attached to your plan, your stop, and your 1:3. The tape will tell you which way it wants to go; your job is to be positioned with risk defined when it does.
The Complete Cheat Sheet
Reversal patterns — mark the end of a trend:
| Pattern | Shape | Volume tell | Target (measured move) | Failure rate* |
|---|---|---|---|---|
| Head & Shoulders Top | 3 peaks, middle highest | Declining across peaks; surge on break | Head-to-neckline, projected down | 15-20% |
| Inverse H&S | 3 troughs, middle lowest | Dries into head; surge on break up | Head-to-neckline, projected up | 15-20% |
| Double Top (M) | 2 equal peaks | Lower on 2nd peak | Height projected down | 25-35% |
| Double Bottom (W) | 2 equal troughs | Lower on 2nd trough; surge up | Height projected up | 25-35% |
| Triple Top/Bottom | 3 touches of a level | Declining touches; surge on break | Height projected off neckline | 25-35% |
| Rounding Top/Bottom | Smooth dome / saucer | Volume forms matching bowl | Depth projected off rim | ~20% |
Continuation patterns — mark a pause in a trend:
| Pattern | Shape | Volume tell | Target (measured move) | Failure rate* |
|---|---|---|---|---|
| Bull Flag | Pole up, channel drifts down | Dries in flag; surge on break up | Pole added to breakout | 15-20% |
| Bear Flag | Pole down, channel drifts up | Dries in flag; surge on break down | Pole subtracted from break | 15-25% |
| Pennant | Pole + small symmetrical triangle | Contracts in coil; surge on break | Pole projected from break | 20-30% |
| Symmetrical Triangle | Converging highs & lows | Contracts; surge on break | Base projected from break | 25-40% |
| Ascending Triangle | Flat top, rising lows | Contracts; surge on break up | Height added to breakout | 20-30% |
| Descending Triangle | Flat bottom, falling highs | Contracts; surge on break down | Height subtracted from break | 20-30% |
| Rising Wedge | Both lines up, converging | Declines as it rises (hollow) | Toward wedge origin (down) | 30-40% |
| Falling Wedge | Both lines down, converging | Declines as it falls (drying) | Toward wedge origin (up) | 30-40% |
| Rectangle / Range | Flat top & bottom box | Flat inside; surge on break | Box height off breakout | 30-40% |
| Cup & Handle | U-cup + small handle | Bowl-shaped; surge on break up | Cup depth added to breakout | 20-30% |
Failure rates are practitioner estimates for confirmed* patterns and vary with market conditions; treat them as relative reliability, not guarantees. Unconfirmed patterns fail far more.
The HPT three-beat, for every pattern:
- Undercut — price sweeps the obvious level the wrong way first, running stops and trapping the crowd.
- Retest — price returns to the broken level; old resistance becomes support (or the reverse), confirming the flip.
- Breakout — the real move, standing on swept supply, entered with a tight stop under the sweep for a 1:3 or better.
The pre-trade checklist:
- Prior trend present (for continuations)? Pole confirmed?
- Volume signature matches the pattern?
- Macro -> sector -> stock aligned?
- Resolving with the EMA 12/22/55, daily 55 as bias?
- Breakout aligns with a real level, and higher timeframe agrees?
- Confirmed break — not anticipated?
- Undercut-reclaim or retest entry, not a naked chase?
- R/R at least 1:3 with a defined invalidation?
If every box is checked, you have a trade. If one is not, you have a chart to watch. Discipline over prediction, always.
Patterns do not predict the future. They organize the present into a set of if-then plans with defined risk, and they hand the edge to the trader patient enough to wait for confirmation and disciplined enough to honor invalidation. Learn the shapes cold, respect the volume, stack the confluence, size to the measured move, and let the tape prove the winner before you commit. The market rewards the trader who reacts to what is, not the one who marries what they hope.
Bound by rules, feared by trade.
Not financial advice.