
TradingView is the most-used charting platform on earth, and most people touch maybe ten percent of it. They open a chart, slap on an RSI, draw a trendline, and call it a day. That is a waste. Underneath the clean interface is a full trading cockpit: a screener that filters thousands of symbols in a second, an alert engine that watches the tape while you sleep, a replay tool that lets you re-trade any day in history, a scripting language that lets you build your own indicators, and a broker bridge that lets you fire orders straight off the chart.
This is the definitive walkthrough. Zero to pro. We go through account setup, every corner of the interface, every chart type, every drawing tool, alerts, watchlists, the screener, bar replay, multi-chart layouts, hotkeys, Pine Script, and connecting a broker. Then we close with exactly how Hollow Point Trading uses TradingView to run a top-down read — macro to sector to stock — so this stops being a feature tour and becomes a way to trade.
One standing note before we start: TradingView ships changes constantly. Button positions, menu names, and plan pricing move around. Where a detail is likely to have shifted since this was written, we flag it — treat the layout descriptions as "current as of the 2026 interface," and if a button isn't where we say, right-click around it or check the settings gear. The concepts don't move even when the pixels do.
1. What TradingView Actually Is
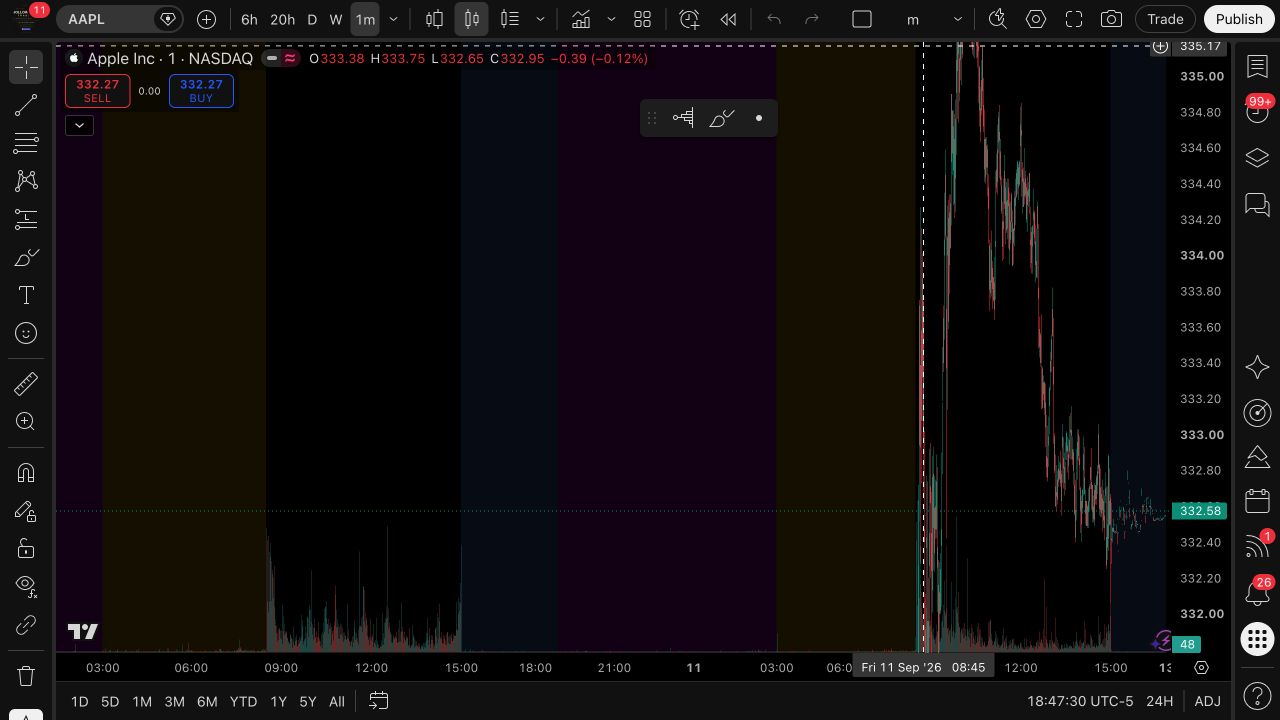
At its core, TradingView is a charting and market-analysis platform that runs in the browser, as a downloadable desktop app, and on mobile. It pulls live and historical data across essentially every asset class — U.S. and global stocks, futures, forex, crypto, bonds, indices, ETFs, and economic data — and renders it on charts you can mark up, script, and automate.
Three things made it dominant:
- It's cloud-based. Your charts, drawings, indicators, watchlists, and alerts live on your account, not your machine. Log in from any device and your setup is there.
- It has a community layer. Millions of published scripts and ideas. If you can imagine an indicator, someone has probably already built a version in Pine Script and shared it for free.
- It became a broker front-end. You can now connect a live brokerage account and trade directly from the chart, which turned a charting tool into an execution platform.
For an HPT trader, TradingView is the single pane of glass: the read, the levels, the alerts, and increasingly the execution all happen in one place.
2. Accounts and Plans
You start with a free account. Sign up with an email, Google, Apple, or another provider. The free tier — Basic — is genuinely usable: charting, community scripts and paper trading, with limits on indicators, layouts, history and data access. Its limits are the reason people upgrade.
The plan ladder
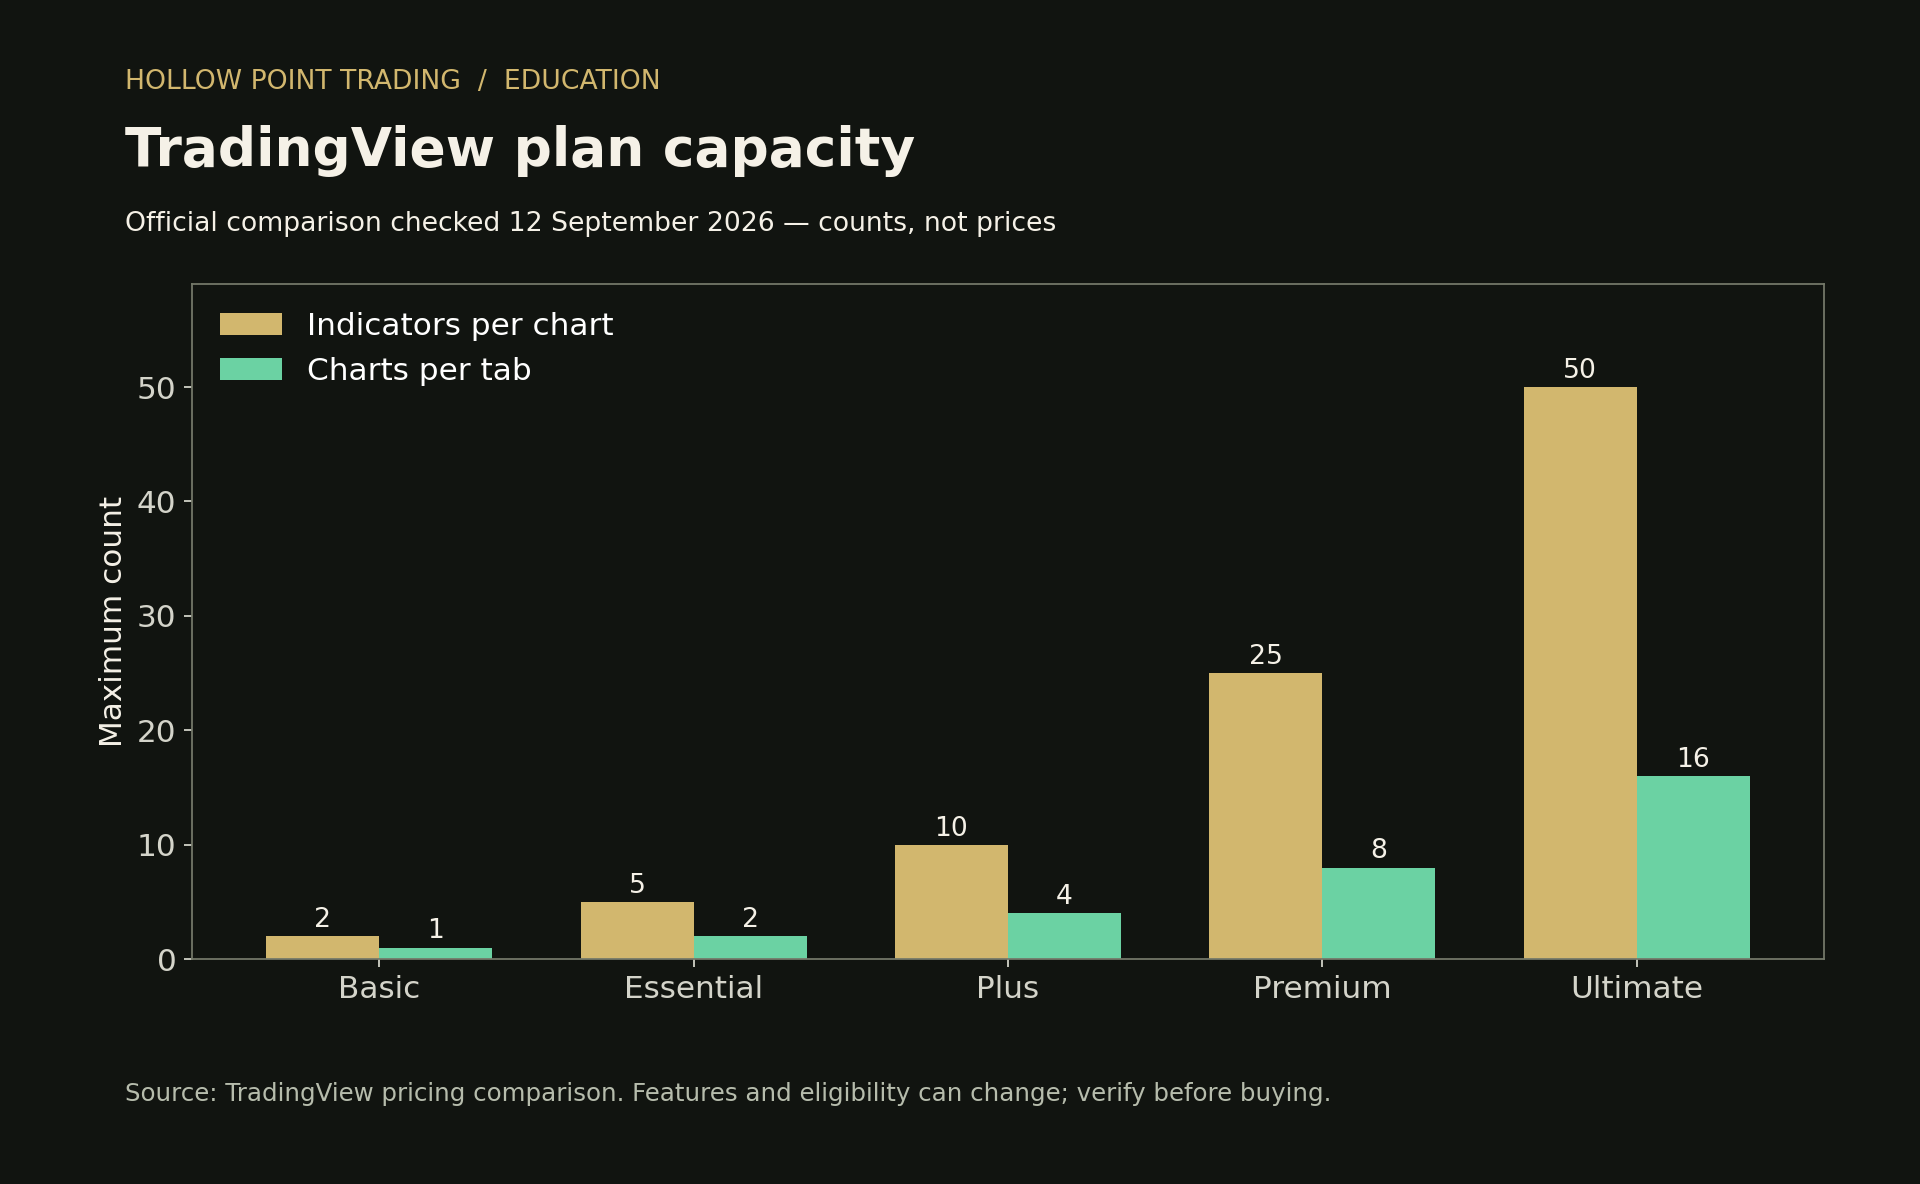
As of the 2026 pricing structure, the paid tiers run Essential → Plus → Premium → Ultimate, sitting above free Basic. (Plan names and prices change more often than any other detail in this guide — TradingView has renamed tiers several times, so verify the exact numbers on the live pricing page before you buy. The shape of the ladder is what matters.)
Here is what actually changes as you climb, and what each limit means for a working trader:
| Capability | Basic (free) | Essential | Plus | Premium | Ultimate |
|---|---|---|---|---|---|
| Indicators per chart | 2 | 5 | 10 | 25 | 50 |
| Charts per layout (tab) | 1 | 2 | 4 | 8 | 16 |
| Price alerts | 3 | 20 | 100 | 400 | 1,000 |
| Technical (indicator) alerts | 0 | 20 | 100 | 400 | 1,000 |
| Alert expiration | monthly | longer | longer | never | never |
| Daily-and-higher Bar Replay history | available history | available history | available history | available history | available history |
| Intraday data granularity | minute | minute | minute | seconds | seconds |
| Ads | yes | none | none | none | none |
| Parallel chart connections | 2 | 10 | 20 | 50 | 200 |
How to actually choose
- Basic is the right place to learn. Don't pay until a specific limit is physically stopping you from doing your job.
- The two-indicator cap on free is what breaks first. The moment you want price + volume + RSI + your EMA stack + VWAP on one chart, you've blown past two. Count the indicator slots your setup actually needs: Essential allows five and Plus ten in the checked comparison.
- Alert expiration is the sleeper reason to go Premium. On lower tiers, alerts expire and you have to recreate them. If you run standing levels for months — which is how HPT trades key structure — non-expiring alerts save real work.
- Seconds data and second-based charts (Premium+) matter for scalpers and anyone reading fast tape. If you trade the daily and swing, you don't need it.
- 16 charts in one layout (Ultimate) is a professional multi-monitor luxury. Most single-screen traders live comfortably on Plus or Premium.
HPT rule of thumb: buy the tier that removes the friction you actually hit, not the tier with the biggest number. Discipline over FOMO applies to subscriptions too.
Web vs. Desktop app
There are two ways to run TradingView on a computer:
- The web app (tradingview.com in a browser). Always the latest version, nothing to install.
- The Desktop app (a downloadable native app for Windows, Mac, Linux). Same charts, but with native multi-window support — you can pull charts onto separate monitors as real OS windows, which the browser can't do cleanly — plus faster keyboard handling and a cleaner full-screen. Serious traders run the Desktop app. HPT's own tooling drives the Desktop app specifically.
Mobile apps exist and are excellent for alerts and monitoring, but you don't do real analysis on a phone.
3. The Chart Interface, Zone by Zone
Open a chart and you're looking at five regions. Learn their names once and the rest of the platform makes sense.
The top toolbar
Running left to right across the top:
- Symbol search — the ticker box. Click it (or just start typing) to change the instrument.
- Timeframe / interval selector — 1m, 5m, 1H, D, etc. This is your resolution.
- Chart type — candles, bars, Heikin Ashi, and the rest (covered below).
- Indicators — the
fxbutton opens the indicator library. - Alert — the clock/bell to create an alert.
- Bar Replay — steps the chart forward bar by bar through history.
- Layout / template controls — save your chart layout, switch layouts, arrange multiple charts.
- Publish — share an idea to the community.
The left toolbar — drawing tools
The vertical strip down the left side is every drawing and markup tool: cursors, trend lines, Fibonacci tools, horizontal and vertical lines, channels, pitchforks, Gann, shapes, brushes, arrows, text, patterns, prediction/position tools, measure, an icon/emoji stamp, a magnet toggle, a lock-all toggle, a hide-all toggle, and a trash can. We break every one of these down in Section 7.
The right sidebar — panels
The vertical icons on the far right open side panels:
- Watchlist — your symbol lists and a details view of the selected symbol.
- Alerts — the manager for every alert you've set.
- Data / news / calendar — headlines and economic events for the symbol.
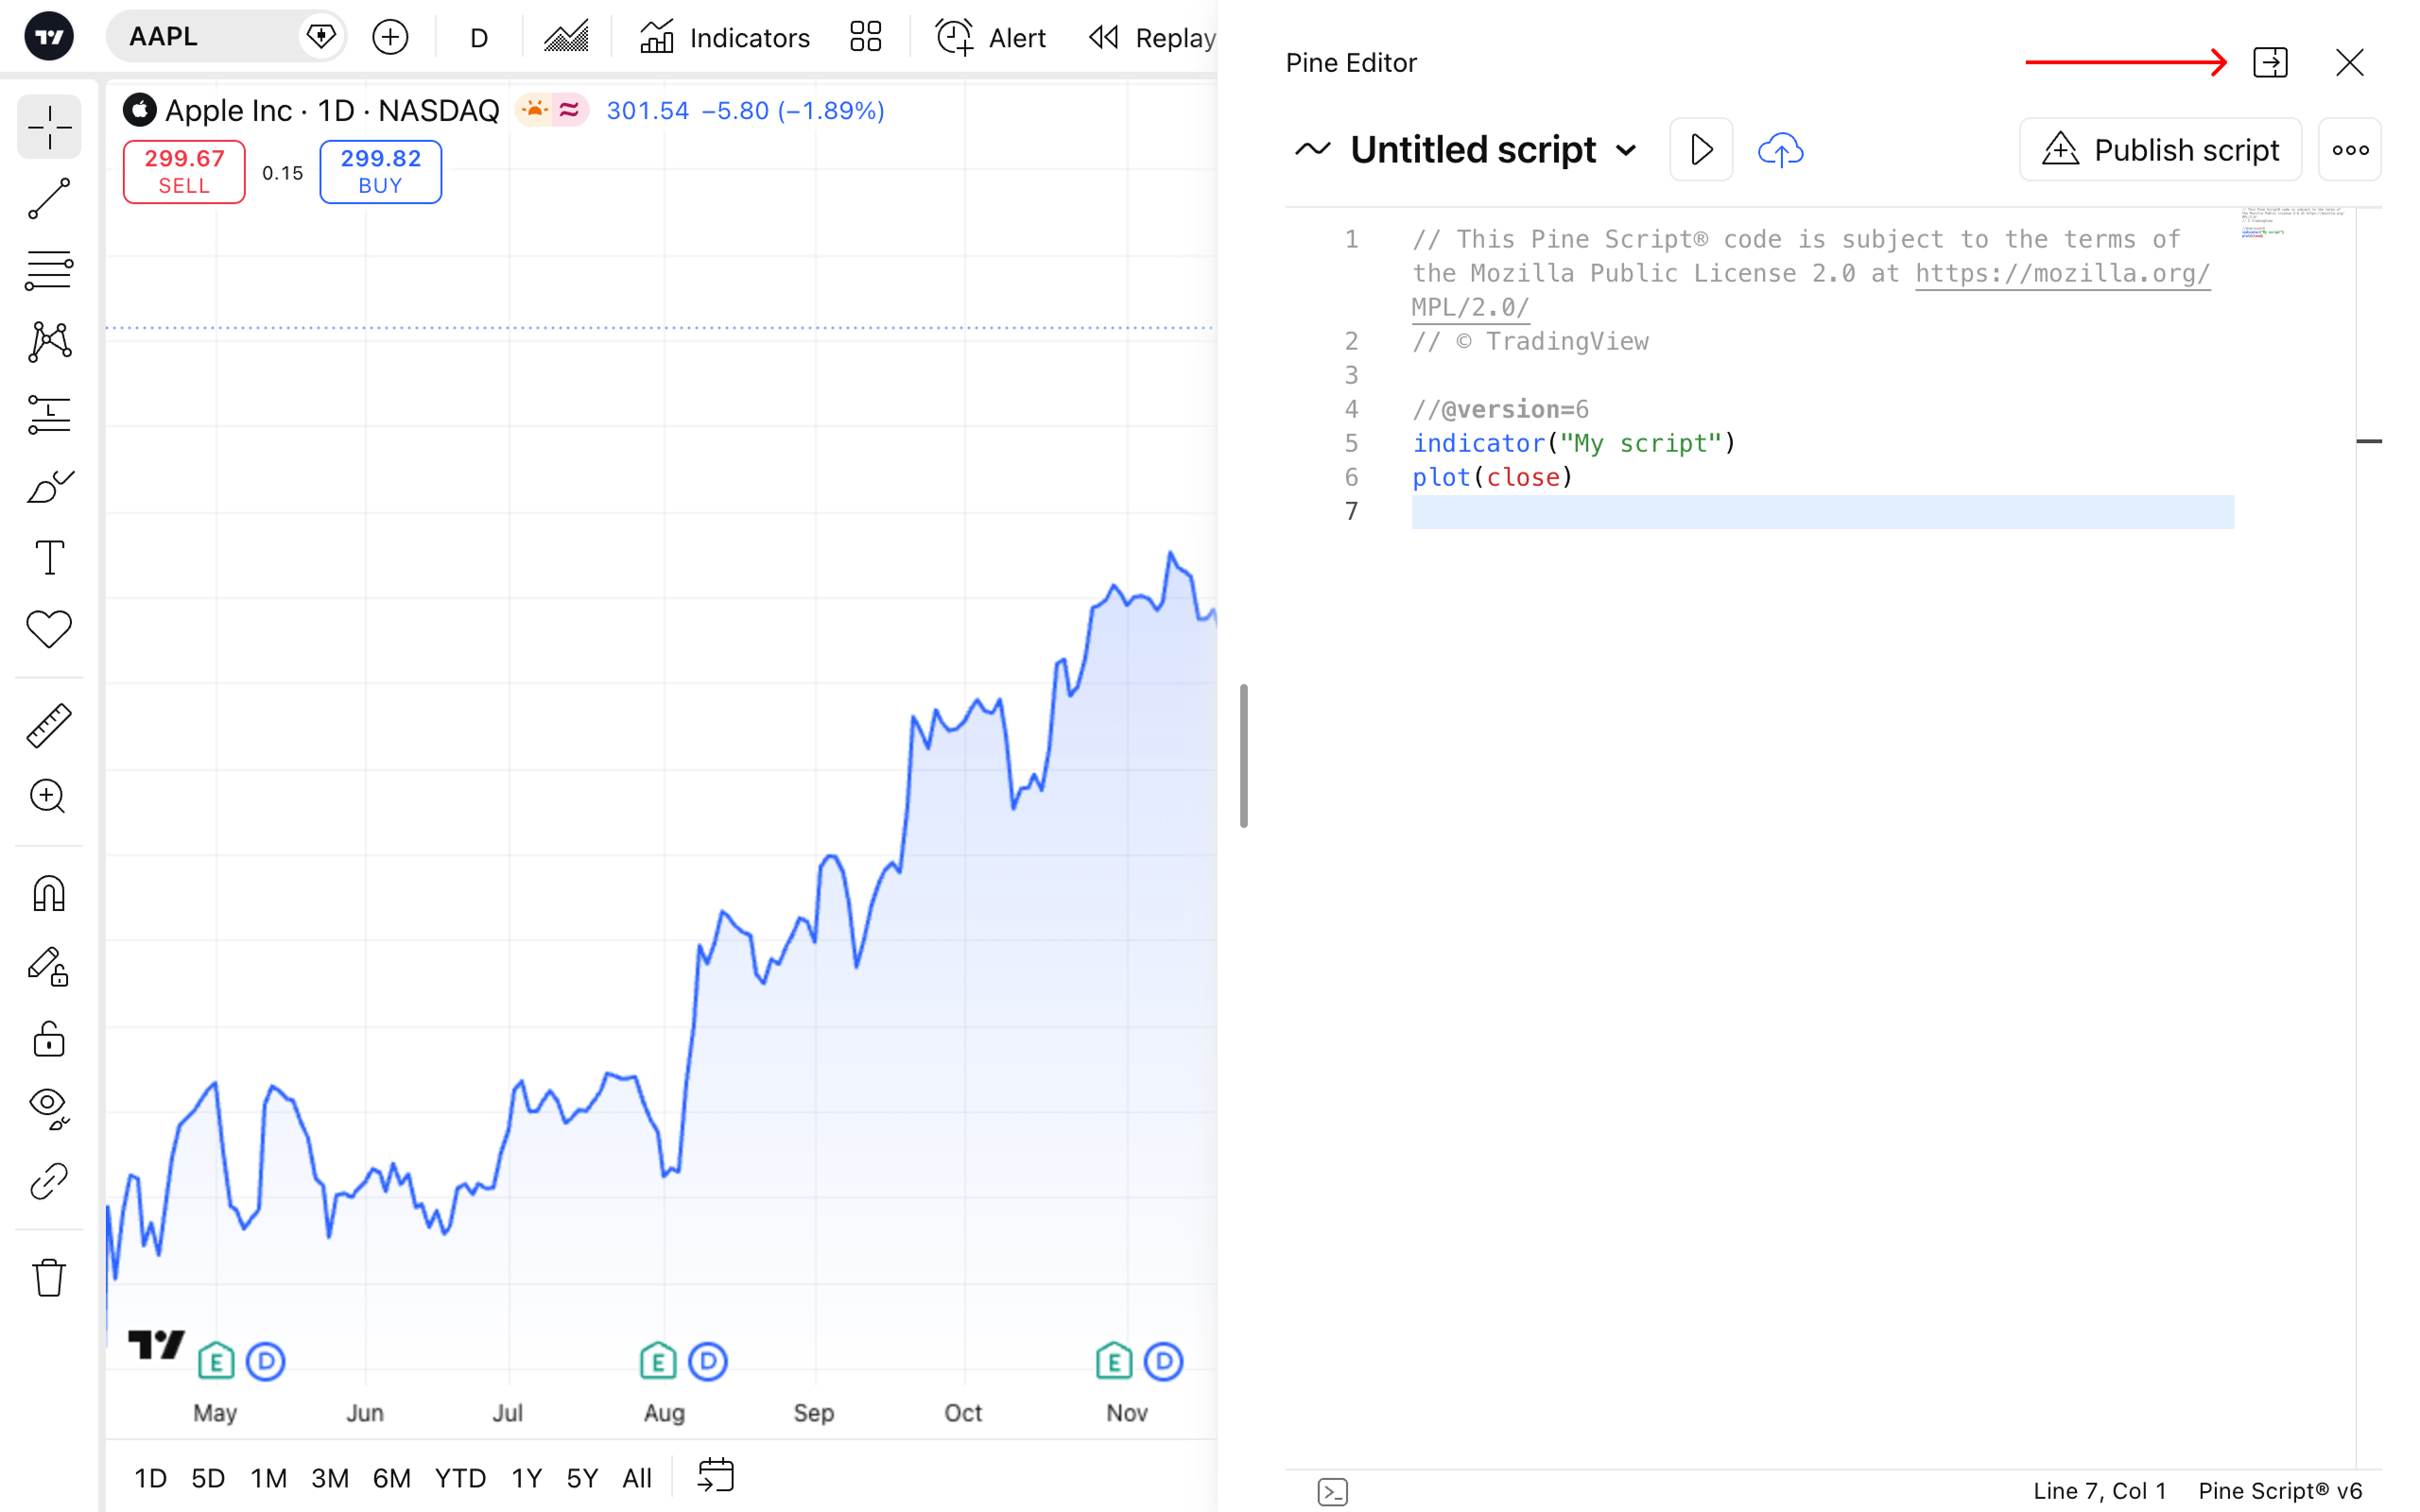
- Pine Editor opens from the Pine icon on the right toolbar. It can float, dock to the right or open separately. Strategy-report placement depends on the selected workspace.
- Chat / ideas / hotlists — community and market-mover streams.
The chart itself and the price/time scales
The center is the price action. The right edge is the price scale (drag it to compress or stretch vertically; double-click to auto-fit). The bottom is the time scale (drag to zoom horizontally; double-click to reset). Right-click either scale for options like logarithmic vs. regular scaling, which matters enormously on long-term charts — more on that later.
The bottom bar
The bottom of the chart contains date-range and time controls and may expose a trading or report panel. In the current interface, use the right-side Pine icon for Pine Editor and Screeners for screening tools. Panel placement varies with the workspace; follow the named controls rather than assuming a permanent bottom tab.
Learn these five zones and you can find anything.
4. Symbol Search and Symbology
Click the symbol box and type. TradingView's search is fuzzy and fast, but understanding its symbology — how it names instruments — makes you far more precise.
The full format is `EXCHANGE:TICKER`. NASDAQ:AAPL, NYSE:GME, CME_MINI:NQ1!, BINANCE:BTCUSDT, FX:EURUSD. The exchange prefix matters because the same ticker can exist on multiple venues with slightly different data and hours.
Some symbology worth knowing:
- Continuous futures use a
1!or2!suffix.NQ1!is the front-month continuous Nasdaq-100 future — the contract with the most volume, auto-rolled.NQ2!is the next one out. Specific contracts look likeNQZ2025. HPT tradesNQ1!for the continuous read. - Spreads and expressions — you can type math directly into the symbol box.
AAPL/SPYcharts Apple's relative strength against the S&P.ES1!-NQ1!charts the spread. This is a hidden superpower for intermarket work. - Economic data — CPI, unemployment, yields, and thousands of macro series are charted like any symbol (e.g.,
US10Yfor the 10-year yield). - Exchange badges matter for stocks — real-time vs. delayed depends on your data subscription for that exchange.
5. Chart Types — Every One, and When To Use It
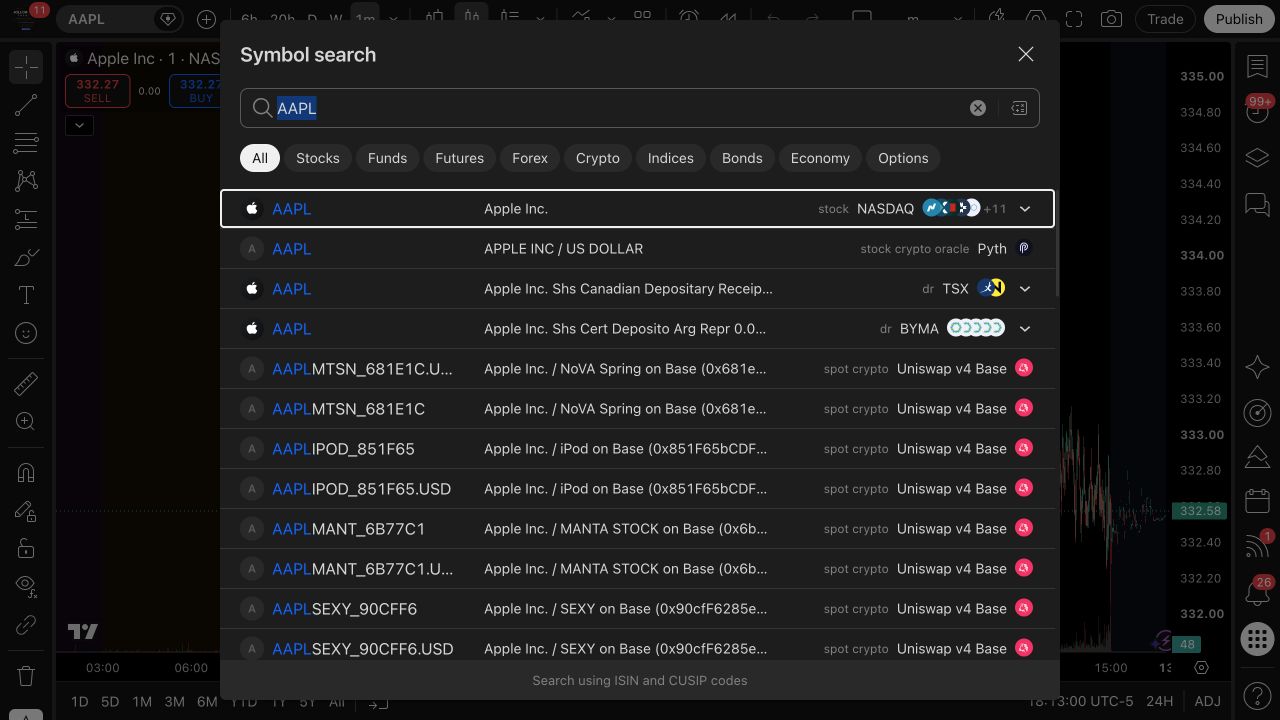
The chart type changes how the same price data is drawn. Same bars, different lens. Click the chart-type button in the top toolbar to switch. Here's the full menu with the honest use-case for each.
Time-based types (one plot per interval)
- Candlesticks — the default and the standard. Each candle shows open, high, low, close. Body is open-to-close (colored up or down), wicks are the highs and lows. This is what 95% of technical analysis assumes. Use it as your base.
- Hollow candles — the body is hollow when the current close is above the current open, and filled when below. Color compares the current close with the previous close. Body fill and color answer different questions: how this bar traded, and where it closed relative to the preceding bar.
- Bars (OHLC) — the same four data points drawn as a vertical bar with a left tick (open) and right tick (close). Cleaner in dense, zoomed-out views; preferred by some old-school tape readers.
- Line — connects closing prices only. Strips noise. Excellent for seeing the true trend structure and for long-term charts where wick noise is distracting.
- Area — a line chart with shaded fill. Same information, more visual.
- Baseline — draws price relative to a chosen level, coloring above and below differently. Great for "are we above or below my line" bias reads.
- HLC area / step line — niche variants for specific visual preferences.
- Columns / High-Low — bar-style variants used mostly for volume-like or range displays.
- Volume candles — candle width scales with volume, so high-participation bars visually pop. A quick way to see where the crowd actually showed up.
Heikin Ashi
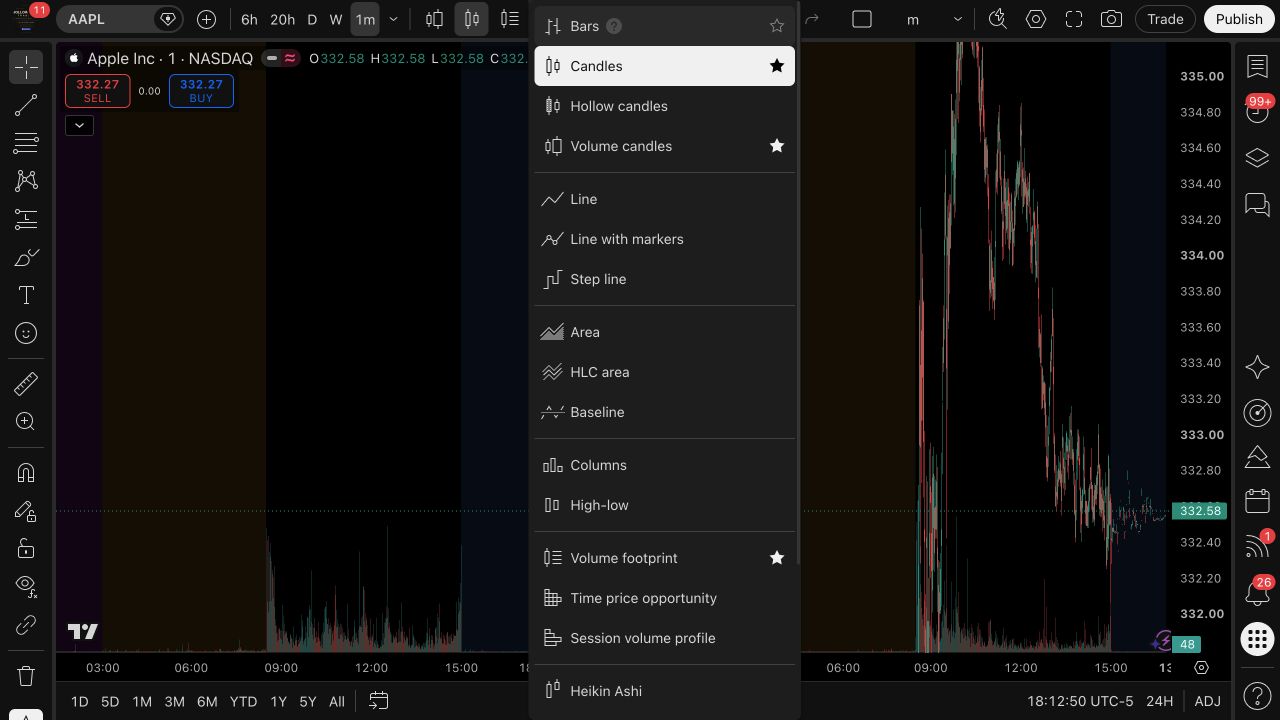
Heikin Ashi ("average bar" in Japanese) recalculates each candle using averaged open/close values, which smooths the series and makes trends look cleaner — long runs of same-color candles. It's excellent for staying in a trend and filtering chop.
The critical warning: Heikin Ashi prices are synthetic. The open, high, low, and close it displays are not the real traded prices. Never read entries, stops, or level prices off a Heikin Ashi chart — you'll set orders at prices that never existed. Use it as a trend filter on a secondary chart, and always confirm actual levels on standard candles. This is exactly the kind of thing that quietly wrecks a beginner's fills.
Non-time-based types (bricks/boxes on price movement, not clock time)
These plot new elements based on price movement, ignoring time entirely. A quiet hour produces nothing; a fast move produces many marks.
- Renko — bricks of a fixed price size (e.g., $1 or an ATR-based amount). A new brick prints only when price moves that amount. Pure trend/noise filter; ranges collapse to almost nothing. Great for seeing whether a move is "real" past a threshold.
- Line Break — draws lines based on closes exceeding prior lines by a set count. Similar noise-filtering intent.
- Kagi — a continuous line that thickens/thins and reverses on a set reversal amount. Old Japanese technique for supply/demand shifts.
- Point & Figure (P&F) — columns of Xs (up) and Os (down) based on box size and reversal amount. Zero time axis. Purists use it for clean horizontal count targets and breakout clarity.
- Range — bars that complete only after price moves a fixed range, regardless of time. Normalizes volatility.
How to use the non-time types: as confirmation and filter tools, not primary charts. When a standard candle chart looks messy, flipping to Renko or Range can answer "is this actually trending or just noise?" in one glance. But your levels, structure, and execution stay on candlesticks.
6. Timeframes and the Ladder
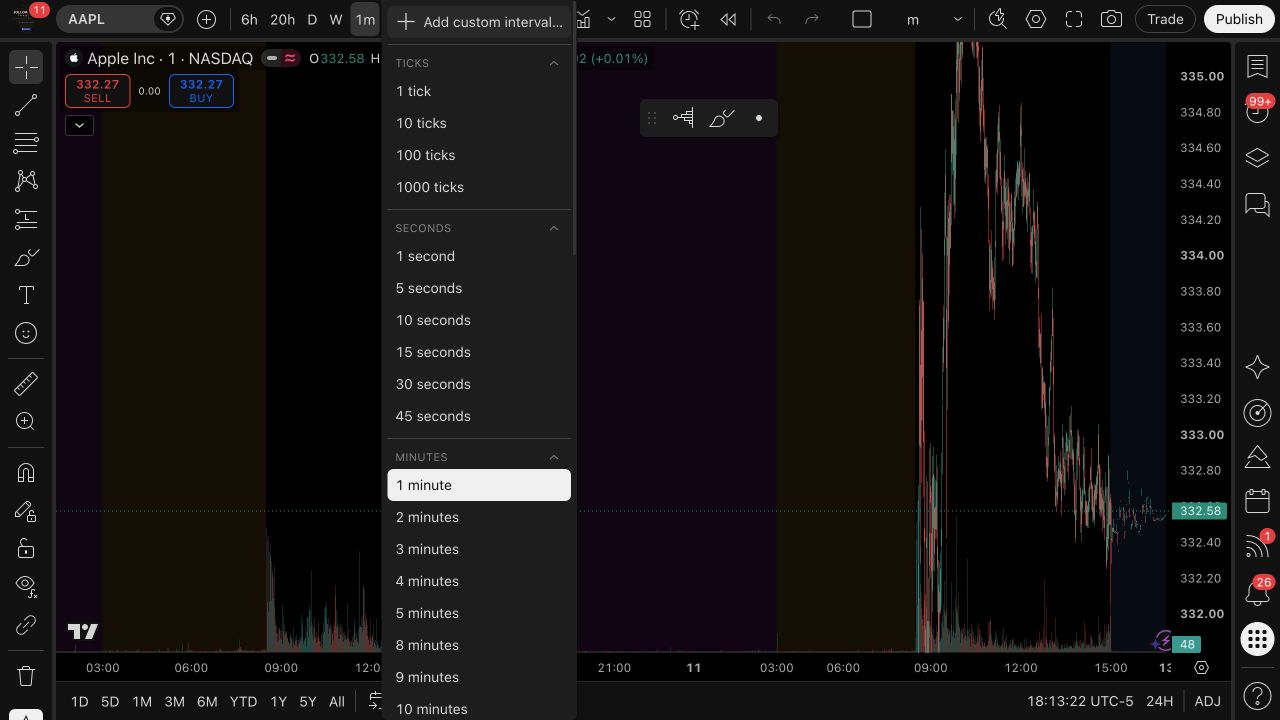
The timeframe (interval) sets how much time each bar represents. TradingView offers seconds (on higher plans), minutes (1, 2, 3, 5, 10, 15, 30, 45…), hours (1H, 2H, 3H, 4H…), and D/W/M/3M/6M/12M — plus custom intervals (type a number and unit into the interval box to get, say, a 8-hour or 100-tick chart).
The professional way to use timeframes is not to pick one — it's to run a top-down ladder, reading the same instrument from high timeframe to low so each read is nested inside the larger one.
HPT's standard ladder is:
1m · 2m · 3m · 5m · 10m · 15m · 30m · 1H · 2H · 4H · 1D · 1W · 1MO · 3MO
The daily and weekly set the bias. The 1H–4H set the structure and levels. The 1m–15m set the entry timing. A long scalp on the 5-minute that fights the daily trend is a low-quality trade; the same scalp with the daily is confluence. This nesting is the entire point of a top-down read, and TradingView's fast interval switching (just type "5" then Enter, or "1H") is built for running it quickly.
Favorite your intervals. Hover an interval in the dropdown and star it; your starred timeframes pin to the top toolbar for one-click switching. Set your ladder as favorites and you can walk it in seconds.
7. Drawing Tools — the Full Left Toolbar
This is where markup lives. Every tool is on the left vertical toolbar; each group is a fly-out with variants. Here's the complete rundown, grouped, with how each is actually used.
Cursors and the crosshair
The top group sets your pointer behavior: crosshair (default, with price/time readout), dot, arrow, and eraser. Small thing, but the crosshair's readout on the scales is how you read exact prices and times off the chart.
Trend lines and linear tools
- Trend Line — the workhorse; connect two points to draw a diagonal.
- Ray — a trend line that extends infinitely in one direction. Perfect for projecting a line forward.
- Extended Line — extends both directions.
- Horizontal Line / Horizontal Ray — your bread-and-butter support/resistance levels. HPT lives on horizontals — drawn key levels, prior day high/low, round numbers.
- Vertical Line — mark a time (session open, an event, a print).
- Cross Line — horizontal + vertical at once.
- Info Line — a trend line that displays price change, bars, and angle along it.
- Trend Angle — shows the angle of a line.
- Parallel Channel — two parallel trend lines defining a channel; drag the third point to set width.
- Regression Trend / Flat Channel / Disjoint Channel — statistical and manual channel variants.
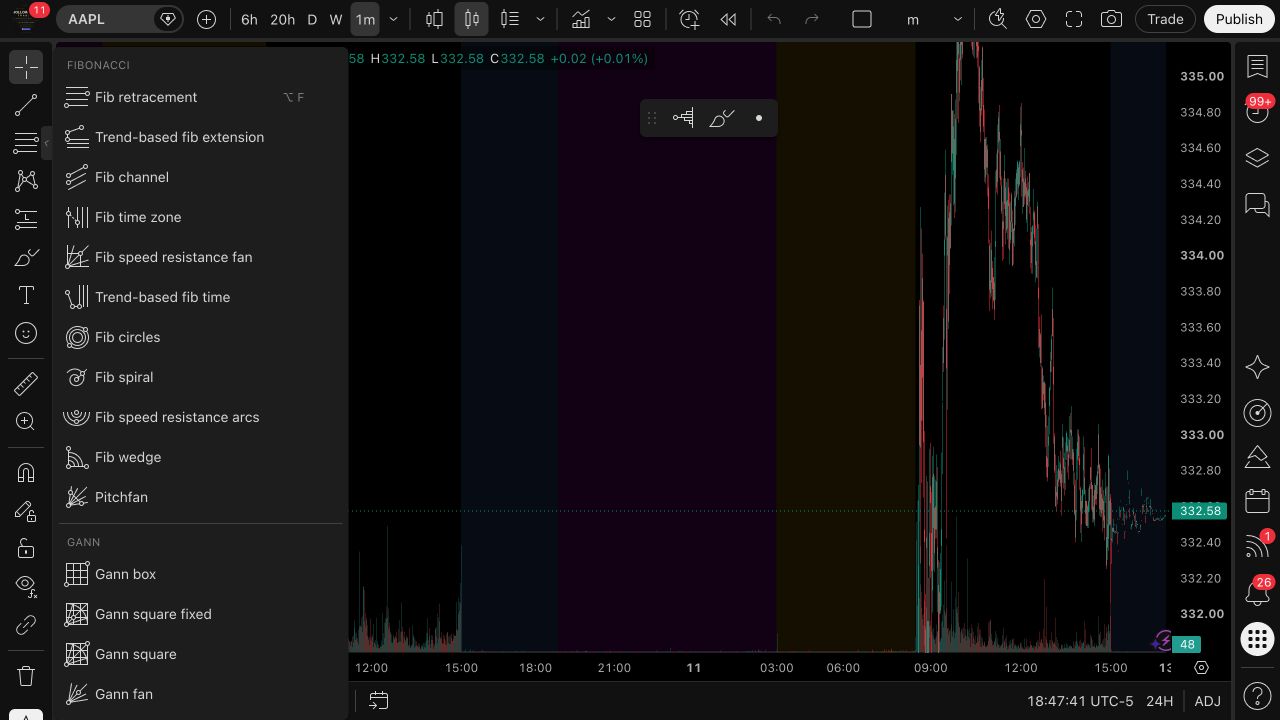
Fibonacci tools
The Fib group is deep and central to HPT confluence:
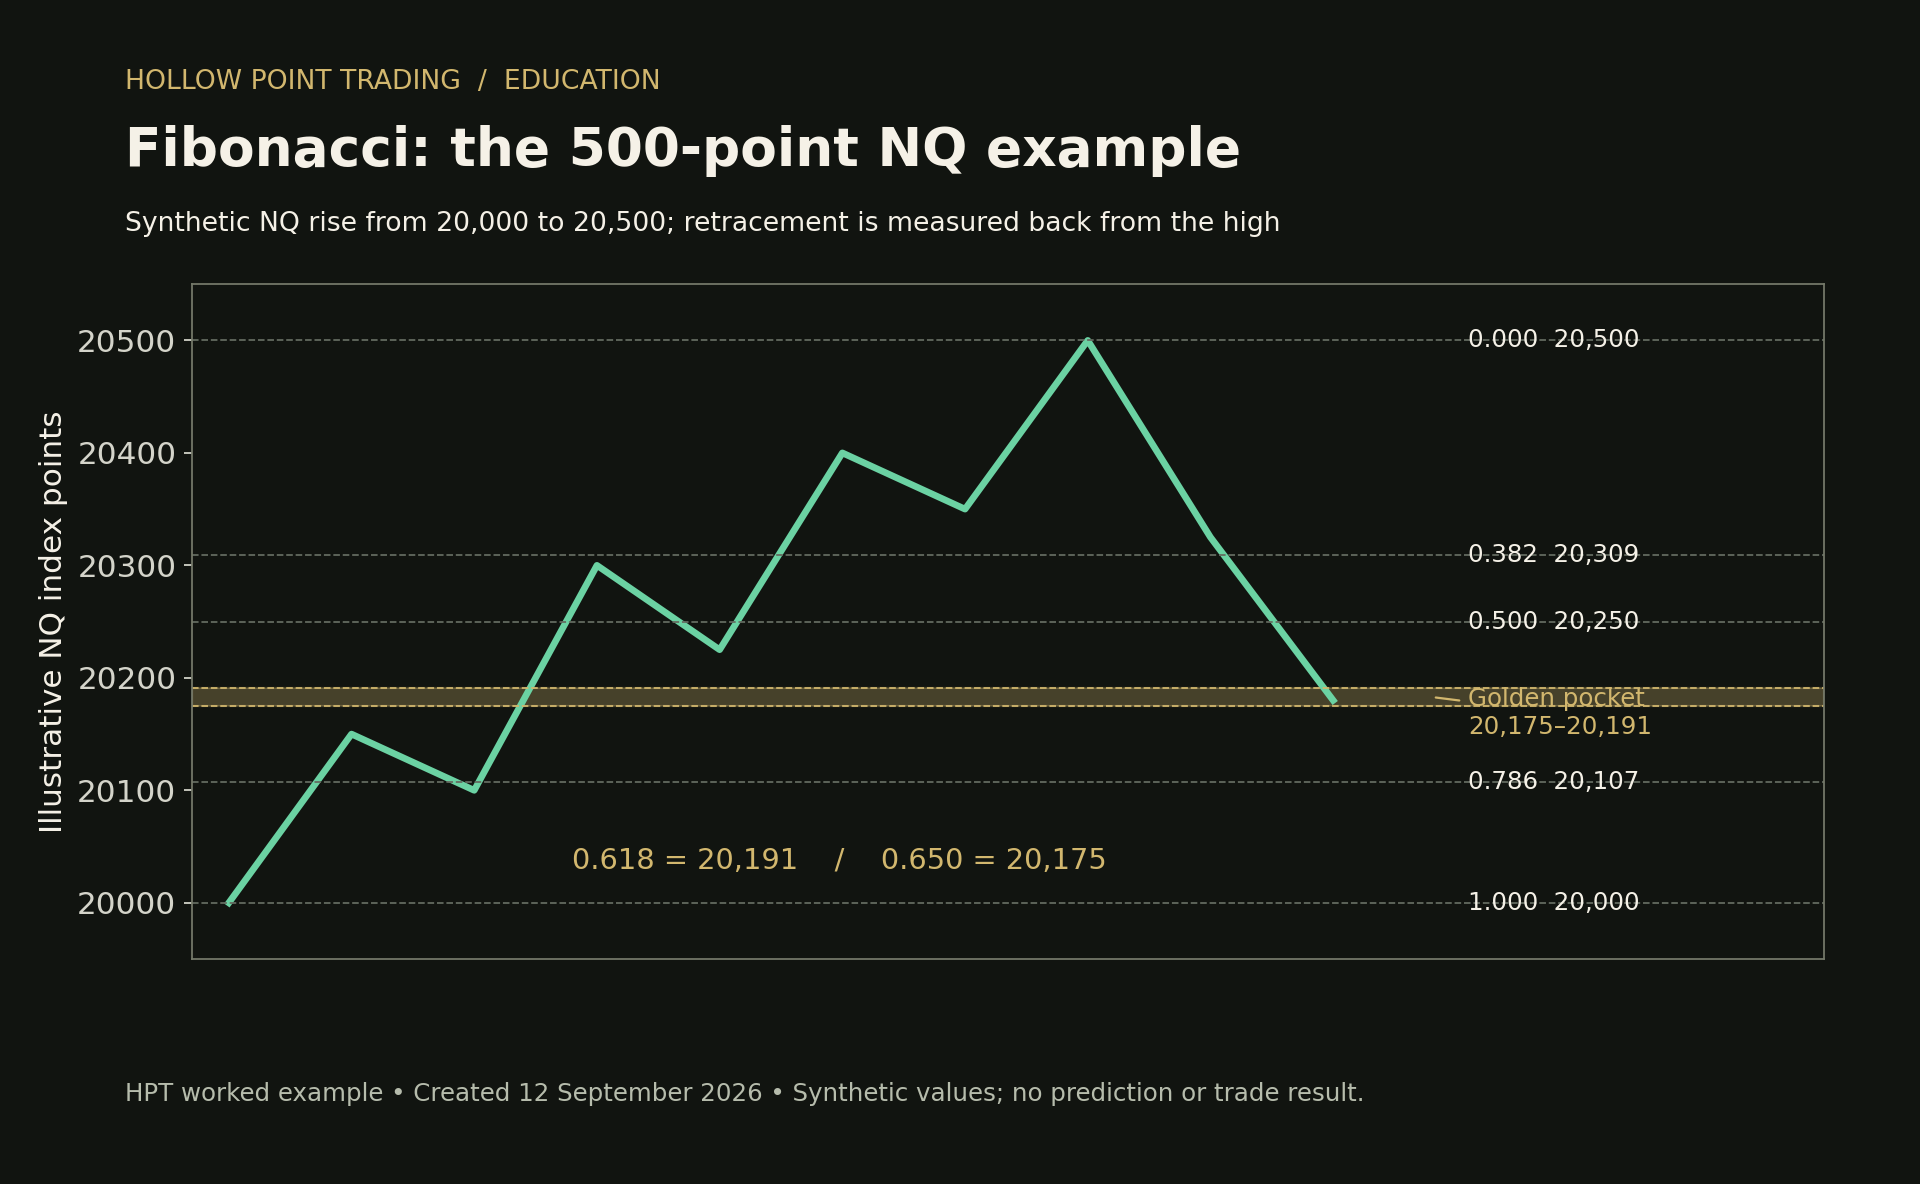
- Fib Retracement — the main one. Draw it across a leg (swing low to swing high, or vice versa) and it plots the retracement levels: 0.236, 0.382, 0.5, 0.618, 0.65, 0.786, 1.0. The golden pocket (0.618–0.65) is the high-probability reaction zone HPT watches for entries against a trend leg.
- Fib Extension / Trend-Based Fib Extension — projects targets beyond the leg (1.272, 1.414, 1.618, 2.0…). This is how you set profit targets that respect structure.
- Fib Channel — Fib levels drawn along a diagonal channel.
- Fib Time Zones / Fib Speed Resistance / Fib Circles / Fib Spiral — time- and geometry-based variants for advanced users.
- Gann Box / Gann Square / Gann Fan — W.D. Gann's geometric tools.
- Pitchfork (Andrews, Schiff, Modified Schiff, Inside) — median-line channels drawn from three pivots; excellent for dynamic support/resistance in trends.
Worked example — Fib retracement with numbers. Say NQ rallies from a swing low of 20,000 to a swing high of 20,500 — a 500-point leg. Draw the Fib retracement from 20,000 to 20,500. The levels print: 0.382 at 20,309, 0.5 at 20,250, 0.618 at 20,191, 0.65 at 20,175 (the golden pocket), 0.786 at 20,107. If price pulls back into 20,175–20,191 and you also see the rising 55-EMA there and a prior horizontal level, that's three-tool confluence — a far better long than a naked "it looks like it bounced."
Shapes, brushes, and annotation
- Brush / Highlighter — freehand drawing.
- Rectangle — the tool for order blocks, supply/demand zones, and FVGs (fair value gaps). Draw a box around the zone.
- Rotated Rectangle, Ellipse, Circle, Triangle, Arc, Curve, Polyline, Path — geometric shapes.
- Arrows (up/down markers), Text, Anchored Text, Note, Callout, Comment, Price Label, Price Note, Signpost, Flag — annotation tools for labeling bars and zones.
- Emoji / Sticker / Image — stamps.
Patterns
- XABCD, Cypher, Head and Shoulders, ABCD, Triangle, Three Drives, Elliott Wave (Impulse, Triangle, Triple/Double Combo), Cycles — semi-automatic pattern-drawing helpers that snap to your clicked pivots and label the pattern.
Prediction and measurement tools
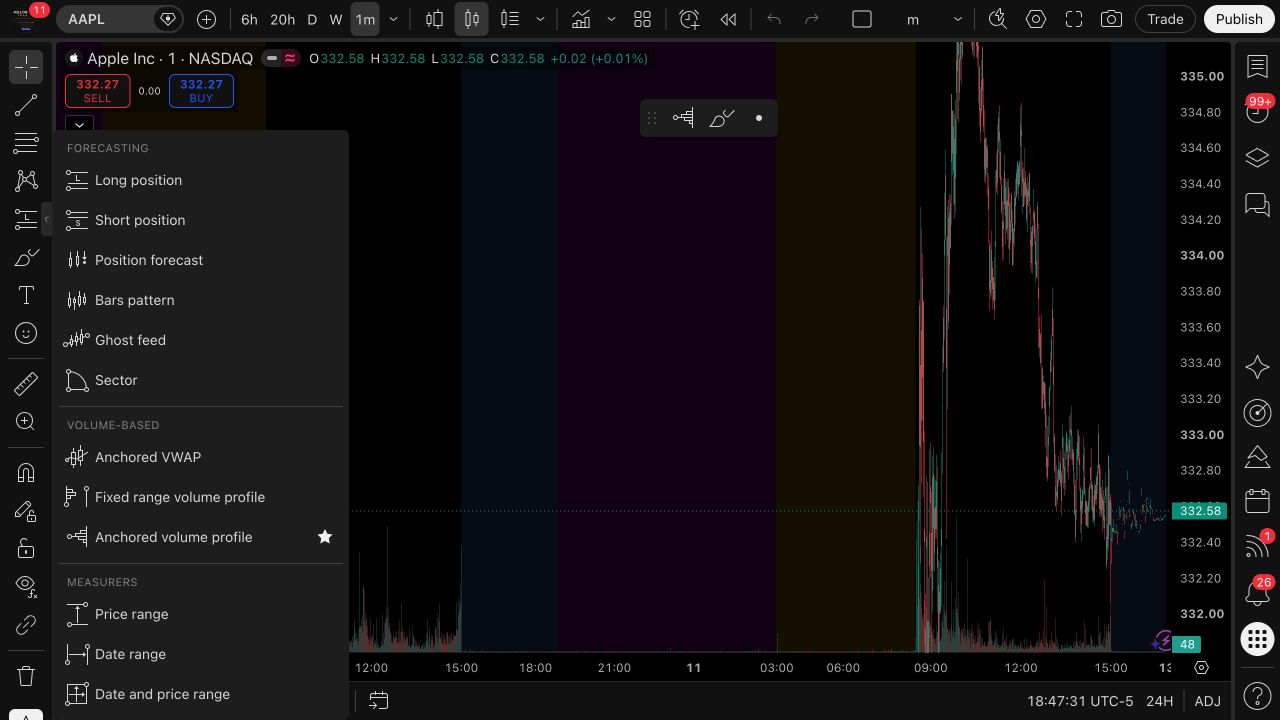
- Long Position / Short Position — the single most useful execution tool on the toolbar. You drag it to set entry, stop, and target, and it displays the exact risk/reward ratio, dollar risk, and reward in real time. This is how you enforce 1:3 R/R visually before you take the trade — if the box won't give you 1:3 with a stop beyond the structure that invalidates the trade, the trade doesn't qualify. HPT draws this on every setup.
- Forecast / Bars Pattern / Ghost Feed / Projection — draw a projected path.
- Price Range / Date Range / Date and Price Range — measure the move between two points in price, time, or both.
- Measure — the quickest one: click-drag (or press
Shiftand drag) to get price change %, price distance, bars, and time between two points. Muscle-memory tool.
The toolbar utilities at the bottom
- Magnet — snaps drawings to the nearest OHLC price. Turn it on for precise level-drawing; a weak magnet snaps loosely, a strong magnet snaps to exact OHLC.
- Stay in Drawing Mode — keeps a tool selected to draw many in a row.
- Lock All Drawings — prevents accidental moves.
- Hide All Drawings — clean the chart to look at raw price.
- Sync drawings — mirror a drawing across all your charts/timeframes.
- Remove Objects / trash — clear drawings, indicators, or both.
Managing drawings: right-click any drawing for its settings (color, thickness, style, text, coordinates, and whether to show it on all timeframes or just this one). You can create drawing templates — save a styled tool (e.g., your exact Fib settings and colors) and reapply it in one click. Set your Fib and level styles once, save as a template, and never re-style again.
8. Indicators — Adding, Configuring, and Building a Stack
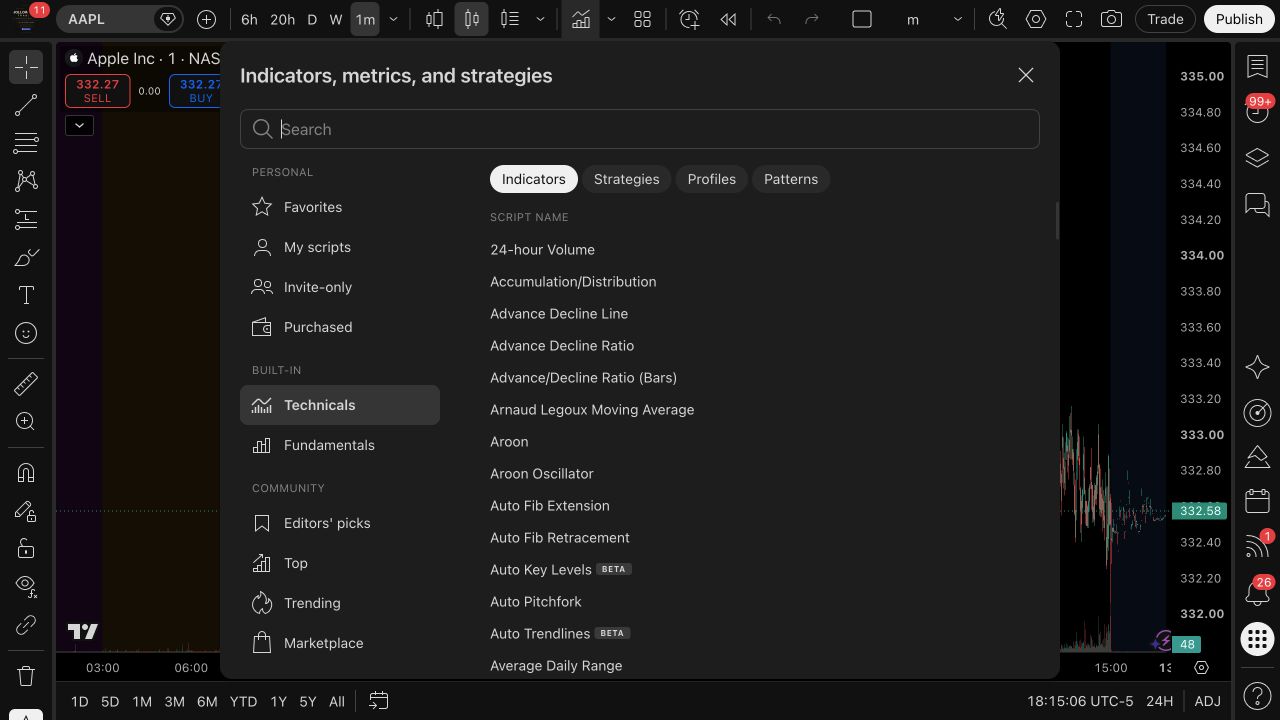
Click the `fx` Indicators button (top toolbar) to open the indicator library. It has several sources:
- Technicals — TradingView's built-in studies: moving averages, RSI, MACD, Bollinger Bands, VWAP, Volume Profile, Ichimoku, ATR, Stochastics, and hundreds more.
- Financials — fundamental data plotted on the chart (revenue, EPS, margins) for stocks.
- Community Scripts — the massive library of user-published Pine Script indicators. Search, click, add.
- My Scripts — your own saved Pine indicators (like the HPT Arsenal).
- Invite-only Scripts — private/paid scripts you've been granted access to.
If you are an HPT member, use the [official HPT indicator setup guide](/indicators) before opening an old script link. It covers the exact TradingView username request, the private Discord access route, per-publication approval, installation, troubleshooting, and a downloadable PDF.
Adding and configuring
Click an indicator to add it. It lands either on the price pane (overlays like moving averages, VWAP, Bollinger Bands) or in a separate pane below (oscillators like RSI, MACD). Hover the indicator's name on the chart for the quick controls: eye (hide/show), settings gear, more (…), and delete.
Open Settings and you get two tabs that matter:
- Inputs — the parameters: length, source (close/open/hl2…), and any options the script exposes. This is where you set an EMA to length 55, or an RSI to 14.
- Style — colors, line thickness, which plots are visible, and where the indicator's scale sits.
The HPT EMA framework — a worked stack
HPT does not run the textbook 9/21 EMAs. The framework is EMA 12 / 22 / 55 for trend, with the daily 55-EMA as the primary bias tell. To build it: add three Exponential Moving Average studies, set their lengths to 12, 22, and 55, and color them distinctly (fast to slow — e.g., light, medium, heavy).
How to read the stack:
- Stacked bullish (12 above 22 above 55, all rising) = trend up; you want longs.
- Stacked bearish (12 below 22 below 55, all falling) = trend down; you want shorts.
- Tangled = no trend; stand aside or scalp only with tight discipline.
- The "505 rejection" in HPT shorthand is a rejection off the 55-EMA — price tags the 55, gets rejected, and continues the prior trend. The daily 55 is the line that tells you which side of the market you're allowed to be on.
Layer the standard supporting studies HPT reads on every chart: VWAP and anchored VWAP, Volume, RSI (level, zone, divergence), MACD (line vs. signal, histogram, crosses), and Anchored Volume Profile (POC, value area high/low). Each is one indicator; note the per-chart indicator cap on your plan and prioritize.
Favorites and templates — the speed multiplier
Two features turn indicator setup from minutes into one click:
- Favorite indicators — star an indicator in the library and it appears in a favorites bar for instant adding.
- Indicator Templates — configure your entire stack once (EMAs, VWAP, RSI, MACD, volume, all styled), then save it as an indicator template with a name. Apply it to any chart in one click and the whole stack drops on, pre-styled. Build your HPT template once; never rebuild it. This is the discipline of a repeatable process baked into the tool.
Common indicator mistakes: stacking six oscillators that all say the same thing (RSI, Stoch, CCI, Williams %R are largely redundant — pick one); reading indicators instead of price instead of alongside it; and forgetting that indicators lag — they describe what price already did. HPT weights price structure first, indicators as confluence, never the reverse.
9. Alerts — Price and Indicator
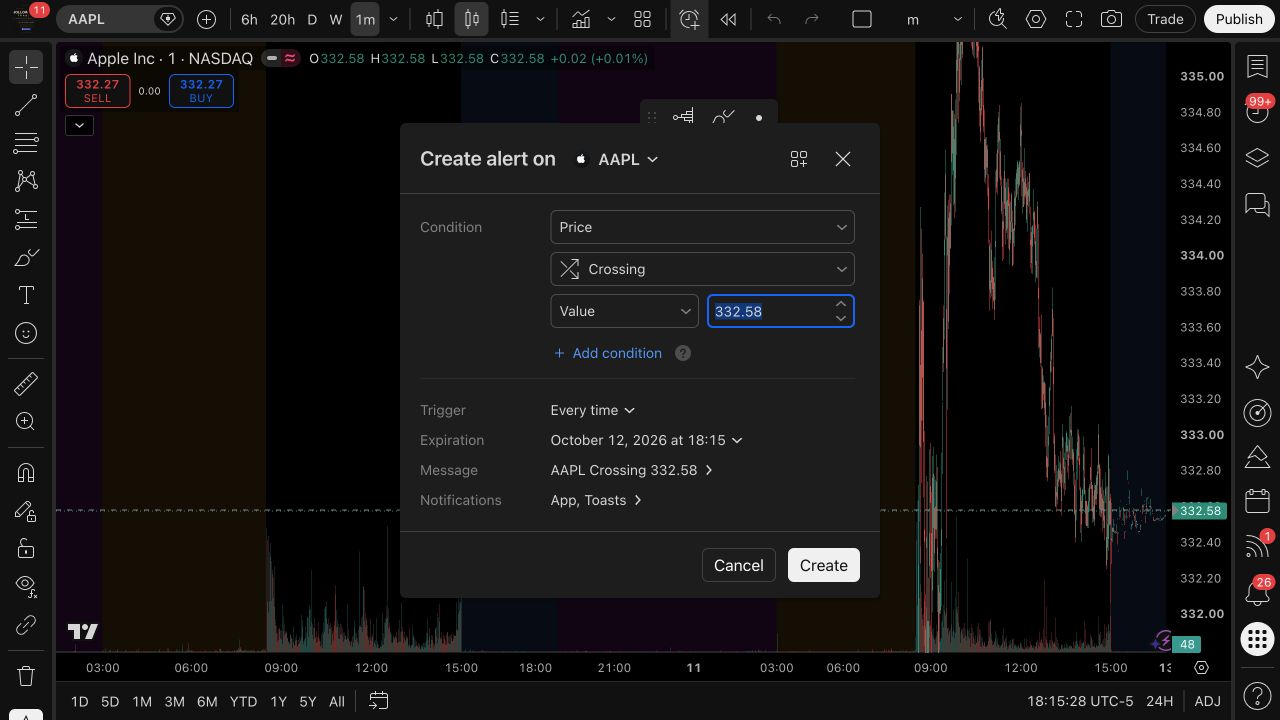
Alerts are how you stop babysitting the screen. TradingView's alert engine runs server-side — it fires even when your computer is off, supporting app notifications, email, pop-ups, sound and webhooks as available in the alert dialog.
Creating a price alert
The fastest way: right-click a price level on the chart → Add Alert, or drag a horizontal line and click the alert bell that appears on hover, or press the Alt/Option-A shortcut. Set the condition (Crossing, Crossing Up, Crossing Down, Greater Than, Less Than, Entering/Exiting Channel, Inside/Outside), the trigger frequency, expiration, and how you want to be notified.
Trigger frequency — read this carefully
- Only Once — fires one time, then the alert stops.
- Once Per Bar — fires at most once per bar, the first time the condition is true on that bar.
- Once Per Bar Close — fires only when a bar closes meeting the condition. This filters intrabar crossings; it does not prevent a later failed breakout. A wick can spike through a level intraday and pull back; "Once Per Bar Close" waits for confirmation.
- Once Per Minute — throttled continuous.
For level breaks, HPT-style discipline favors Once Per Bar Close — you want the close through the level, not a tick that tags it and reverses. This is the tape-reading version of "discipline over broken signals."
Indicator (technical) alerts
Beyond price, you can alert on any indicator condition — RSI crossing 70, MACD crossing its signal line, price crossing a moving average, an EMA crossing another EMA, or a custom Pine Script `alertcondition()`. In the alert dialog, set the first condition to the indicator (instead of the symbol's price) and the available conditions populate from that indicator's outputs. This is how you get "alert me when the 12-EMA crosses the 55-EMA on the 1H" without watching it.
Technical alerts generally require a paid plan; the free tier is limited to a handful of expiring price alerts.
Expiration and management
Lower plans expire alerts (they need recreating); Premium and up make alerts non-expiring — set a standing level once and it watches for months. The Alerts panel (right sidebar) lists everything, lets you pause, edit, clone, or delete, and shows the alert log of what fired and when.
Webhooks — the automation door
On higher plans, an alert can POST a webhook to a URL when it fires. This is the bridge to automated systems — you can route an alert to a bot, a Discord channel, a spreadsheet, or an execution engine. It's how a signal on the chart becomes an action somewhere else without you touching it.
10. Watchlists and the Screener
Watchlists
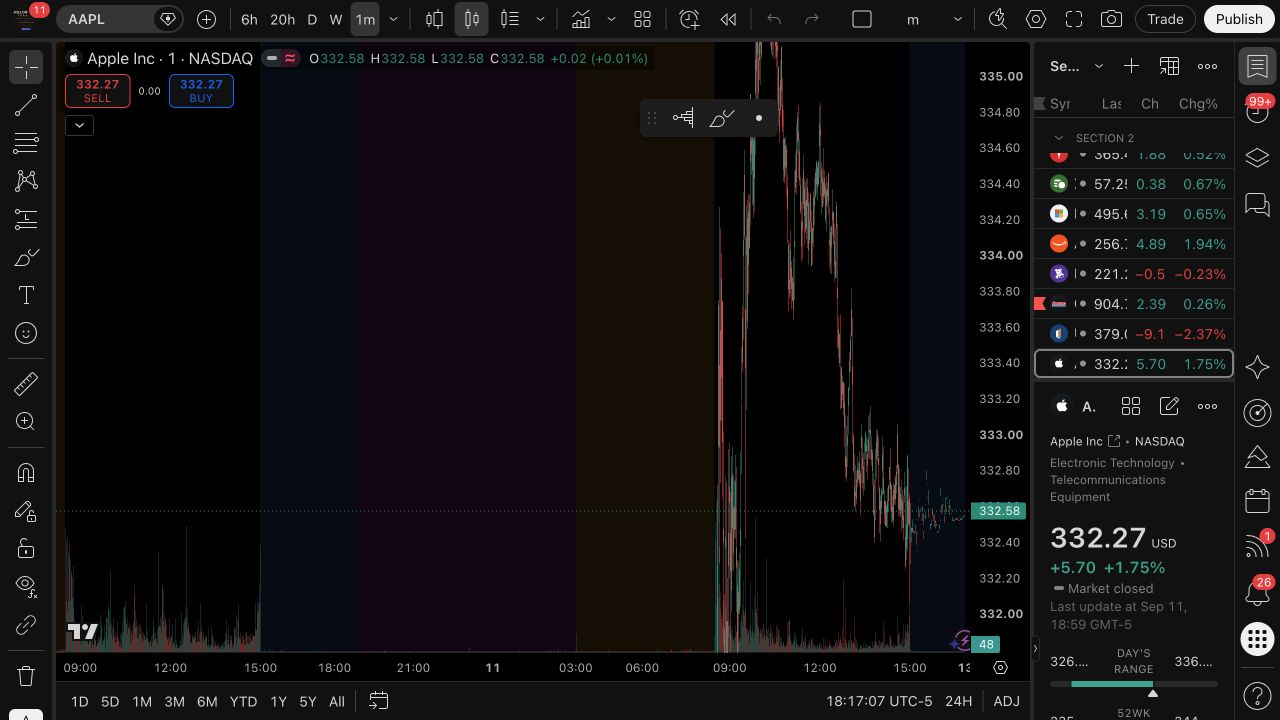
The Watchlist panel (right sidebar) is your list of tracked symbols with live quotes, change %, and mini columns you can customize. Features:
- Multiple lists — create separate lists (e.g., "NQ complex," "Sector leaders," "Longs," "Shorts") and switch between them.
- Sections — add divider headers inside a list to group symbols (Indices / Tech / Energy).
- Flagging and color-coding — flag symbols with colored dots to sort by priority or theme. HPT uses colored flags to separate longs, shorts, and watch-only.
- The detail view — click a symbol and the panel shows a summary, key stats, and a mini-chart without changing your main chart.
- Watchlist alerts (higher plans) — set one alert across an entire watchlist rather than symbol-by-symbol.
- Icons/imports — you can import a list from a text file of tickers.
Watchlists feed the top-down read: your macro list (indices, VIX, DXY, yields) tells you the environment; your sector list tells you where the strength is; your stock list is where you actually hunt. Macro → sector → stock, mirrored in three watchlists.
The Screener
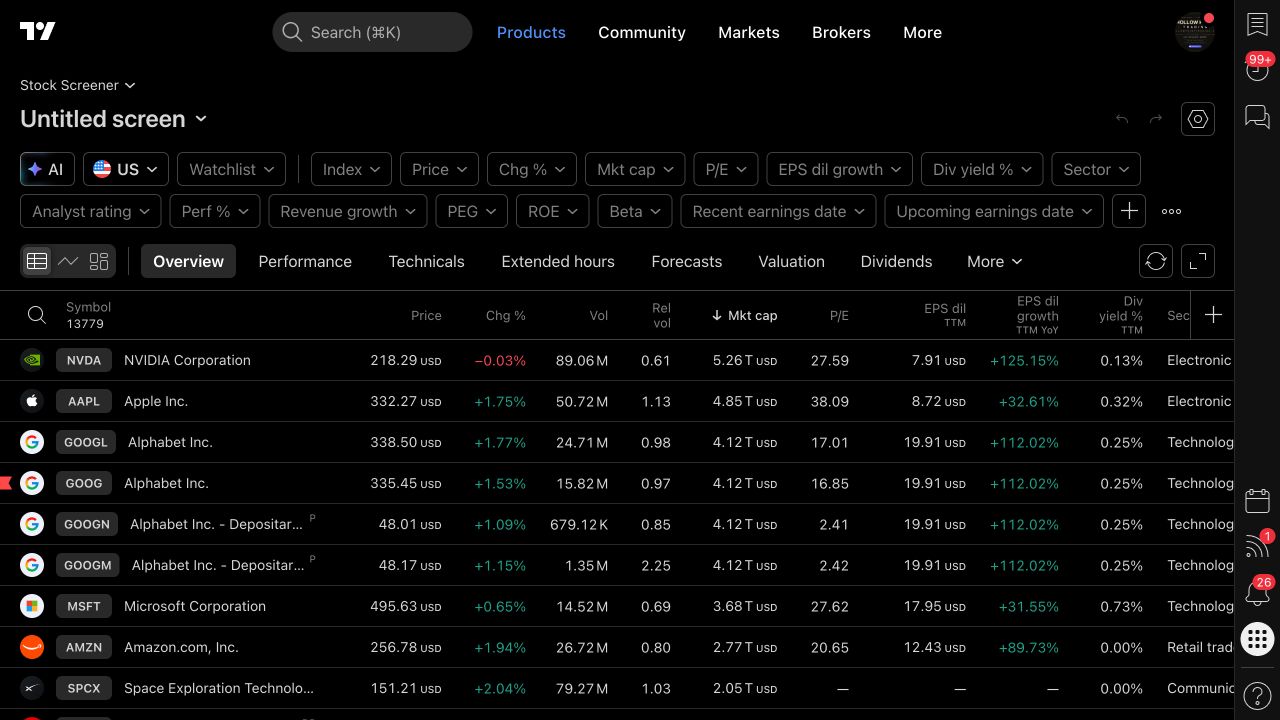
The Screener (right-side Screeners control, or the standalone screener page) filters the entire universe of a market by your criteria. There are separate screeners for stocks, crypto, forex, and more, plus a dedicated options view.
How it works:
- Pick the market and the base universe (e.g., all U.S. common stocks).
- Add filters — price, market cap, volume, % change, average volume, sector, plus dozens of technical filters: RSI value, price vs. moving averages, gap %, distance from 52-week high, pattern matches, and more.
- Build custom columns — display the exact fields you screen on so you can eyeball the results.
- Sort and save — save the filter set as a screen you can rerun daily, and export results.
Worked screen — a momentum-with-trend scan (HPT-flavored): relative volume > 2, price above the 55-EMA (trend filter), price within 3% of a breakout level, market cap > $2B (liquidity), and % change > 0. That returns a short list of liquid names moving with trend on real participation — a candidate list, not a signal. You still take each one top-down and demand confluence and 1:3 R/R before it's a trade.
The screener is the funnel: it turns thousands of symbols into a handful worth a real read. It replaces scrolling.
11. Bar Replay — Practice and Study
Bar Replay (the top toolbar button, often a rewind icon) lets you rewind any chart to a past date and step bar by bar forward, with the future hidden. It is the single best free practice tool on the platform, and it's underused.
How to use it:
- Click Bar Replay, then click a point in history to set the start. Everything after that point is hidden.
- Use play/pause and step controls to advance one bar at a time (or auto-play at a chosen speed).
- Your drawings and indicators work in replay, so you can practice reading structure in real time without knowing the outcome.
- On higher plans, replay works on intraday timeframes with deeper history; lower plans are more limited.
Uses:
- Backtesting a setup by hand. Rewind to a random date, apply your rules, and step forward to see if the setup you'd have taken worked. Log it. This builds the pattern library that HPT calls the evidence base.
- Studying a specific event — replay an earnings gap, a Fed day, a flush, and watch how structure actually resolved.
- Practicing execution timing — use Replay Trading for historical simulation. Ordinary Paper Trading and broker orders use real-time data even while a chart is in Bar Replay.
Where available, Replay Trading lets you practice on historical bars. It is a separate simulation from Paper Trading. Check the symbol, supported chart type and your plan’s replay history before starting; some feeds and chart types cannot be replayed.

12. Multi-Chart Layouts and Linking
A layout is a saved arrangement of one or more charts, their indicators, drawings, and settings — saved to your account by name. The layout controls are in the top-right toolbar.
Multiple charts in one tab
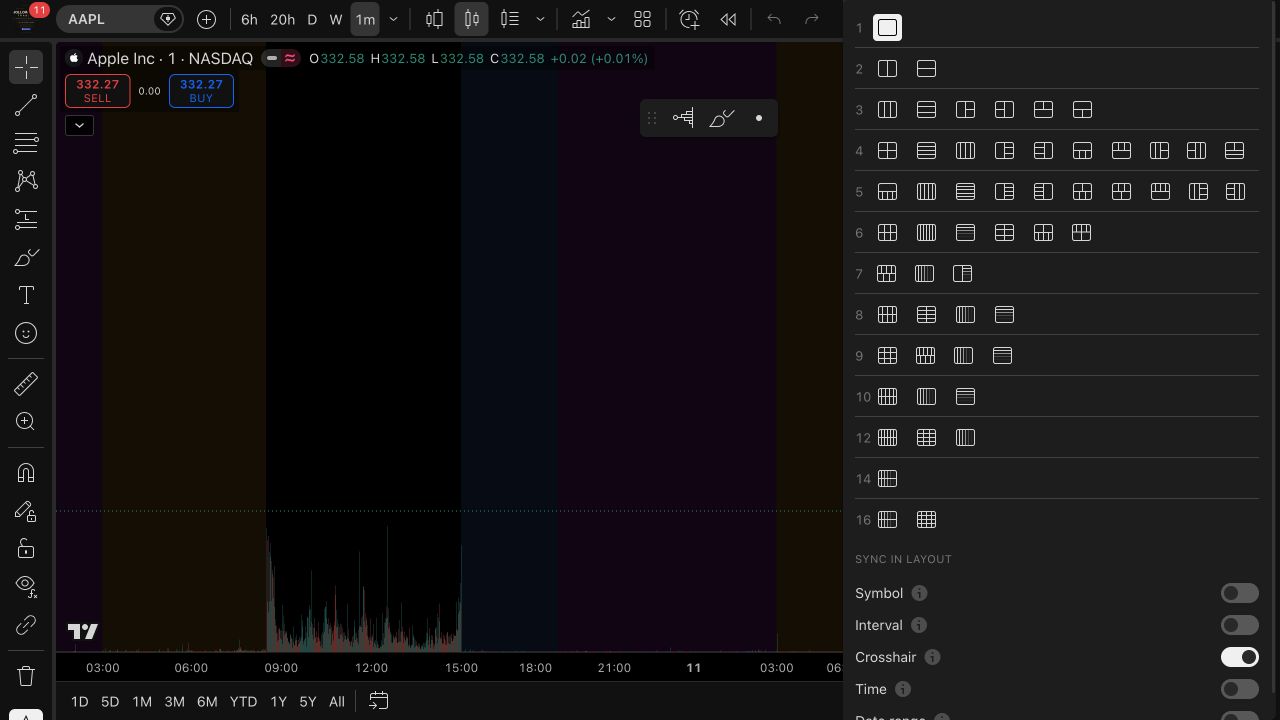
Paid plans let you tile 2, 4, 8, or 16 charts in a single layout (plan-dependent). Pick a grid from the layout selector. Each chart pane can hold a different symbol and timeframe.
The power feature is synchronization. Open the layout selector and use Sync in layout for symbol, interval, crosshair, time and date-range behavior:
- Symbol link — change the ticker in one pane and all linked panes follow. Set four panes to the same symbol but different timeframes (say 5m, 15m, 1H, Daily), link the symbol, and now typing one ticker loads your entire top-down ladder at once. This is the multi-chart version of the HPT ladder.
- Interval link — synchronize timeframes across panes.
- Crosshair sync — hover one chart and the crosshair mirrors across all panes at the same time, so you can read the same moment across timeframes.
- Date-range sync — scroll one, they all scroll together.
Save this arrangement as a layout ("HPT Top-Down") and reload the whole cockpit — symbols, timeframes, indicators, drawings, links — in one click. On the Desktop app, you can additionally pop charts into separate OS windows across multiple monitors.
13. Hotkeys and the Fast Workflow
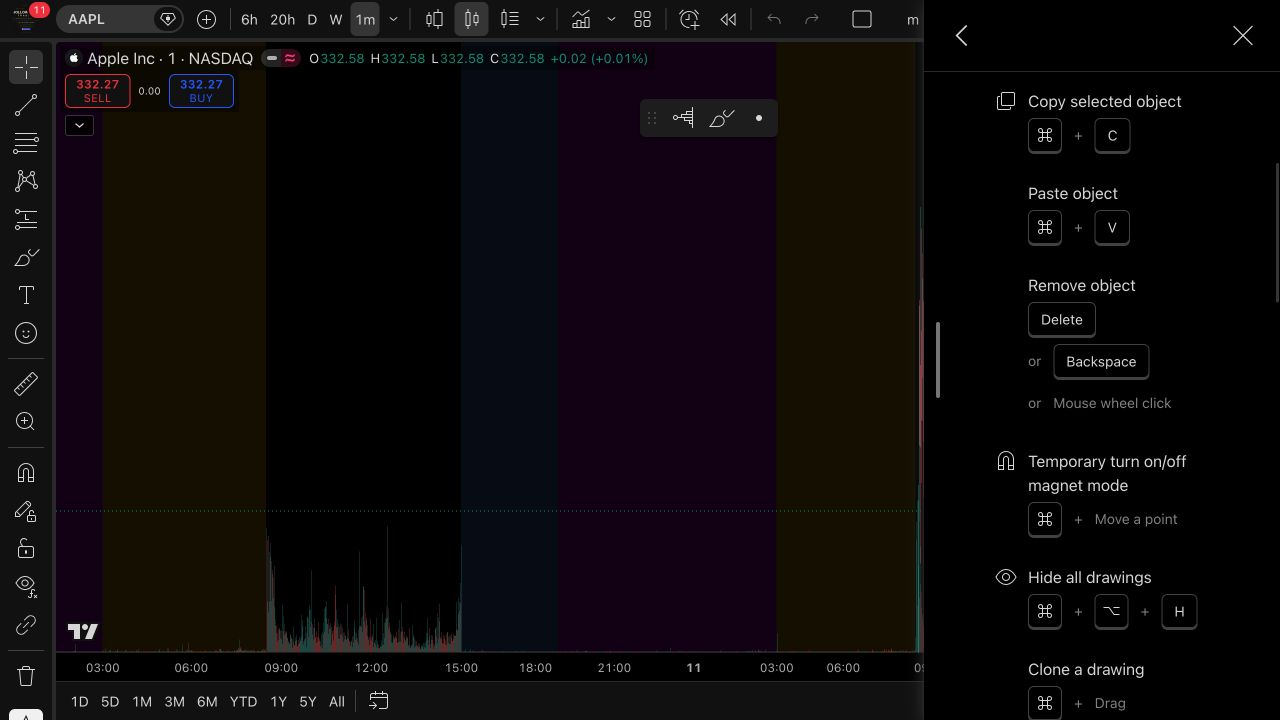
Speed is discipline made physical. The traders who look effortless are just running keyboard-first. Here are the ones that matter (Mac uses ⌘ where Windows uses Ctrl; open the current shortcut reference with Ctrl+/ on Windows or Command+/ on macOS):
Navigation and symbol:
- Type any letters → jumps into symbol search (just start typing a ticker).
- Type a number/letter for interval → e.g.,
5+ Enter = 5-minute,1H+ Enter = hourly,D= daily. ←/→— scroll the chart through time;↑/↓or scroll wheel — zoom.Alt/Option + →— scroll to the most recent bar (jump to now).
Drawing:
Alt/Option + T— trend line.Alt/Option + H— horizontal line.Alt/Option + V— vertical line.Alt/Option + F— Fib retracement.Alt/Option + I— invert the chart (flip vertically — a genius bias-check: does the setup still look good upside down?).Ctrl/⌘ + Z/Ctrl/⌘ + Y— undo / redo.- Hold
Shiftand drag — quick Measure. Esc— deselect / cancel the current tool.
Alerts and objects:
Alt/Option + A— create alert at cursor.Ctrl/⌘ + clicka drawing — multi-select.- Select a drawing +
Delete— remove it.
Chart management:
Ctrl/⌘ + S— save layout.- Use Bar Replay’s visible step-forward control. Check the current shortcut reference for replay bindings; do not assume a step-back shortcut exists.
The fast workflow, assembled: you keep both hands on the keyboard and mouse. Type the ticker (no clicking the box). Tap through your favorited intervals to walk the ladder. Apply your indicator template (one click or a hotkey you assign). Drop horizontals with Alt-H, a Fib with Alt-F. Draw the Long/Short position tool to check 1:3 R/R. Set the alert with Alt-A. Save with ⌘-S. A full top-down read and armed alert set in under two minutes, every time, the same way. Repeatable process is the whole game — hotkeys are how you make the process fast enough to run on every name without cutting corners.
14. Pine Script at a Glance
Pine Script is TradingView's own programming language for building custom indicators, strategies, and alerts. You don't need to code to use TradingView — but a little Pine turns you from a consumer of indicators into a builder of exactly what you want. (HPT's entire Arsenal — tape readers, level tools, EMA frameworks — is Pine.)
Where it lives
Open Pine from the right toolbar. The editor can float, dock on the right, or open separately. Write or paste your script, save it and add it to the chart. Saving source and adding an indicator to the chart are separate actions.
The shape of a script
Every modern script starts with a version declaration and a type declaration:
//@version=6
indicator("My 55 EMA Bias", overlay=true)
len = input.int(55, "Length")
ema55 = ta.ema(close, len)
plot(ema55, "EMA 55", color=color.orange, linewidth=2)
bias = close > ema55 ? "LONG" : "SHORT"
The pieces you'll meet constantly:
- `indicator()` vs. `strategy()` —
indicatorplots studies;strategycan simulate trades and run through the Strategy Tester for backtest stats (net profit, win rate, drawdown, profit factor). - `input.`** — exposes settings to the Inputs tab (lengths, sources, toggles), so users configure without editing code.
- `ta.
** — the built-in technical-analysis library:ta.ema,ta.rsi,ta.crossover,ta.macd`, etc. - `plot`, `plotshape`, `bgcolor`, `line.new`, `label.new`, `box.new`, `table.new` — the drawing outputs. Custom HPT indicators draw levels with
line.newand labels withlabel.new. - `alertcondition()` / `alert()` — defines the conditions you can then attach a real alert to.
- `request.security()` — pulls data from another symbol or timeframe (the engine behind multi-timeframe indicators — e.g., show the daily 55-EMA bias on a 5-minute chart).
The honest limitations
- Pine runs on the chart, bar by bar; it's not a general-purpose language and can't hit arbitrary external APIs.
- Repainting is the classic trap: some scripts look perfect on history but behave differently live because they used future-peeking logic. Understand whether a script repaints before you trust its signals.
- Community scripts are unvetted. A five-star indicator can still be curve-fit garbage. Read the logic or test it in replay before you rely on it — and a passing compile is not a working strategy.
You can go a long way just editing others' scripts: open a community indicator's source (if the author left it open), tweak an input or a color, and save your own version. That's how most people learn Pine — by modifying, then building.
15. Connecting a Broker — Trade From the Chart
TradingView is now an execution front-end. You can connect a supported live brokerage account and place, modify, and cancel orders directly on the chart, or use the built-in Paper Trading account to practice with zero risk first.
Paper trading first
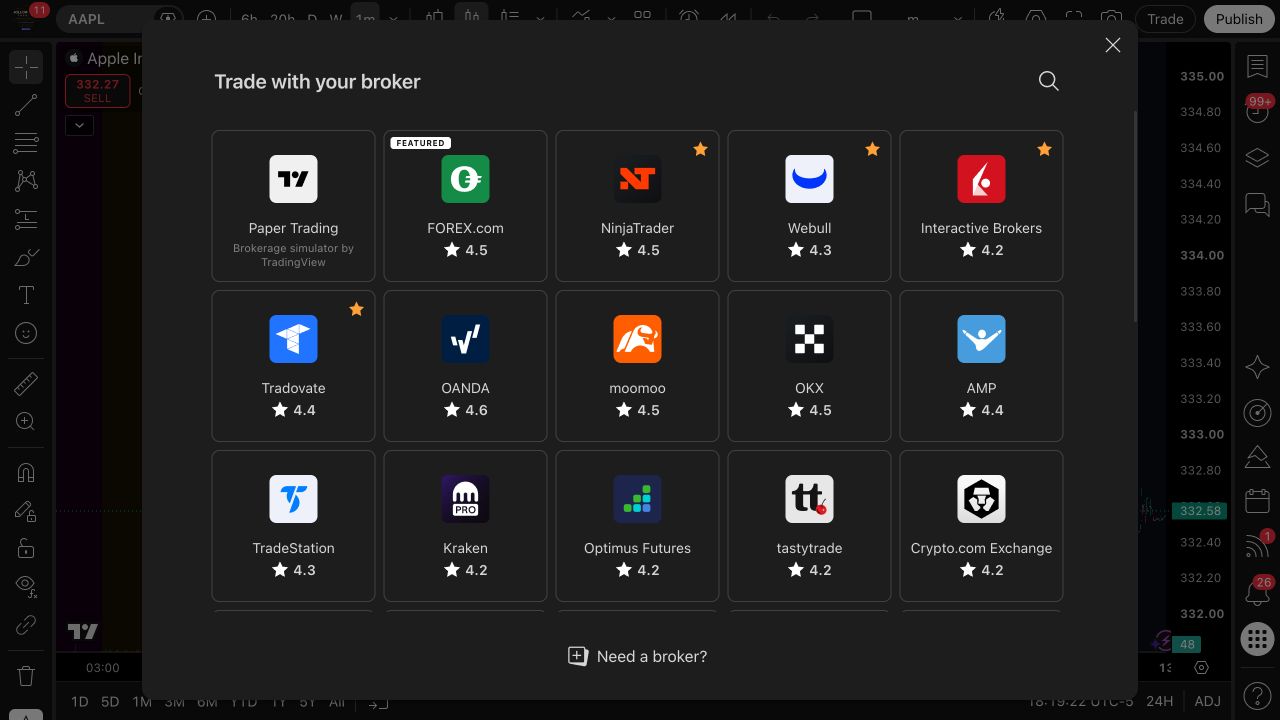
Click Trade at the top right to open the broker-selection panel. It includes Paper Trading — a simulated account funded with fake money, using live prices. Start here. Practice the order types, the position tool, and managing a trade on the chart before a cent is real. HPT would put every new trader through weeks of paper reps and bar-replay reps before live size.
Connecting a real broker
Click Trade to open the list of supported brokers (the roster changes — it has grown to include a range of futures, stock, and crypto brokers, and options execution through partners has expanded in 2026). Select yours, follow that broker’s official authentication flow, and your live account, buying power, and positions appear in the panel.
A note on security and availability: broker support is region- and asset-dependent, and connecting is done through the broker's own login — never enter broker credentials into anything that isn't the broker’s verified login flow. Verify your specific broker is supported and what it's approved to trade.
Trading from the chart
Once connected:
- DOM / order ticket — place market, limit, stop, and stop-limit orders from the panel or by right-clicking a price → Trade.
- Drag-to-trade — drag order lines on the chart to reprice a limit or move a stop; the position, stop, and target render as lines you can drag.
- Bracket orders — attach a stop-loss and take-profit to an entry so risk is defined at the moment of the fill. This is where the Long/Short Position tool meets execution: you size the trade to 1:3 R/R with the position tool, then place the bracket at those exact prices.
- Positions and P&L — live on the chart, with the account panel showing open positions, working orders, and history.
The workflow this unlocks: read the chart top-down, mark the level, draw the position tool to confirm the 1:3, set the bracket at those prices, and manage the trade — all without leaving the chart. Analysis and execution in one motion. But the connection doesn't add discipline; it removes friction. Friction was the only thing stopping a lot of impulse trades. Keep the rules on: no entry without confluence and a real 1:3, stop beyond invalidation, size fixed. The chart makes it easy to fire — your rules decide whether you should.
16. How HPT Runs the Top-Down Read on TradingView
Everything above is capability. Here is the process it serves — the way Hollow Point actually uses TradingView to turn a chart into a decision.
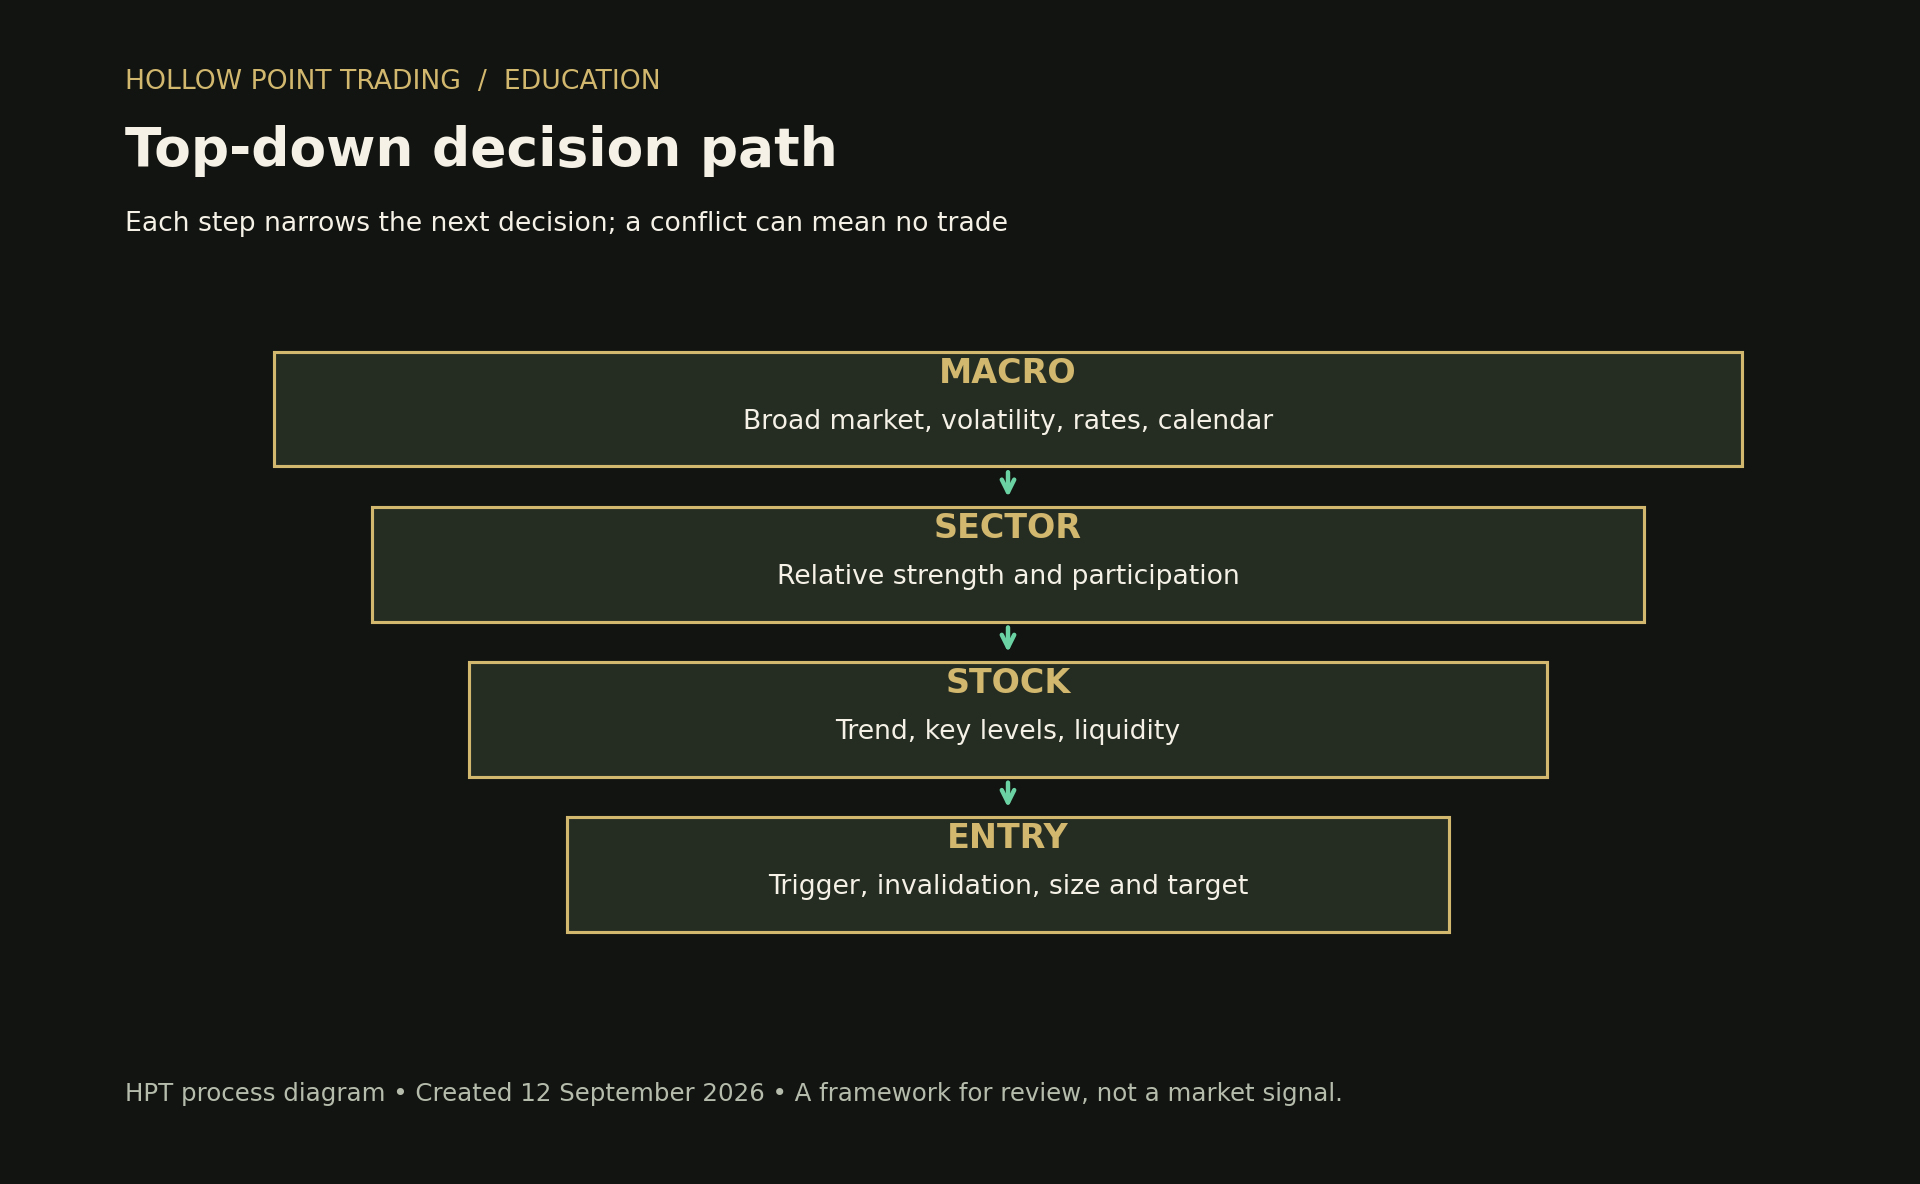
Macro → sector → stock
The read starts big and narrows. Three linked watchlists mirror the funnel:
- Macro / environment — indices (ES/NQ/SPX), VIX (fear), DXY (dollar), US10Y/yields, and the market internals. This answers what kind of day is this — risk-on or risk-off, trending or chopping. You don't fight the environment.
- Sector — the sector ETFs and leaders. Where is the relative strength? A chart of
STOCK/SPY(a spread symbol) tells you instantly if a name is leading or lagging the market. You want to be long the strong things in a strong tape, short the weak in a weak tape. - Stock / instrument — the actual name you'll trade, read only after macro and sector give you a direction to lean.
The ladder, nested
On the chosen instrument, walk the timeframe ladder top-down. Daily and weekly 55-EMA set the bias — which side you're allowed to trade. The 1H–4H give you structure and the drawn levels (prior day high/low, key horizontals, the Fib leg and its golden pocket, VWAP, volume-profile POC and value area). The 1m–15m give entry timing — the candle, the reclaim, the rejection. A signal on the 5-minute only counts when it agrees with the structure above it. This nesting is why TradingView's linked multi-chart layout is the HPT cockpit: one symbol, the whole ladder, synced.
Confluence, then risk
A setup earns a trade only when multiple independent tools point the same way at the same price: structure (a level), the EMA stack (trend), a Fib (the golden pocket), VWAP or volume-profile value, and the tape (the candle). Manufactured confluence — five redundant oscillators all saying the same thing — doesn't count; that's one signal wearing five costumes. Real confluence is independent evidence agreeing.
Then risk governs everything. Draw the Long/Short Position tool: entry, stop beyond invalidation — below support for a long or above resistance for a short (not a random distance), target at the next structural level. If the geometry won't give you 3:1 reward-to-risk, there is no trade — you pass, and you wait for one that does. Set the alert at the trigger with Once Per Bar Close so a wick can't bait you in. That's it: bias from the top, level from the middle, timing from the bottom, confluence to qualify, 1:3 to size, alert to wait.
Discipline over prediction
The tools don't predict; they frame. TradingView's job is to make the read fast, repeatable, and honest — same process on every name, every day, no shortcuts — so the only variable left is your discipline. The best trade the platform enables is often the one you don't take because the confluence wasn't there. Bar replay builds the pattern memory; alerts remove the babysitting; the position tool enforces the math; the ladder keeps you honest about which timeframe you're really trading. The platform is the cockpit. The rules fly the plane.
17. Common Mistakes and Failure Cases
- Reading levels off Heikin Ashi or Renko. Those prices are synthetic. Set orders on standard candlesticks only.
- Linear scale on long-term charts. On a multi-year chart, a logarithmic price scale (right-click the price axis → Log) shows percentage moves correctly; linear scale distorts everything below the recent price. Long-term structure and trendlines belong on log.
- Indicator soup. Six oscillators that all measure momentum is one opinion, not confluence. Pick one of each type.
- Alerts on "Once Per Bar" or "Only Once" for level breaks. Wicks bait them. Use Once Per Bar Close for confirmation.
- Chasing community scripts without checking for repainting. A perfect-looking backtest can be future-peeking. Verify in replay.
- Trading the bottom of the ladder against the top. A clean 5-minute long inside a daily downtrend is a low-quality trade. Nest your timeframes.
- Rebuilding your setup every session. If you're not using indicator templates, drawing templates, favorites, and saved layouts, you're wasting the platform's biggest edge — repeatability. Build it once.
- Letting the broker connection erode the rules. One-click execution removes the friction that used to stop impulse trades. Keep confluence and 1:3 mandatory.
- Not checking that the UI moved. TradingView ships updates constantly. If a button isn't where a guide says, it moved — right-click around, or check the settings gear. Verify the current screen.
18. Quick-Reference Cheat Sheet
Plans (verify live pricing): Basic (free) → Essential → Plus → Premium → Ultimate. Upgrade for the specific limit you hit: 2-indicator cap (→ choose a plan with enough slots), expiring alerts (→ Premium for non-expiring), seconds data (→ Premium), 16 charts (→ Ultimate).
Interface zones: Top toolbar (symbol, interval, type, indicators, alert, replay, layout) · Left toolbar (drawings) · Right sidebar (watchlist, alerts, news) · Center (chart + price/time scales) · Bottom chart controls (date range and time); right-side Pine and Screeners controls; optional trading/report panels.
Symbology: EXCHANGE:TICKER · continuous futures NQ1! · spreads/expressions AAPL/SPY · macro US10Y.
Chart types: Candles (base — real prices) · Heikin Ashi (trend filter — synthetic prices, never trade off them) · Bars, Line, Baseline (bias) · Renko/Range/Kagi/P&F (noise filters, confirmation only).
HPT indicator stack: EMA 12/22/55 (daily 55 = bias) · VWAP + anchored VWAP · Volume · RSI · MACD · Anchored Volume Profile (POC/VAH/VAL). Save as an indicator template.
Fib: draw across the swing leg → watch the golden pocket 0.618–0.65. Extensions for targets.
Alerts: Alt/Opt+A. Use Once Per Bar Close for level breaks. Premium+ = non-expiring. Webhooks for automation.
Screener funnel: filter thousands → shortlist → top-down read each → confluence + 1:3 → trade.
Bar Replay: select a historical starting bar, then use play and step-forward controls. Use Replay Trading for historical simulated orders; Paper Trading uses real-time data.
Layouts: link symbol across panes set to different timeframes = whole ladder from one ticker. Save as a named layout.
Core hotkeys: type = symbol search · number/letter = interval · Alt+T/H/V/F = trend/horizontal/vertical/Fib · Alt+A = alert · Alt+I = invert (bias check) · Shift+drag = measure · ⌘/Ctrl+S = save · ⌘/Ctrl+Z = undo.
Position tool: set entry/stop/target → reads live R/R. No 1:3, no trade.
Broker: paper trade first → connect through the broker’s official login → bracket orders (entry + stop + target) drag-to-trade on the chart. Rules stay on.
The read: macro → sector → stock. Bias from daily/weekly 55-EMA. Levels from 1H–4H. Timing from 1m–15m. Confluence to qualify. 1:3 to size. Alert to wait. Discipline over prediction.
Sources: TradingView pricing · Hollow candles · Pine Editor · Bar Replay · Replay Trading · Shortcut reference
Bound by rules, feared by trade.