
Price is not random, but it is not a machine either. It is a crowd — thousands of people acting on fear, greed, hope, and exhaustion, leaving a footprint in candles and volume. Two men spent their lives learning to read that footprint. Ralph Nelson Elliott mapped the shape of crowd emotion into repeating wave patterns. Richard Wyckoff mapped the mechanics of how large operators quietly load and unload positions against that crowd.
Used badly, both become religion — over-counted squiggles and hindsight fairy tales. Used well, they are the best context tools in trading: they tell you where in the story you are so your entries, stops, and targets stop being guesses. This guide teaches both so you can put them to work Monday — as context, never as gospel.
Here is the promise of this piece, and its limit. By the end you will be able to look at any chart on any timeframe and answer three questions: Is this a trend or a range? Where in the sequence am I? What price proves me wrong? You will not be able to predict the future, and anyone who tells you these tools do that is selling you something. What they do is convert a blank, intimidating chart into a story with a beginning, a middle, an end, and — most importantly — a clearly marked exit if the story you're telling turns out to be fiction.
Part One: Elliott Wave — The Shape of Crowd Emotion
The concept
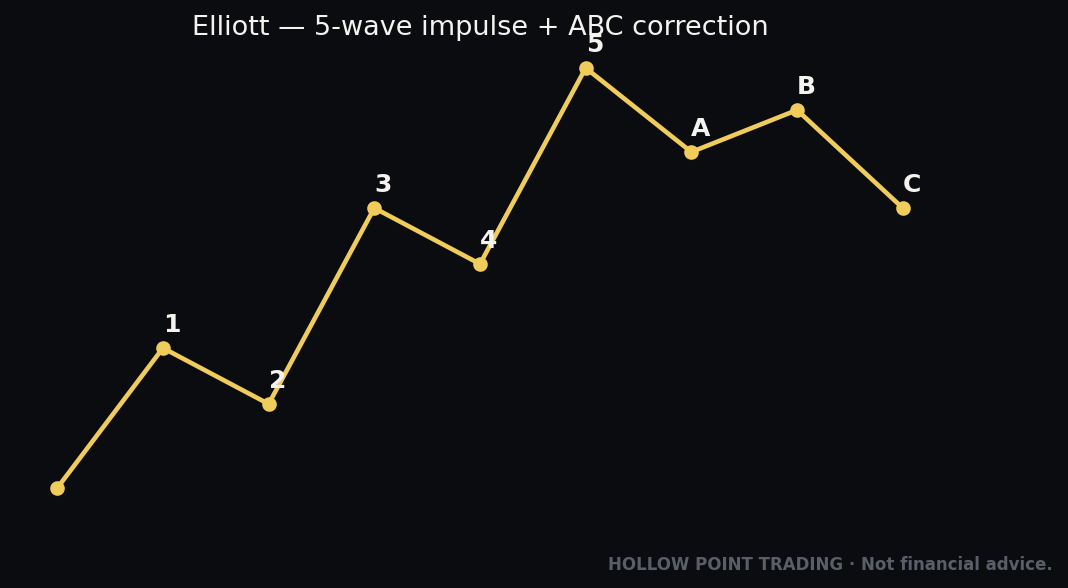
Elliott's core claim is simple and radical: markets move in repeating patterns driven by the swing of mass psychology between optimism and pessimism, and those patterns are fractal — they look the same on a 5-minute chart and a monthly chart. The unit of that movement is the wave. Waves group into a repeating rhythm: a five-wave move in the direction of the larger trend (the impulse), followed by a three-wave move against it (the correction). Five up, three down. Then it repeats at a larger scale.
That's the whole skeleton. Everything else is detail hanging off it.
The reason it works — when it works — is that crowds behave the same way regardless of what's being traded. Enthusiasm builds, gets ahead of itself, pulls back, resumes with conviction, tops out in euphoria, then unwinds. Elliott just gave that emotional arc a numbering system.
It helps to understand why the number five and the number three keep appearing, because once the logic clicks you stop memorizing and start seeing. A trend needs to move net distance in one direction, but it can't move in a straight line — a straight line has no participants left to convince. So it advances, pauses to let doubters sell and let latecomers buy the dip, advances again, pauses again, advances a final time. Three advances, two rests: five waves. The correction only needs to relieve the excess, not build a new trend, so it does less work — down, a deceptive bounce, down again: three waves. The whole structure is just the minimum choreography required for a crowd to change its collective mind and then change it back.
Degrees: why the same pattern lives at every zoom level
Elliott gave the different scales names — Grand Supercycle down through Subminuette — but you don't need the vocabulary. You need the idea: the wave 1 you count on the daily chart is itself a complete five-wave impulse on the 1-hour chart, and the wave 3 you count on the 1-hour is a five-wave impulse on the 5-minute. This is the single most important thing to internalize, because it explains both the power and the danger of the framework. The power: every wave you trade has an internal structure you can use to confirm it. The danger: because waves nest infinitely, a chart is never out of counts — there is always some labeling that fits, which is exactly why over-counting is the disease of Elliott (more on that below).
A practical rule of thumb: only ever seriously count two degrees at once — the degree you're trading and the one directly above it that sets your bias. Trying to hold five nested degrees in your head simultaneously is how analysis paralysis and false precision are born.

The mechanism: the 5-3 cycle
A complete Elliott cycle has eight waves: five in the impulse (labeled 1-2-3-4-5) and three in the correction (labeled A-B-C).
The impulse — five waves, direction of trend:
- Wave 1 — The first push off a low. Usually happens when sentiment is still bearish; few believe it. Often looks like just another bounce in a downtrend. Volume is decent but unremarkable. Nobody is calling a bottom here except contrarians who've been wrong five times already.
- Wave 2 — The pullback. Doubt returns; the crowd assumes the old trend resumes. Wave 2 often retraces deeply — 50% to 78.6% of wave 1 — and feels like the rally failed. It didn't. The emotional signature of wave 2 is relief for the bears and regret for the early bulls — precisely the sentiment that makes a great entry, because everyone who's going to sell has sold.
- Wave 3 — The powerhouse. This is where the trend becomes obvious, news turns positive, and the crowd piles in. Wave 3 is usually the longest and strongest, and it is never the shortest of the three impulse waves. Gaps, volume expansion, and momentum extremes live here. If you catch one wave in your trading life, make it a wave 3 — this is where the money is made with the trend at your back.
- Wave 4 — The rest. A shallower, often messy, sideways correction while the trend catches its breath. Typically retraces only about 38.2% of wave 3. Wave 4 is frustrating to trade through — it chops, it fakes, it bleeds impatient traders — which is the whole point. It's shaking out the people who bought wave 3 late.
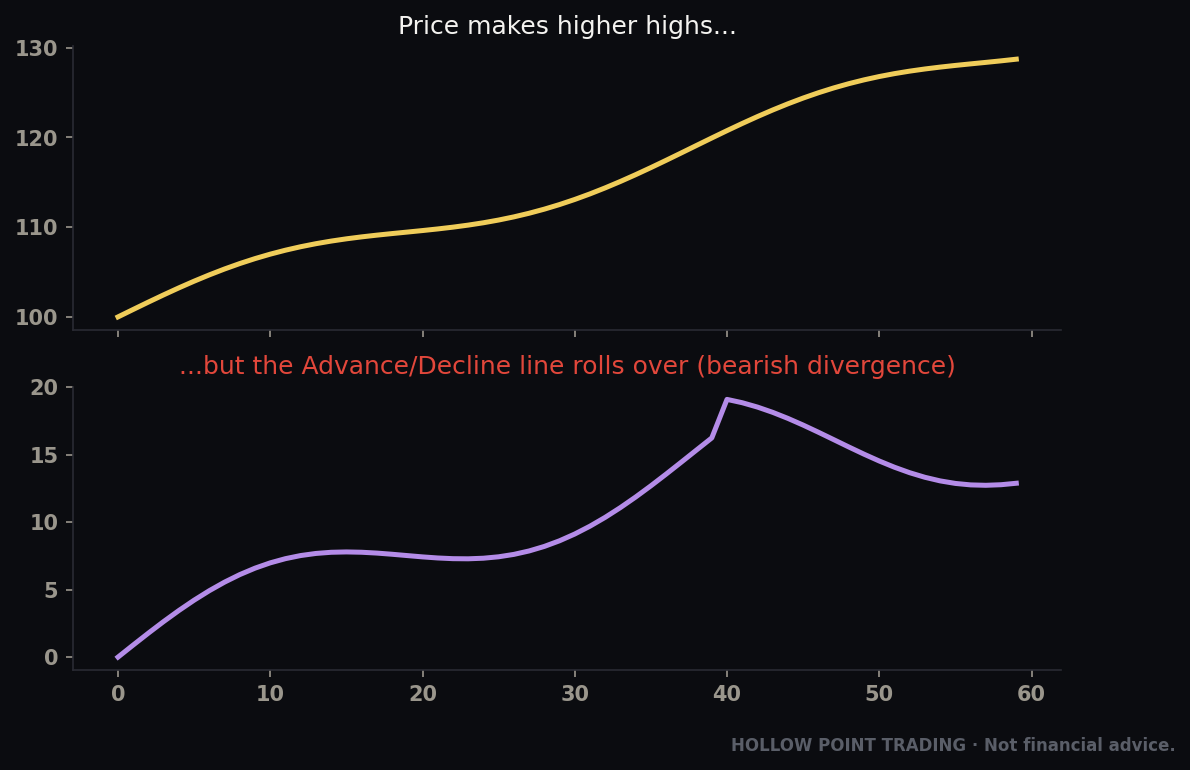
- Wave 5 — The final push to new highs, often on weaker momentum than wave 3. This is the euphoria wave — divergences on RSI/MACD are common as price makes a new high but strength doesn't confirm. The crowd is now maximally bullish exactly when the move is nearly done. Wave 5 is where your neighbor finally buys.

The correction — three waves, against the trend:
- Wave A — The first leg down. The crowd calls it a dip and buys it, because "the trend is your friend" and it's worked all the way up. They are early.
- Wave B — A bounce that sucks people back in (the "bull trap" in a topping market). B can be tricky and often retraces most of A. This is where the "buy the dip" crowd feels vindicated, right before they're punished. B waves are the most treacherous, least tradeable structures in all of Elliott.
- Wave C — The decline that convinces everyone the trend has changed. C is usually a clean, strong five-wave move down of its own, and it typically travels at least as far as A. By the bottom of C, the same people who bought the dip at A are swearing off the market forever — which is the sentiment that seeds the next wave 1.
Then the whole eight-wave cycle becomes a single wave of the next larger degree. Wave 1 on the daily might be five waves on the 1-hour. That's the fractal nature — and it's both the power and the trap of Elliott, which we'll get to.
Not all corrections look alike: zigzags, flats, and triangles
Beginners assume every correction is a clean, sharp A-B-C. In reality corrections come in three broad families, and knowing which one you're in changes how you wait.
- Zigzag — sharp, deep, directional. A goes far, B bounces modestly (usually retracing 38–61% of A), C extends to a new extreme. This is the "waterfall" correction. It clears excess fast and is the easiest to recognize.
- Flat — sideways and grinding. A and B are roughly equal, and C ends near the level where A ended. Flats feel like a range and they exhaust impatient traders. A special nasty variant, the expanded flat, sees B push beyond the start of A (a fresh high in an uptrend correction) before C collapses — a textbook bull trap that fools almost everyone.
- Triangle — five overlapping sub-waves (a-b-c-d-e) that coil into a narrowing range. Triangles appear almost exclusively in wave 4 or wave B positions, and they resolve in the direction of the prior trend. A triangle is the market's way of saying "consolidating before one more push."
The practical takeaway: when a correction is sharp and deep, expect a zigzag and get ready quickly; when it goes sideways and boring, expect a flat or triangle and be patient — the pullback isn't done just because it looks tired.

The three rules that cannot be broken
Elliott has countless guidelines, but only three hard rules. If your count breaks one, your count is wrong — full stop. This is your discipline check.
- Wave 2 never retraces more than 100% of wave 1. If price falls below the start of wave 1, whatever you're counting isn't wave 2.
- Wave 3 is never the shortest of waves 1, 3, and 5. It doesn't have to be the longest (though it usually is), but it can't be the runt.
- Wave 4 never enters the price territory of wave 1. The wave-4 low can't overlap the wave-1 high (in a standard impulse; rare "diagonal" patterns are the only exception). This overlap rule is the single most useful invalidation line you'll draw.
Memorize these three. They turn Elliott from art into something with hard invalidation — which is exactly what a rules-bound trader needs. Notice that each rule doubles as a stop-loss location. Rule 1 gives you the stop for a wave-2 long entry. Rule 3 gives you the stop for a wave-4 continuation entry. The rules aren't academic trivia — they are the risk lines the whole framework is built to hand you.
There's a subtle fourth idea that isn't a "rule" but nearly is — alternation: if wave 2 was a sharp, deep, quick correction, wave 4 will tend to be a shallow, sideways, slow one, and vice versa. Nature rarely repeats the same correction twice in a row. When you've seen a violent wave 2, don't expect wave 4 to be violent too — expect it to grind, and don't get faked out of your position by the boredom.
Fibonacci inside the waves
Elliott waves relate to each other by Fibonacci ratios — the same 0.382, 0.5, 0.618, 1.0, 1.618, 2.618 you already use for retracements. This is where the framework gets tradeable, because it gives you specific prices to watch.
Typical relationships (guidelines, not laws):
- Wave 2 retraces 0.5 – 0.786 of wave 1. The 0.618 "golden pocket" is the classic wave-2 entry zone.
- Wave 3 extends to 1.618 or 2.618 of wave 1, measured from the wave-2 low.
- Wave 4 retraces 0.382 of wave 3 — shallow, because the trend is strong.
- Wave 5 often equals wave 1 (a 1.0 ratio) or measures 0.618 of the net distance from wave 1's start to wave 3's top.
- Wave C often equals wave A, or 1.618 × wave A.
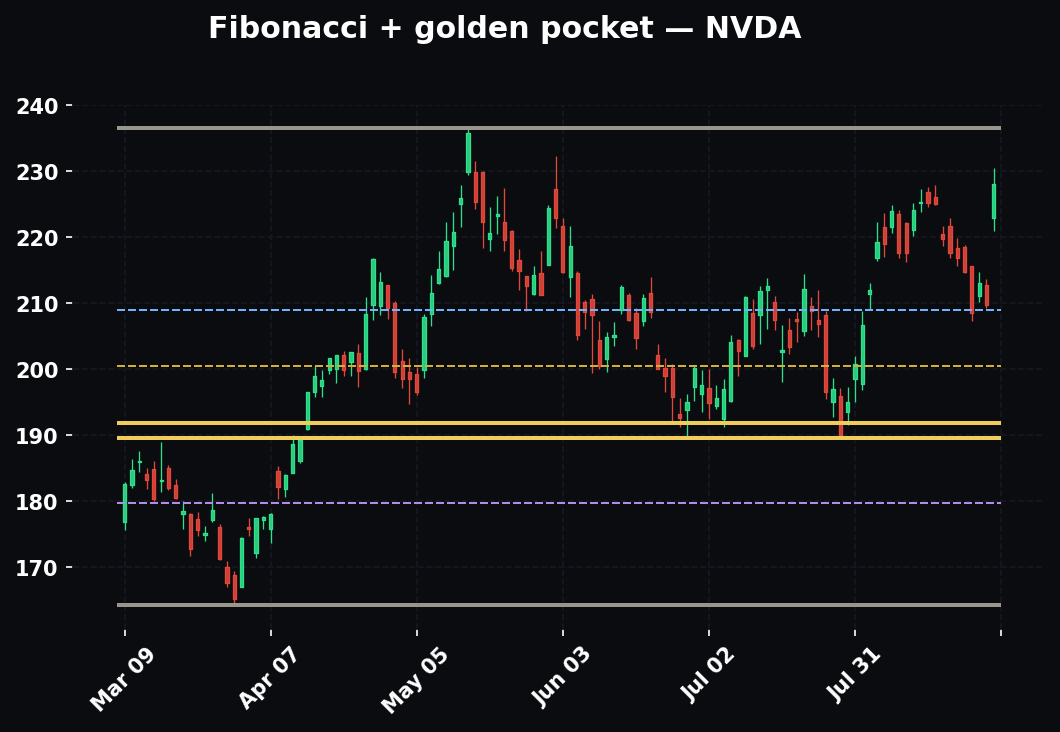
Here's the practical move: when a wave-2 pullback lands in the golden pocket (0.618-0.65) of wave 1 and aligns with an EMA or prior structure, you have confluence — Elliott plus Fibonacci plus a level, all pointing at the same price. That's a wave-3 entry with a defined stop (below the start of wave 1, per Rule 1).
There's a second, underused Fibonacci trick: projecting where wave 5 ends by measuring wave 3 and applying wave equality. In a "normal" impulse, wave 5 frequently equals wave 1 in length. So once wave 4 completes, take the price distance of wave 1, add it to the wave-4 low, and you have a first-approximation target for the top of wave 5 — which is also your signal to stop adding and start managing the exit rather than chasing. Elliott is at least as useful for telling you when a move is nearly over as for telling you it's beginning.

The signature of wave 3: how to know you're in the good one
Because wave 3 is where the trading edge lives, it's worth cataloguing its fingerprints so you can recognize it in real time rather than in hindsight:
- Momentum extremes. RSI and MACD hit their most stretched readings of the entire cycle during wave 3 — not wave 5. If your strongest momentum reading came at the final high, that "final high" was probably wave 3, and a wave 4/5 still lies ahead.
- Gaps that don't fill. Breakaway and runaway gaps cluster in wave 3. A gap that stays open is a tell that the crowd is chasing, not fading.
- Volume expansion. Effort and result move together in wave 3 — the one place in the whole sequence where high volume produces large, trend-direction candles with no absorption.
- News catches up. The narrative that "explains" the move usually arrives during wave 3. By the time the story is on the front page, you're often late to wave 3 and early to the wave-4 shakeout.
How to read it: a worked example
Say NQ puts in a clear low at 19,500, then rallies 300 points to 19,800 — call that a candidate wave 1. It pulls back. You measure the fib retracement of that 300-point leg. Price stalls at the 0.618 level (around 19,615), which also happens to sit right on the rising 22-EMA and the top of a prior consolidation. Three things agree.
- The setup: long into that 19,615–19,620 zone, anticipating wave 3.
- The stop: just below the start of wave 1 at 19,500 — call it 19,490 (Rule 1 — if it breaks, it's not a wave 2, the count is dead, you're out). Risk ≈ 125 points.
- The target: wave 3 projected at 1.618 × wave 1 from the pullback low. With wave 1 at 300 points, that's ~485 points of extension off the 19,615 low → roughly 20,100. Reward ≈ 485 points against 125 points of risk — nearly 1:4, baked into the structure.
Now watch how the trade manages itself using the framework. As price rallies through the old 19,800 high, wave 3 is confirmed — you can move your stop to breakeven. When momentum stretches to an RSI extreme and price approaches the 1.618 projection near 20,100, you take partial profit and trail the rest, because you know a wave-4 shakeout is statistically next and you don't want to give back an open winner into it. If price then chops sideways and holds above the wave-1 high (respecting Rule 3), you have a second setup: the wave-4 low becomes a lower-risk continuation long targeting a wave-5 push, with a stop below the wave-1 high.
Notice what happened: Elliott didn't predict anything. It gave you a framework for a bet with defined invalidation and asymmetric reward — and then a roadmap for managing the winner and finding the next entry. If wave 3 fails to extend and you break the stop, you lose small and move on. That's how you use it.

Elliott across market regimes
The framework does not behave the same in every environment, and pretending it does is how people lose money.
- Clean trend (post-breakout, strong ADX). This is Elliott's home field. Impulses are crisp, wave 3s extend, fib relationships hit cleanly. Trade wave-2 and wave-4 pullbacks with confidence.
- Chop / range-bound. This is Elliott's graveyard. Corrective structures dominate, counts are ambiguous, and every clean-looking impulse fails at 3 waves. The right Elliott read in chop is "this is a correction, I don't have an impulse, I stand down." In ranges you switch tools — this is where Wyckoff takes over (Part Two).
- High-volatility / news-driven. Waves overshoot fib levels, wave 2s go to 0.786 or deeper, and stops get run before the "real" move. Widen your invalidation slightly or reduce size, and lean harder on confluence — a lone wave count in a high-vol tape is a coin flip.
The meta-skill is knowing which regime you're in first, and only then deciding whether Elliott even applies. A trader who forces impulse counts onto a choppy, corrective tape will be wrong most of the time and blame the framework. The framework was telling them to wait.
The trap of over-counting
Here is the honest part. Elliott's fractal nature — the thing that makes it elegant — is also what makes it dangerous. Because waves nest inside waves, a determined chartist can always find a count that fits. And because the count can be re-labeled after the fact, Elliott is the most hindsight-friendly framework in existence. Every crash "was obviously wave C." Sure it was.
The failure modes:
- Forcing a count on choppy, corrective, sideways price that simply has no clean impulse. Not every market is in a countable wave. Most of the time it's in a mess.
- Re-labeling to stay right. When price violates your count, the temptation is to renumber rather than admit the setup is dead. This is how traders hold losers.
- False precision. Believing you know it's wave 3 of 3 of 5 to the tick. You don't. Nobody does.
- Ignoring the rules to save the story. If you find yourself explaining away a wave-4 overlap, stop. The rule is the rule.
- Counting every degree at once. Trying to label the monthly, weekly, daily, hourly, and 5-minute simultaneously produces a Christmas tree of conflicting numbers and zero decisions. Two degrees, maximum.
The fix is a discipline rule: treat your count as a hypothesis with a hard invalidation price, sized so being wrong is cheap. If the count breaks a rule, it's not a "different count now" — the trade idea is over. Elliott is a lens for where you probably are, not a crystal ball for where you're going. A professional keeps at most a primary count and one alternate, each with its own invalidation, and lets price choose between them instead of marrying either.

Part Two: Wyckoff — The Fingerprints of Smart Money
The concept
Where Elliott reads the emotion of the crowd, Richard Wyckoff reads the mechanics of the people fleecing the crowd. Wyckoff, trading in the early 1900s, noticed that large operators — the ones who move enough size to move price — can't just buy their full position at once without spiking the price against themselves. They have to accumulate quietly over time, absorbing supply from a discouraged crowd, then mark price up. At the top, they distribute — selling into the crowd's euphoria — then mark price down. Wash, rinse, repeat.
Wyckoff personified this force as the Composite Operator (or Composite Man): imagine all the smart, well-capitalized money as one single actor deliberately engineering ranges to shake out weak hands and load up cheap. You don't need to believe a literal cabal exists — the behavior of aggregate large money produces exactly these footprints, and treating it as one operator helps you think like the predator instead of the prey.
The mental shift Wyckoff demands is this: stop asking "is this bullish or bearish?" and start asking "who needs whom here?" A large buyer needs sellers to sell to him, so he must first make sellers want to sell — by breaking support, printing red, and generating fear. A large seller needs buyers to buy from him, so he must make buyers want to buy — by breaking resistance, printing green, and generating greed. Once you see the market as one side manufacturing the emotion that produces the counterparty it needs, the "traps" stop looking like bad luck and start looking like the entire mechanism.

The three laws
Everything in Wyckoff rests on three laws:
- Supply and demand. Price rises when demand exceeds supply and falls when supply exceeds demand. Obvious — but Wyckoff makes you locate where supply and demand are being absorbed, in the range.
- Cause and effect. A period of accumulation (the "cause") produces a proportional markup (the "effect"). The wider and longer the range, the bigger the eventual move. This is why sideways bases matter — they build cause. A three-day base gives a three-day move; a three-month base can give a three-month trend.
- Effort vs. result. Volume is effort; the resulting price move is result. When effort and result disagree — huge volume but price barely moves — something is off, and it usually signals absorption or a coming reversal.
These three aren't independent — they're a chain. The supply/demand imbalance is caused during the range and produces its effect as markup or markdown, and the effort-vs-result readings are how you see the imbalance forming in real time before the effect shows up in price. Read them as one continuous logic, not three flashcards.

The mechanism: accumulation & distribution schematics
Wyckoff mapped the shape of these ranges into schematics with labeled events and phases. You don't trade the labels — you use them to know which side the Composite Operator is on. It also helps to know the phases (A through E), because they tell you how far along the story is:
- Phase A — stopping the prior trend (PS, SC, AR, ST). The downtrend is being halted.
- Phase B — building the cause (the long, choppy middle where the operator accumulates). This is the boring part that lasts the longest.
- Phase C — the test (the spring or upthrust). The decisive shakeout.
- Phase D — the trend within the range asserting itself (SOS, LPS). Demand is now clearly winning.
- Phase E — markup out of the range. The trend everyone can see.
Accumulation (the base before a markup):
- PS — Preliminary Support: first sign of buying showing up after a decline.
- SC — Selling Climax: the panic-low washout, huge volume, wide range down, where the crowd capitulates and the operator absorbs.
- AR — Automatic Rally: the sharp bounce off the SC as selling dries up. The SC low and AR high define the range.
- ST — Secondary Test: price returns toward the SC low on lower volume, testing whether supply is exhausted. Higher low, lighter volume = good.
- Spring (or Shakeout): the key event — price dips below the range support, trips stops and lures in shorts, then snaps back inside. This is the operator's last cheap fill and the crowd's final flush.
- Test: a low-volume retest of the spring low that holds.
- SOS — Sign of Strength: a strong, wide-range, high-volume rally out of the range.
- LPS — Last Point of Support: the higher-low pullback after the SOS — the ideal, lower-risk long entry before markup.
Distribution (the top before a markdown) is the mirror image:
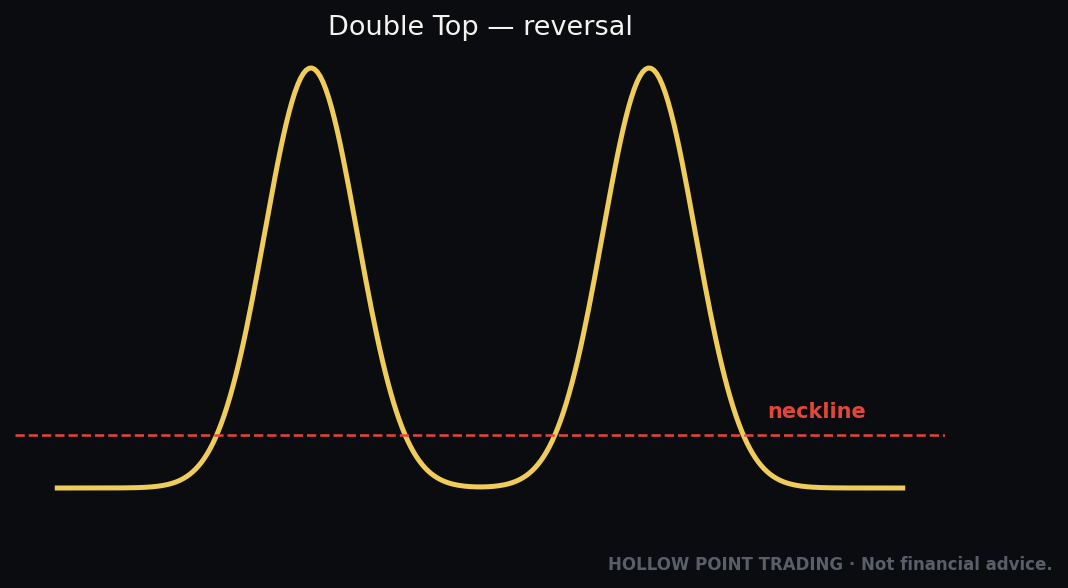
- PSY — Preliminary Supply, then BC — Buying Climax (euphoric high-volume top), AR — Automatic Reaction down, ST — Secondary Test of the highs on lighter volume.
- UT / UTAD — Upthrust / Upthrust After Distribution: price pokes above the range high, trapping breakout buyers, then falls back in. The distribution mirror of the spring.
- SOW — Sign of Weakness, LPSY — Last Point of Supply (the lower-high bounce that fails), then markdown.
One honest caution the textbooks skip: not every base is accumulation, and not every top is distribution. Sometimes a range that looks like accumulation simply breaks down and keeps going — the operator was distributing the whole time, or there was no operator and supply genuinely won. This is why the spring/upthrust and the volume behavior matter more than the pretty schematic. The schematic is the hypothesis; the effort-vs-result reading is the evidence.
Springs and upthrusts: the money events
If you learn one thing from Wyckoff, learn these two.
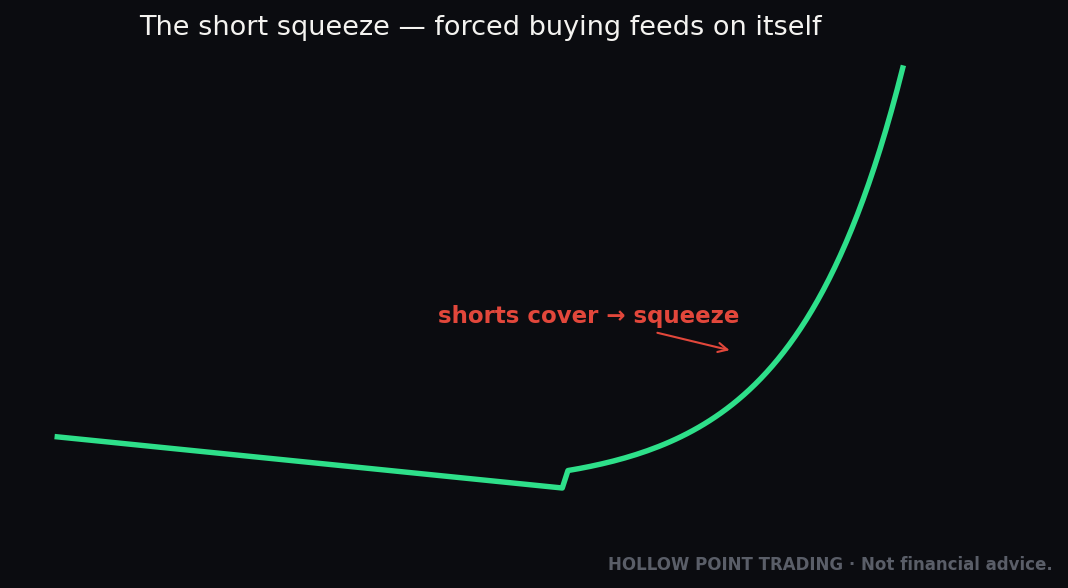
A spring is a false breakdown. Support gets broken — briefly — which does two things for the operator: it triggers the stop-losses of everyone long (supply he happily buys) and sucks in fresh shorts (who become forced buyers when they cover). Then price reclaims the range and rips. The tell is volume and recovery speed: a real spring recovers fast, often on a sharp volume expansion, and the low is never revisited with force.
An upthrust is the same trick upside-down: a false breakout above resistance that traps buyers, then collapses back into the range. Every trader who's ever bought a breakout that immediately reversed has been on the wrong side of an upthrust.
Wyckoff actually graded springs by how much supply still lurks below support, and the distinction is worth knowing because it tells you how aggressive to be:
- Terminal / #3 spring — price barely pokes below support on low volume and snaps back instantly. Almost no supply left. Highest-conviction long.
- #2 spring — a moderate break on moderate volume that needs a secondary test to confirm. Wait for the test.
- #1 spring — a deep break on heavy volume. Real supply is still present; this may not hold at all. Stand down until it proves itself.
The practical read: breakouts and breakdowns at the edge of an established range are guilty until proven innocent. Wait for the reclaim. A spring that recovers into the range is a far higher-quality long than chasing the breakdown — and a far better entry than the eventual SOS, because your stop (below the spring low) is tight.
Effort vs. result, in practice
This is the most portable Wyckoff idea — you can use it on any chart tomorrow without labeling a single schematic.
- High volume, small price move (up): buyers are throwing everything at it and price won't budge. Supply is absorbing the effort. Bearish — someone big is selling into the buying.
- High volume, small price move (down): heavy selling, but price holds. Demand is absorbing. Bullish — someone is buying every share offered.
- Low volume on a pullback: no real selling pressure; the pullback is just a lack of buyers, not aggressive supply. Healthy in an uptrend.
- A new high on declining volume:* effort fading — the move is running on fumes. Watch for a reversal.
- A wide-range bar on huge volume that closes on its high: effort and result agree — genuine demand, no absorption. This is a Sign of Strength, not a trap. The distinction between this and the first case is the close: closing on the high means buyers won; closing mid-range on the same volume means supply capped it.
That new-high-on-declining-volume case should sound familiar — it's the same warning an RSI divergence gives you in Elliott's wave 5. The two frameworks describe the same exhaustion in different languages. When Wyckoff's effort-vs-result and Elliott's momentum divergence flash at the same price, you're not looking at two signals — you're looking at one truth confirmed twice.
How to read it: a worked example
A stock sells off hard for weeks from 80 down to 50, then prints a massive down-day to 48 on the biggest volume in months — a candidate Selling Climax. Over the next two weeks it bounces to 56 (AR), pulls back on lighter volume to 51 — a higher low (ST) — and starts chopping sideways between roughly 51 and 56. You mark the range: SC low (48) and ST low (51) as the support zone, AR high (56) as resistance.
Then one morning it gaps down through support to 47 on a spike, tags the stops below the range, and by lunch it's back inside the range at 53 and closing green. That's your spring — and because the break was shallow and the recovery fast, it grades as a high-quality one. A few days later it drifts back down to the 49–50 spring area on almost no volume and holds — the test. Then it rips through 56 on a wide-range, high-volume bar closing on its high — the SOS. It pulls back to 55 on light volume — the LPS.
- The setup: long on the test that holds around 50, add on the LPS at 55.
- The stop: below the spring low at 46. If price returns there with force, the accumulation read is wrong.
- The target: cause-and-effect — the range is roughly 8 points wide (48–56); project at least 8 points of markup off the breakout, i.e. 64+, with the wider base often giving considerably more. Off a 50 entry with a 46 stop (4 points of risk) and a 64+ target (14+ points of reward), that's better than 1:3 straight out of the structure.
Again: Wyckoff didn't predict. It told you the operator is accumulating, gave you a tight invalidation at the spring low, and a target from the size of the base. Your job was to wait for the footprint, not to guess the bottom. Notice you had three valid entries with progressively better confirmation and progressively worse price — the spring reclaim (best price, least confirmed), the test (good price, well confirmed), and the LPS (worst price, most confirmed). Which you take is a function of your risk tolerance, not a matter of one being "right."
Wyckoff across market regimes
- Ranging market. Wyckoff's home field, exactly where Elliott struggles. Accumulation and distribution schematics are ranges — this is the tool built for the sideways tape that frustrates trend traders.
- Strong trend. Ranges are shorter and shallower — re-accumulation and re-distribution appear as brief pauses rather than long bases. Springs still work but are smaller; the effort-vs-result read on pullbacks (low-volume pullbacks in an uptrend = healthy) is your main Wyckoff tool here.
- High-volatility / news-driven. Climaxes are violent and springs overshoot hard — the shakeout goes further than seems reasonable before reclaiming. This is dangerous but also where the best springs form, because the panic is real. Reduce size, respect that the spring low can be deep, and demand the reclaim before acting.
Part Three: Fitting Both Into the Top-Down Process
Neither framework is a system on its own. They are context layers that slot into the HPT top-down process: macro → sector → stock, on a timeframe-weighted confluence stack. Here's where each one earns its place.
Start with the macro and the trend. Before any wave count or schematic, you already know the bias from structure and the EMA 12/22/55 stack. Higher timeframe first: is the daily 55-EMA sloping up and price above it, or the reverse? That bias decides which Elliott and Wyckoff patterns you're even allowed to trade. In an uptrend you're hunting wave-2 pullbacks and Wyckoff accumulation springs. In a downtrend you're hunting corrective bounces and distribution upthrusts. Never trade an accumulation long into a macro downtrend just because the schematic looks pretty — the top-down bias vetoes it.
Use Wyckoff to read the range, Elliott to read the trend. They specialize. When price is chopping sideways in a base — no clean impulse to count — Wyckoff is your tool: is this accumulation or distribution? Where's the spring? When price is trending in clean directional legs, Elliott is your tool: which wave are we in, where's the next pullback, where does it invalidate? A common and powerful sequence: Wyckoff accumulation range → spring → SOS becomes Elliott wave 1 → wave-2 pullback → wave-3 markup. The spring is the birth of the impulse. Read them in sequence and they corroborate. This hand-off is the single most useful integration of the two frameworks — the moment Wyckoff's "the base is complete" becomes Elliott's "wave 1 has begun."
The multi-timeframe treatment
The frameworks are fractal, so they should be read at more than one zoom level, but with a clear hierarchy of authority:
- Higher timeframe (daily/weekly) = bias. Here you identify whether you're in a large impulse or a large correction (Elliott) and whether the multi-week structure is accumulation or distribution (Wyckoff). You do not trade off this — you take orders from it.
- Trading timeframe (1H/15m) = setup. Here you find the specific wave-2 golden pocket or the specific spring that you'll actually enter on. The setup must agree with the higher-timeframe bias or you pass.
- Entry timeframe (5m/1m) = trigger. Here you time the entry — the reclaim candle on the spring, the momentum turn out of the golden pocket — to get a tight stop.
The magic happens when the degrees nest correctly: a daily wave-2 pullback that, on the 1-hour, shows a complete A-B-C correction ending in a Wyckoff spring, that on the 5-minute prints a reclaim candle on volume. That is the same event seen at three resolutions, and when three timeframes tell one story your conviction (and your position size, within your rules) is justified. When they conflict — daily says uptrend, hourly says distribution — you don't average them, you stand down. Conflict across timeframes is a signal in itself: it says the picture isn't ready.
Confluence with your other tools
Elliott and Wyckoff are strongest when they're not alone in the room. Three specific pairings:
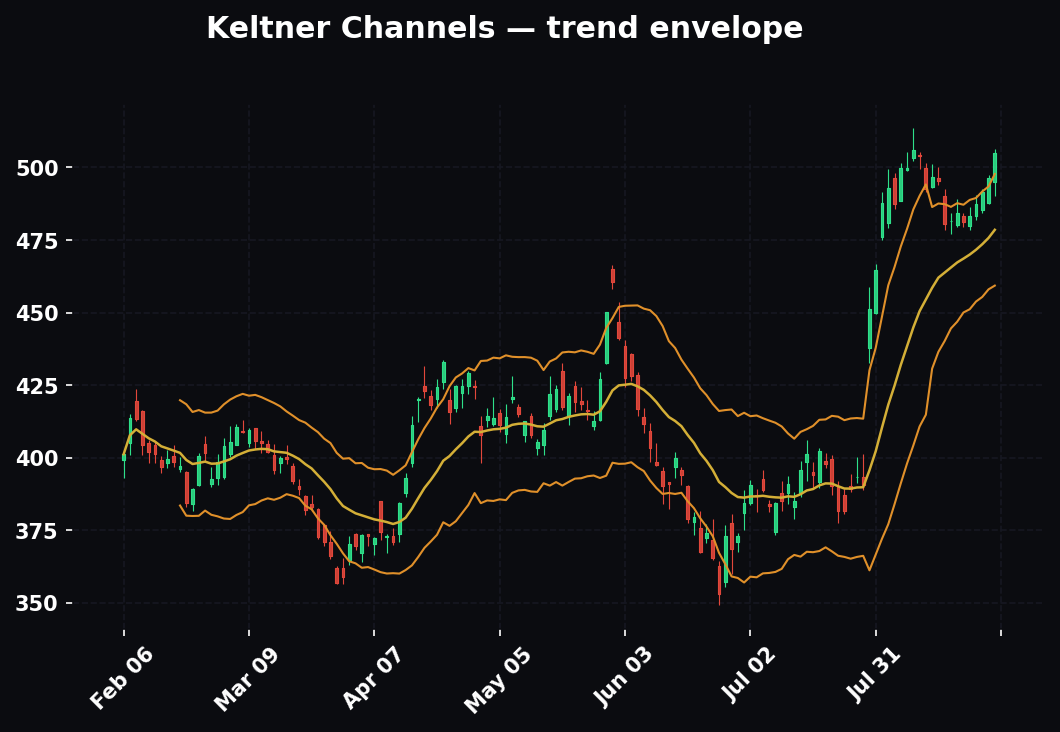
With EMAs (12/22/55). The rising 22-EMA is a magnet for wave-2 and wave-4 pullbacks and for the LPS in an accumulation. When your golden-pocket fib, your wave-2 low, and the 22-EMA all coincide, the EMA gives you a dynamic level that the static fib can't — and the daily 55-EMA gives you the bias veto described above.
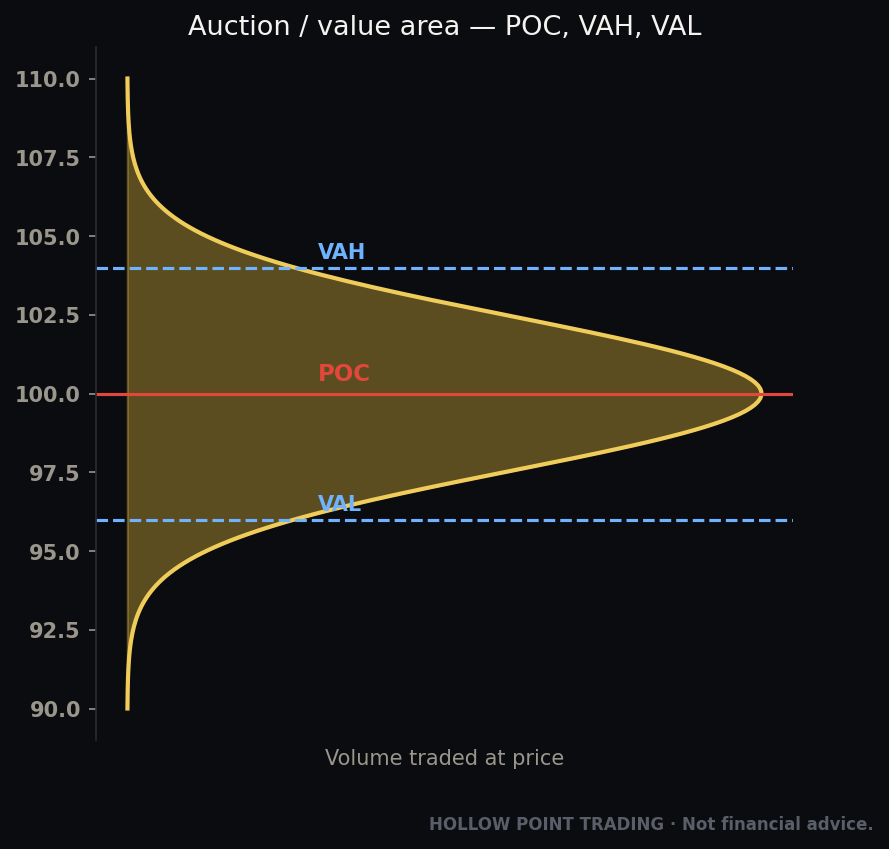
With volume profile / POC. Wyckoff's cause-and-effect is really a statement about where volume was traded. The Point of Control of an accumulation range is where the operator did the most business — and price returning to that POC on light volume is a textbook LPS. Overlaying volume profile on a Wyckoff range turns a hand-drawn schematic into a volume-verified one.
With RSI/MACD divergence. As noted, wave-5 exhaustion and Wyckoff's "new high on falling volume" are the same phenomenon. A momentum divergence at the top of a suspected wave 5 or at an upthrust is the third witness. Three independent tools describing one exhaustion is worth more than any one of them shouting alone.
Stack the confluence. The best trades are where multiple independent lenses point at the same price:
- Elliott wave-2 golden pocket (0.618)
- sitting on the rising 22-EMA
- at the Wyckoff LPS / spring level
- with effort-vs-result volume confirming absorption
- and the daily 55-EMA bias supporting the direction
That's five reasons, weighted toward the higher timeframe. When they align, size up (within your rules). When they conflict, stand down.
Let the framework define R/R, not the other way around. Both frameworks hand you a natural invalidation: Elliott's Rule-1 stop below the wave-1 start or the Rule-3 overlap line; Wyckoff's stop below the spring or above the upthrust. That invalidation is your risk. The wave-3 projection or the range-width projection is your reward. If the structure doesn't offer at least 1:3, the trade doesn't qualify — the framework just told you to pass. That's discipline over prediction in its purest form.
How the Pros Use These Differently From Beginners
The gap between a beginner and a professional using these tools isn't knowledge of the labels — both can recite the wave numbers and the schematic events. The gap is in posture.
- Beginners seek certainty; pros seek invalidation. A beginner wants the count to tell them what will happen. A pro wants the count to tell them what price proves them wrong — and sizes the trade around surviving that. The beginner's question is "am I right?" The pro's question is "how much do I lose if I'm not, and is the payoff worth it?"
- Beginners count everything; pros count almost nothing. A pro will look at a chart, conclude "no clean structure, no trade," and move on 80% of the time. The beginner feels obligated to have a count on every chart at every moment. Most of the money in these frameworks is made by the trades you don't take in the mess.
- Beginners marry a count; pros hold two and let price choose. The professional carries a primary scenario and one alternate, each with its own trigger and invalidation, and is emotionally indifferent to which wins. The beginner has one count, and defends it by re-labeling when it breaks.
- Beginners trade the label; pros trade the behavior. A pro doesn't buy because "it's a spring" — they buy because supply is visibly exhausted (low-volume test, fast reclaim) and the risk is defined. The label is shorthand for the behavior, not a reason on its own.
- Beginners use one framework as a religion; pros use both as instruments. A pro switches from Elliott to Wyckoff the moment a trend becomes a range, without ego, because they're tools not identities. The beginner is "an Elliott guy" or "a Wyckoff guy" and forces their one tool onto every tape.
- Beginners obsess over the perfect entry; pros obsess over the exit and the size. Where you get in matters least. A pro spends their attention on where they're wrong, how much they've risked, and where they'll take profit into strength — because that's where the actual results live.
The Common Mistakes (Both Frameworks)
1. Treating the map as the territory. The count and the schematic are models of crowd behavior, not the behavior itself. Price doesn't owe your labels anything. Hold every count and every schematic as a hypothesis with a kill switch.
2. Hindsight labeling. Both frameworks are trivially easy to fit after the move. The test of a real read is that it made a call before the resolution, with a price that would prove it wrong. If you can only see the count after the fact, you didn't read anything. A useful self-check: timestamp your counts. If you can't point to a chart where you labeled it before it played out, you're not reading, you're rationalizing.
3. Forcing structure onto chop. Not every chart is in a countable impulse or a clean schematic. Most of the time price is in a corrective, low-conviction mess. The professional move is to recognize "no read here" and wait. Absence of a setup is a decision.
4. Ignoring the invalidation to protect the ego. Renumbering a broken Elliott count or re-drawing the Wyckoff range to keep a losing trade alive is the single most expensive habit in both frameworks. The rule broke → the idea is dead → you're out. No exceptions.
5. Skipping volume (Wyckoff) or skipping the rules (Elliott). Wyckoff without volume is just drawing boxes. Elliott without the three rules is just doodling. Each framework has a spine — effort-vs-result for Wyckoff, the three rules for Elliott. Drop the spine and you've got astrology.
6. Using them alone. Neither is a complete system. They are context that must sit inside the top-down bias and be confirmed by your other confluence. A wave count that fights the daily 55-EMA is a warning, not a trade.
7. Confusing wave 3 with wave 5 (and buying the top). The most expensive Elliott error in dollar terms: mistaking the euphoric, diverging wave 5 for a fresh wave 3 and piling in at the exhaustion point. The tell is momentum — wave 3 has the strongest readings; a "new high" on weaker momentum than the last high is wave 5, and you sell it, you don't chase it.
8. Chasing the breakout instead of waiting for the spring/upthrust reclaim. Beginners buy the breakout above range resistance — right into the upthrust — and sell the breakdown below support — right into the spring. The whole point of Wyckoff is that the edge of a range is a trap zone. Wait for the reclaim; trade back into the range, not out of it, until the SOS proves the move real.
9. Over-counting nested degrees. Labeling five timeframes at once produces conflicting numbers and paralysis. Count two degrees: your trade and its parent. That's it.
10. Treating every base as accumulation. Ranges break both ways. A "beautiful accumulation" that breaks down on expanding volume and keeps going was distribution, or was nothing. The spring and the volume are the evidence; the pretty box is only the hypothesis.
11. Mis-measuring the cause. Projecting a giant markup off a tiny three-bar range, or a tiny move off a three-month base. Effect is proportional to cause — size the target to the width and duration of the range, not to your hopes.
12. Ignoring alternation and getting shaken out. Expecting wave 4 to look like wave 2. If wave 2 was a sharp V, wave 4 will likely be a long, boring, sideways grind — and if you don't expect that, its tedium will chase you out of a good position right before wave 5.
FAQ
Which should I learn first, Elliott or Wyckoff? Wyckoff, for most people. Effort-vs-result and the spring/upthrust concept are usable on any chart tomorrow, require no controversial counting, and immediately improve your entries by keeping you from chasing the edge of ranges. Elliott's payoff is bigger but so is its rope-to-hang-yourself. Learn to read absorption and traps first, then add the wave map for trend context.
Do these work on all timeframes and all markets? Yes in principle — both are fractal and both describe crowd behavior, which is universal. But liquidity matters: the thinner and more manipulated the market (low-float stocks, some crypto), the more the spring/upthrust trap dynamics dominate and the less reliable clean impulse counts become. In deep, liquid instruments (index futures like NQ, major FX) both read more cleanly.
Is Elliott Wave just hindsight nonsense? Used as prediction, largely yes — that's the fair criticism. Used as invalidation-defined context, no. The three rules give you hard kill prices, and the fib relationships give you defined R/R. The difference between astrology and a tool is whether it can be proven wrong before the fact. Elliott can — if you let it.
How do I know if a spring is real or if support just broke? Speed and volume of the reclaim. A real spring recovers back inside the range quickly, often on a volume expansion, and doesn't revisit the low with force. If price breaks support and stays below on rising volume, or keeps making lower lows, it wasn't a spring — it was a breakdown. When unsure, wait for the low-volume test; a real spring gives you a second, safer entry.
Can Elliott and Wyckoff ever disagree, and what do I do then? Yes — e.g. Elliott says "impulse up in progress" while Wyckoff shows distribution (upthrusts, absorption on rallies). Disagreement is information: it usually means you're at a transition and the structure isn't resolved. Stand down. The trades to size into are the ones where both frameworks and your EMA bias tell one story.
What's the fastest way to get value from these without mastering them? Two things. From Wyckoff: stop chasing breakouts at range edges — wait for the reclaim. From Elliott: never buy a new high that's made on weaker momentum than the previous high. Those two habits alone will save more money than a year of counting waves perfectly.
How does options positioning (GEX, call/put walls) interact with these reads? Powerfully, because gamma walls often are the range boundaries the Composite Operator works. A put wall frequently acts as spring support (dealers buy there, price reclaims); a call wall frequently acts as upthrust resistance (price pokes through, fails, falls back). When a Wyckoff spring lines up with a large put wall, or a wave-2 golden pocket sits on a high-gamma strike, you have mechanical flow confirming the crowd-psychology read. Read the walls as another confluence layer, never as a standalone reason.
The Cheat-Sheet
Elliott Wave — the skeleton
- 5 waves with trend (impulse) + 3 waves against (A-B-C correction). Fractal — repeats at every degree. Count two degrees max.
- Wave 1: disbelieved. Wave 2: deep pullback (0.5-0.786). Wave 3: longest/strongest, never shortest, momentum extreme. Wave 4: shallow rest (~0.382), alternates with W2. Wave 5: euphoria, often diverging.
- Corrections come in three flavors: zigzag (sharp/deep), flat (sideways/grinding, watch the expanded-flat trap), triangle (coiling, wave-4/B only).
- Three rules (unbreakable): ① Wave 2 can't retrace >100% of wave 1. ② Wave 3 not the shortest. ③ Wave 4 can't overlap wave 1. Each rule is also a stop-loss line.
- Fib map: W2 → 0.618 golden pocket; W3 → 1.618/2.618 of W1; W4 → 0.382 of W3; W5 → 1.0 × W1; C → 1.0 or 1.618 × A.
- Trade it: long the wave-2 golden pocket, stop below wave-1 start, target wave-3 at 1.618. Count = hypothesis with a kill price. Primary count + one alternate; let price choose.
Wyckoff — the mechanics
- Composite Operator accumulates from the discouraged crowd, marks up, distributes into euphoria, marks down. Ask "who needs whom here?"
- Three laws: supply/demand · cause & effect (range width & duration = move size) · effort vs. result (volume vs. price).
- Phases: A (stop the trend) → B (build cause) → C (spring/test) → D (SOS/LPS) → E (markup).
- Accumulation: PS → SC → AR → ST → Spring → Test → SOS → LPS → markup.
- Distribution: PSY → BC → AR → ST → UTAD → SOW → LPSY → markdown.
- Spring = false breakdown that reclaims (best long); graded #1 (deep/heavy, risky) to #3 (shallow/light, best). Upthrust = false breakout that fails (best short). Both trap the crowd.
- Effort vs result: high volume + no progress = absorption/reversal. New high on falling volume = exhaustion. Wide-range bar closing on its high on big volume = genuine SOS, not a trap (watch the close).
- Trade it: long the spring/test/LPS that holds, stop below spring low, target = range width & duration projected. Three entries, progressively confirmed and progressively worse price — pick by risk tolerance.
How they combine
- Macro/EMA 12/22/55 bias first — it vetoes any count or schematic that fights it.
- Wyckoff reads ranges; Elliott reads trends. Spring → SOS often becomes Elliott wave 1. That hand-off is the key integration.
- Multi-timeframe: HTF = bias, trading TF = setup, entry TF = trigger. Nesting agrees → size up; conflicts → stand down.
- Confluence partners: 22/55-EMA (dynamic level + bias veto), volume profile POC (LPS confirmation), RSI/MACD divergence (wave-5 / upthrust exhaustion), options walls (mechanical range edges).
- Best trade = golden pocket + rising EMA + Wyckoff LPS + absorption volume + HTF bias, all at one price.
- Framework defines invalidation → invalidation is your risk → demand 1:3 or pass.
- Both are context, not gospel. They tell you where you probably are, never what will certainly happen.
The crowd leaves the same footprints over and over because human nature doesn't update. Elliott named the emotional arc; Wyckoff named the hands working against it. Learn to see both and you stop reacting to price and start reading the story behind it — knowing that even the best story is a hypothesis, sized to be survivable when it's wrong. That's the entire edge: not predicting the crowd, but positioning against it with rules that keep you alive when you misread.
Bound by rules, feared by trade.