
Most traders meet Ichimoku, recoil at the tangle of lines and the shaded blob floating over price, and close the tab. That reaction is understandable and completely backward. The whole point of Ichimoku Kinko Hyo — Japanese for "one glance equilibrium chart" — is that once you learn to read it, you get trend direction, momentum, support, resistance, and a forward-looking bias from a single look. No flipping between four panels. No stacking eight indicators that all say the same thing with a lag. One system, one glance, one decision.
Goichi Hosoda, a Japanese journalist writing under the pen name Ichimoku Sanjin, spent decades and a team of assistants building this in the 1930s and only published the complete method in 1969. It was designed to be complete on its own — a full trading framework, not a single indicator you bolt onto a pile of others. That is exactly why it fits the Hollow Point process: it is a top-down, trend-first, confluence-in-one-picture tool. This guide takes you from "what are those lines" to "here's my entry, my stop, my target, and my bias" — usable Monday, and deep enough to still be teaching you six months from now.
We are going to go all the way. The five lines and their exact math. The reading order and why weight matters. Worked longs, worked shorts, and the most important trade nobody teaches — the worked no-trade. How the cloud behaves in a rip-roaring trend versus a dead range versus a high-volatility news day, because the same lines mean different things in different weather. Multi-timeframe stacking. Confluence with EMAs, volume profile, and RSI. A long list of the specific mistakes that quietly bleed accounts. How the professionals use it in a way that would surprise a beginner. A FAQ. And a one-card cheat-sheet at the end you can screenshot and keep.

The Concept: Equilibrium, Not Prediction
Before a single formula, understand the philosophy, because it changes how you use every line.
Ichimoku is built on equilibrium. Every component is some version of a midpoint — the average of a high and a low over a lookback window. Not a moving average of closing prices like your EMAs. A midpoint of the range. Hosoda's logic: the fairest measure of where an asset "belongs" over a period is the middle of everything it traded, not just where it happened to close. A close is one instant. A range is the whole battle. The midpoint of the battle is the truce line — the price at which, over that window, buyers and sellers were in balance.
That single design choice gives Ichimoku two superpowers. First, midpoints act like magnets and like walls at the same time — price is constantly pulled back toward equilibrium and rejected at it, which is why these lines make such clean support and resistance. When price gets far from equilibrium, it tends to snap back; when it reaches equilibrium from the wrong side, it tends to bounce. Second, because the system projects some of those midpoints into the future and drags one into the past, you get a read on where equilibrium is heading, not just where it sat today.
So Ichimoku does not predict price. It maps equilibrium — current, past, and future-projected — and lets you position with the side that owns it. That is the HPT ethos in a Japanese wrapper: discipline over prediction, trend over guessing. You are not forecasting a number. You are answering a simpler, more honest question: which side currently owns equilibrium, and is that ownership strengthening or weakening?
Why a range midpoint beats a closing average
Picture a bar that opens at 100, spikes to 110 on a news pop, gets sold hard to 92, and closes at 101. A closing-price moving average sees "101" and shrugs — barely moved from the open. The Ichimoku midpoint of that bar's range sees (110 + 92) / 2 = 101 as well on that single bar, but over a nine-bar window it captures the extremes of the fight, not just the settling points. In a market that is whipping — long upper and lower wicks, closes clustered in the middle — the range midpoint stays anchored to the true center of the auction while a closing average gets yanked around by wherever the bar happened to stop. That stability is why Ichimoku lines go flat and calm in chop instead of chattering, and it is the first thing that makes the cloud a better regime filter than a stack of EMAs.

The Mechanism: Five Lines, One Formula Family
Here is the entire system. Learn these five and you never have to look up Ichimoku again. The default settings are 9, 26, 52 — do not change them until you deeply understand why, and we will spend real time on that in the Mistakes section.
1. Tenkan-sen — the Conversion Line (9)
Formula: (9-period high + 9-period low) ÷ 2.
The Tenkan is the fast line. It measures short-term equilibrium — the midpoint of the last nine bars' entire range, high to low. It is the closest thing Ichimoku has to a fast moving average, but because it uses the range midpoint it behaves differently in one crucial way: it goes flat the instant a new bar fails to make a new 9-bar high or low. That flatness is a feature, not a bug. A flat Tenkan is the line telling you, out loud, that there is no fresh short-term momentum — price is churning inside a range it already established. A rising, stair-stepping Tenkan means every few bars price is printing a new local extreme; that is short-term trend. Traditionally drawn in blue (or sometimes red, depending on platform).
A quick worked value: say the last nine bars on a stock had a highest high of $52.40 and a lowest low of $50.60. Tenkan = (52.40 + 50.60) / 2 = $51.50. If the next bar prints a new high of $52.90 but the low of the window is still $50.60, Tenkan jumps to (52.90 + 50.60) / 2 = $51.75. If instead the next bar stays entirely inside $50.60–$52.40, the Tenkan does not move at all. That is the "flat = no new extreme" behavior in action.
2. Kijun-sen — the Base Line (26)
Formula: (26-period high + 26-period low) ÷ 2.
The Kijun is the anchor. Twenty-six bars of range, halved. This is the medium-term equilibrium and it is the single most useful line in the whole system for trade management. A rising Kijun means the medium-term center of gravity is climbing — trend is up and structurally intact. Price tends to snap back to the Kijun the way a rubber band snaps back to rest, which makes the Kijun a magnet for pullbacks and a natural, defensible place to hide a stop. Think of the Kijun as Ichimoku's trend spine: as long as price holds above a rising Kijun, the medium-term uptrend is alive, and the day it decisively loses the Kijun, something has changed.
The Kijun's flatness matters too, and in a specific way. When the Kijun goes dead flat for many bars, it marks a price level where the 26-bar high and low have not changed — a genuine equilibrium shelf. Those flat Kijun levels act like strong horizontal support and resistance, and price is drawn to them. A long flat Kijun at, say, $145 is effectively the market announcing "$145 is the fair value everyone agrees on right now," and price will keep gravitating back to it until one side wins.

3 & 4. Senkou Span A & B — the Kumo (Cloud)
This is the famous part. Two lines projected 26 periods into the future, and the shaded area between them is the Kumo, or cloud.
Senkou Span A (Leading Span A): (Tenkan + Kijun) ÷ 2, plotted 26 bars ahead. It is the midpoint of the two fast lines, thrown forward. Because it is built from the two responsive lines, Span A is the faster, more reactive edge of the cloud — it turns sooner.
Senkou Span B (Leading Span B): (52-period high + 52-period low) ÷ 2, plotted 26 bars ahead. The slowest line in the system — on a daily chart that is roughly half a year of range, halved, and thrown forward. Span B is molasses. It goes flat and stays flat for long stretches, and those long flat Span B levels are the single strongest horizontal support/resistance the whole indicator produces. When price approaches a flat Span B, expect a real fight there.
The space between Span A and Span B is the cloud. When A is above B, the cloud is bullish (usually shaded green). When B is above A, the cloud is bearish (usually red). The cloud is the heart of Ichimoku: it is your dynamic support/resistance zone and your forward bias, both at once. And because it is projected 26 bars ahead, the right edge of your chart shows you the future cloud — the terrain price is walking into before price gets there. No other mainstream tool draws you a map of the ground ahead.
A worked value ties it together. Suppose Tenkan = $51.50 and Kijun = $50.90 today. Span A = (51.50 + 50.90) / 2 = $51.20, plotted 26 bars to the right. Meanwhile the 52-bar high is $54.00 and the 52-bar low is $47.00, so Span B = (54.00 + 47.00) / 2 = $50.50, also plotted 26 bars right. Span A ($51.20) is above Span B ($50.50), so the cloud 26 bars ahead is green, and it is $0.70 thick at that point — thin, sliceable. If those two edges were $53 and $48, the cloud would be $5 thick — a fortress.

5. Chikou Span — the Lagging Span (26 back)
Formula: the current close, plotted 26 periods into the past.
This one confuses everyone because it feels backward. It is just today's close shifted left by 26 bars. Its job is confirmation with zero clutter: it lets you compare today's price directly against the price action of a month ago without any math or memory. If the Chikou is floating cleanly above the candles from 26 bars ago, then today's price is higher than everything that traded back then — buyers are firmly in control versus a month back, and there is no old supply directly overhead. If the Chikou is tangled inside a cluster of old candles, the market is congested, there is memory of two-sided fighting at this level, and any fresh signal from the other four lines is suspect.
The Chikou is the veto line. It does not initiate trades — it confirms or quietly kills setups the other four lines seem to like. A perfect-looking bullish TK cross above a green cloud is a very different trade when the Chikou has clean air above it (take it) versus when the Chikou is about to plow into a wall of old candles at the same level (wait — you are buying straight into overhead supply the chart is warning you about).

Five lines. Every one is a range midpoint. Three of them are time-shifted — two forward, one back. That time-shifting is the genius: Ichimoku is the only mainstream system that shows you past, present, and projected-future equilibrium in one frame, and every edge you get from it flows from that one idea.
How to Read It: The Signals, Stacked by Weight
You do not read all five lines equally at once. You read them in a hierarchy, from slowest and heaviest to fastest and lightest. This is the same timeframe-weighted logic HPT applies everywhere — the big, slow structure sets the bias; the small, fast lines time the entry. Reading them out of order is how people talk themselves into counter-trend trades that the heavy signals already forbade.
Signal 1 (heaviest): Price vs. the Cloud — the Bias Filter
This is the master switch. Ask one question before anything else:
- Price above the cloud → bullish regime. You look for longs. The top of the cloud is support beneath you.
- Price below the cloud → bearish regime. You look for shorts. The bottom of the cloud is resistance above you.
- Price inside the cloud → no-man's-land. Equilibrium is contested. This is chop. The disciplined move is usually no trade — you wait for price to break out one side and close there.
Ninety percent of Ichimoku's edge is respecting that third rule. Price inside the Kumo is the market telling you, honestly, that it does not know either. It is inside the zone between fast equilibrium and slow equilibrium — the exact band where the auction is unresolved. HPT sits those out. Not because a trade inside the cloud can never work, but because your expectancy inside the cloud is garbage: whipsaws, false crosses, and stops picked off in both directions.

Signal 2: Cloud Color and Thickness — the Terrain Ahead
Now look at the future cloud on the right edge of the chart — the part projected past current price.
Color tells you the projected bias. A green future cloud (Span A over B) says the medium-term equilibrium is tilting up; red says down. A cloud that is about to flip color — the point where Span A crosses Span B, called a Kumo twist — is an early warning that the regime is changing. Because the twist is plotted 26 bars ahead, you can often see it coming before price does; it is frequently the earliest signal Ichimoku gives, and a twist that lines up with price breaking out of the current cloud is a high-quality regime-change tell.
Thickness tells you how strong the support/resistance will be. A thick cloud is a fortress — price struggles to punch through it, and if it is below you it is a deep safety net that can absorb a nasty pullback without breaking your regime. A thin cloud is tissue paper — easily sliced. That cuts two ways: breakouts through thin cloud are higher-probability because there is little to stop them, while reversals near thin cloud are more dangerous because a thin cloud offers no real support to lean on.
Practical read: you want to be long into a thick green cloud below price and cautious about longs running up into a thick red cloud above. A short into a thick red cloud above price as resistance, with thin cloud below as easy downside, is the mirror A-setup.

Signal 3: The TK Cross — the Trigger
The Tenkan/Kijun cross is Ichimoku's entry trigger, and its quality depends entirely on where it happens relative to the cloud.
- Tenkan crosses above Kijun = bullish TK cross.
- Tenkan crosses below Kijun = bearish TK cross.
But not all crosses are equal. Grade them by location, every single time:
- Strong bullish cross: happens above the cloud. Trend and trigger agree. This is your A-setup.
- Neutral cross: happens inside the cloud. Weak — the regime is undecided. Mostly ignore.
- Weak bullish cross: happens below the cloud. This is counter-trend — you are trying to catch a falling knife against a bearish regime. Only for experienced counter-trend scalpers, and even then, small and fast.
Same logic mirrored for shorts. A bearish TK cross below the cloud is your A-grade short; below-cloud strong, inside-cloud weak, above-cloud counter-trend. There is a second dimension to grade too: the angle and separation of the cross. A TK cross where the Tenkan slices up through a flat Kijun at a steep angle and then the two lines fan apart is far stronger than a limp cross where both lines are flat and barely kiss. Steep, separating, above-cloud — that is the cross you want.
Signal 4: The Chikou Confirmation — the Veto
Before you take that TK cross, glance at the Chikou. For a long, you want the Chikou span to be in open space — above the candles from 26 bars ago, not buried in them. If the Chikou is clear, the path has no immediate overhead memory of sellers; the trade breathes. If the Chikou is jammed into a cluster of old candles, there is resistance in the recent structure and your breakout is likely to stall right where those old bodies sit. Run the same check for shorts, inverted: you want the Chikou in clean air below the old candles.
There is a subtle, powerful use most people miss: the Chikou crossing price 26 bars ago is itself a signal. When the Chikou span crosses up through the price candles it is sitting among, that is momentum confirming a turn — and if it happens to coincide with a TK cross and a cloud breakout, you have three independent confirmations firing at once. The Chikou does not initiate. It confirms or vetoes. Two seconds of looking, and it will keep you out of more bad breakouts than any other single check.
Signal 5: The Kijun Bounce — the Pullback Entry
Inside an established trend, you often do not get a fresh TK cross — you get a pullback. In an uptrend (price above cloud, everything stacked bullish), price will repeatedly fall back to the Kijun and bounce off it. That Kijun tag is a high-quality continuation entry with a tight, obvious stop: just below the Kijun. This is the bread-and-butter Ichimoku trade in a running trend, and it maps perfectly onto HPT's 1:3 R/R math because the stop is so close (right under the line price is bouncing off) and the trend target is so far (the trend is already established and running). You will take more Kijun-bounce entries over a career than fresh TK crosses, because most of a trend is pullbacks, not fresh breakouts.
Putting It Together: A Worked Long
Let's run a full setup the way you'd run it live. Numbers are illustrative to teach the mechanics.
Say a large-cap tech name has been basing and now:
- Regime: Price at $148 has broken up and is trading above a green cloud whose top (Span A) sits at $142. Bias: bullish. Longs only. ✓
- Terrain: The future cloud on the right edge is green and thickening — Span A pulling away above Span B, projected support building beneath price. Strong tailwind. ✓
- Trigger: Two bars ago the Tenkan crossed above the Kijun at $145, steeply, and the cross happened above the cloud. A-grade bullish TK cross. ✓
- Confirmation: The Chikou span is floating in clean air well above the candles from 26 bars back. No overhead memory. ✓
- Entry mechanics: Price pulls back to the Kijun at $145 and prints a bullish reversal candle (a hammer or bullish engulfing on the tag). You enter $146 on the confirmation.
- Stop: Just under the Kijun and cloud top — say $141.50, below the cloud, so a close there breaks the entire bullish regime, not just the trade. Risk ≈ $4.50.
- Target: 1:3 R/R → $146 + ($4.50 × 3) = $159.50. The rising cloud and Kijun trail beneath you as the trade works; you manage the exit off the Tenkan (aggressive — you exit the first time price closes below the fast line) or off the Kijun (patient — you hold until price closes below the spine).
Every box checked, in order of weight, before a dollar was committed. That is the entire discipline: regime → terrain → trigger → confirmation → mechanics. If any of the top three fail, there is no trade, no matter how pretty the entry candle looks.
The same setup, one detail worse
Now change one thing. Everything above holds — except the Chikou span is not in clean air; it is buried in a cluster of old candles from a sideways patch 26 bars ago, sitting right around $147. That means there is remembered supply directly overhead: the last time price was here, it churned and sellers were active. The four "yes" signals now have a veto flag. The disciplined adjustment is not to cancel the trade outright but to demote it: smaller size, and either wait for price to close cleanly above that $147 old-supply shelf first, or accept that the first target is $147 (the veto level), not $159.50. One flag does not always kill a trade, but it changes the plan — and a trader who ignores it walks straight into a stall they were warned about.
A Worked Short — and a Worked No-Trade
Mirror the long exactly. Price is below a red cloud (bearish regime) with the cloud bottom (Span A, now the lower edge) at, say, $88 acting as resistance overhead. The future cloud is red and thick. The Tenkan crosses below the Kijun at $85, beneath the cloud — A-grade bearish cross. The Chikou is in open space below the old candles. Price rallies back up to tag the Kijun at $85, prints a bearish rejection candle (shooting star), and you short $84. Stop above the cloud bottom at $88.50 (a close above the cloud breaks the bearish regime). Risk ≈ $4.50. Target three-to-one down: $84 − ($4.50 × 3) = $70.50. Clean, and structurally identical to the long, just inverted.
Now the most important example nobody teaches: the no-trade. Price is inside the cloud at $103. The cloud is thin and about to twist — Span A and B are converging and will cross in a few bars. The Tenkan and Kijun are tangled and flat, kissing repeatedly without separating. The Chikou is buried in old candles. Four of five reads are screaming "I don't know." The correct Ichimoku read here is not a clever contrarian bet — it is stand down. The system is explicitly designed to keep you out of exactly this mush. The overwhelming majority of Ichimoku losses come from forcing trades in the cloud, chasing the little false crosses that flip every three bars. The best thing the system does for your account is give you permission, backed by a clear visual rule, to sit on your hands with a clean conscience. A no-trade you correctly identified is a winning decision. Log it as one.
The Full Confluence Read: All Five at Once
Once the individual signals are second nature, you read the whole board in one glance. Here is the checklist that turns five lines into a single conviction score. For a maximum-conviction long, you want:
- Price above the cloud ✓
- Cloud ahead is green (bullish future bias) ✓
- Tenkan above Kijun (fast trend up) ✓
- Bullish TK cross occurred above the cloud ✓
- Chikou span above both price and the cloud, in open space ✓
All five aligned is a rare, powerful, "back up the truck" configuration — and even then, sized by rules, not by feelings. Four of five is a solid trade. Three of five is a maybe that needs help from your other HPT tools before you commit. Two or fewer is a pass. Ichimoku hands you a built-in five-point confidence meter; use it as one, and be honest about how many boxes actually check. The trader who counts three and calls it five is the trader who wonders why "great setups" keep failing.
Ichimoku in Different Market Regimes
The same five lines mean different things in different weather. This is the section that separates people who have Ichimoku on their chart from people who can actually read it. The indicator does not change; the market's character changes, and your interpretation has to change with it.
In a strong trend — Ichimoku's home turf
This is what the system was built for, and it is close to unbeatable here. In a clean uptrend the lines stack and stay stacked: price on top, then Tenkan, then Kijun, then a rising green cloud beneath, with the Chikou floating in open air above everything. Pullbacks are shallow and get bought at the Tenkan (in a strong trend) or the Kijun (in a normal trend). You are not hunting for reversals; you are riding the trend and re-entering on every Kijun tag. The cloud thickens beneath you, giving you a deeper and deeper safety net. In this regime you trade with every signal and you let winners run using the Kijun as a trailing exit. The mistake here is exiting too early on noise — in a strong trend, respect the spine and stay in until it actually breaks.
In a range or chop — Ichimoku's weakness, and how to survive it
In a tight sideways market, the lines flatten, the Tenkan and Kijun coil around price and cross each other constantly, and the cloud goes thin and flat. Every TK cross whipsaws. This is where undisciplined Ichimoku traders donate their accounts one small loss at a time. The correct read is to recognize the flat-line state as a regime signal in itself: flat Tenkan + flat Kijun + thin flat cloud = the market is asleep, stand down. If you must trade a range, the only Ichimoku-consistent way is to fade the extremes back toward a flat Kijun (which acts as the range's center of gravity) — but understand you are now using the tool against its grain, and size accordingly. The better move is to wait for the cloud to tilt and thicken and for price to break and close outside it. Ichimoku's first job in a range is to keep you out.
In high volatility — news days, gaps, and expansion
On a high-volatility day the range midpoints jump. A single wide bar can drag the Tenkan several percent because the 9-bar high or low just reset hard. Gaps do the same. Two adjustments matter. First, the cloud edges — especially a flat Span B — become even more important as magnets and battle lines, because in fast markets price hunts liquidity at exactly those well-watched levels. Second, your stops need to respect the expanded range: a stop tucked one tick under the Kijun that was fine in a calm tape will get wicked out in a volatile one, so either widen the stop to below the cloud (and shrink size to keep risk constant) or stand aside until the range normalizes. High volatility does not break Ichimoku; it just demands you lean on the heaviest, slowest edges (Span B, the cloud body) and distrust the fast, twitchy ones (Tenkan) until things settle.
Multi-Timeframe: Stacking the Clouds
Ichimoku's timeframe logic is the same weighting HPT applies everywhere, and it is where the system truly shines because you are running one indicator across every timeframe instead of a different tool at each level.
Run Ichimoku on the higher timeframe first to set the regime, then drop down to time the entry. On a name you're trading intraday, check the daily cloud for the master bias. Price above the daily cloud? You are hunting longs on the lower timeframes and treating shorts as scalps only. Then go to the 1-hour for the TK cross and Kijun-pullback entries. Then the 15- or 5-minute for the precise trigger candle. The daily cloud is your King bias; the intraday clouds are your execution. When the daily, hourly, and 15-minute clouds all point the same way, that is timeframe-weighted confluence in its purest form — and it is exactly the multi-timeframe agreement HPT already demands.
The powerful edge here is disagreement, because it warns you early. When the daily cloud is green (bullish) but the 1-hour has just slipped below its cloud, you are seeing a pullback inside a larger uptrend take shape — which is precisely when you get ready to buy the daily Kijun, not when you panic-sell. Conversely, when a lower-timeframe cloud flips against a strong higher-timeframe cloud repeatedly, it is a hint the big trend is tiring. The clouds nesting inside each other — daily containing the hourly containing the 5-minute — give you a fractal read on where you are in the trend at every scale, all from the same five lines.

A concrete example. Daily: price $410, well above a thick green daily cloud topping at $388 — strong bull regime, longs only. One-hour: price has pulled back and is sitting right on a rising 1H Kijun at $409, having just held above the 1H cloud. Five-minute: a bullish TK cross fires above the 5-minute cloud as price bounces off that shared level. You now have three timeframes agreeing at one price: a daily bull regime, an hourly spine holding, and a five-minute trigger. Entry $410.50, stop $407 (below the 1H Kijun and the 5-minute cloud), target 1:3 at $421. That is what stacked-cloud confluence looks like when it lines up — and you saw all of it by flipping through three timeframes of the same indicator, no chart-clutter required.
How Ichimoku Fits the Top-Down Process
Ichimoku is not a standalone religion — at HPT nothing is. It slots into the macro → sector → stock funnel as a bias and structure engine at every rung, and it plays beautifully with the tools you already run.
Ichimoku + the EMA 12/22/55 framework
The 12/22/55 EMA stack tells you trend via closing-price momentum; the Kijun and cloud tell you trend via range equilibrium. They are not redundant — they are a cross-check, two independent engines measuring trend two different ways. When the daily 55-EMA (your bias tell) and the daily cloud agree, conviction is high and you lean in. When they disagree — price above the cloud but below the 55-EMA, say — you have a market in transition, and the honest read is reduce size or wait. Two independent trend engines nodding together is worth more than either alone; two of them arguing is information too — it says "not yet." A specific high-value combo: the 55-EMA and the Kijun sitting at nearly the same price during a pullback creates a doubled-up support shelf that pullback entries love, because two different methods independently flagged the same level as the line that matters.
Ichimoku + volume profile
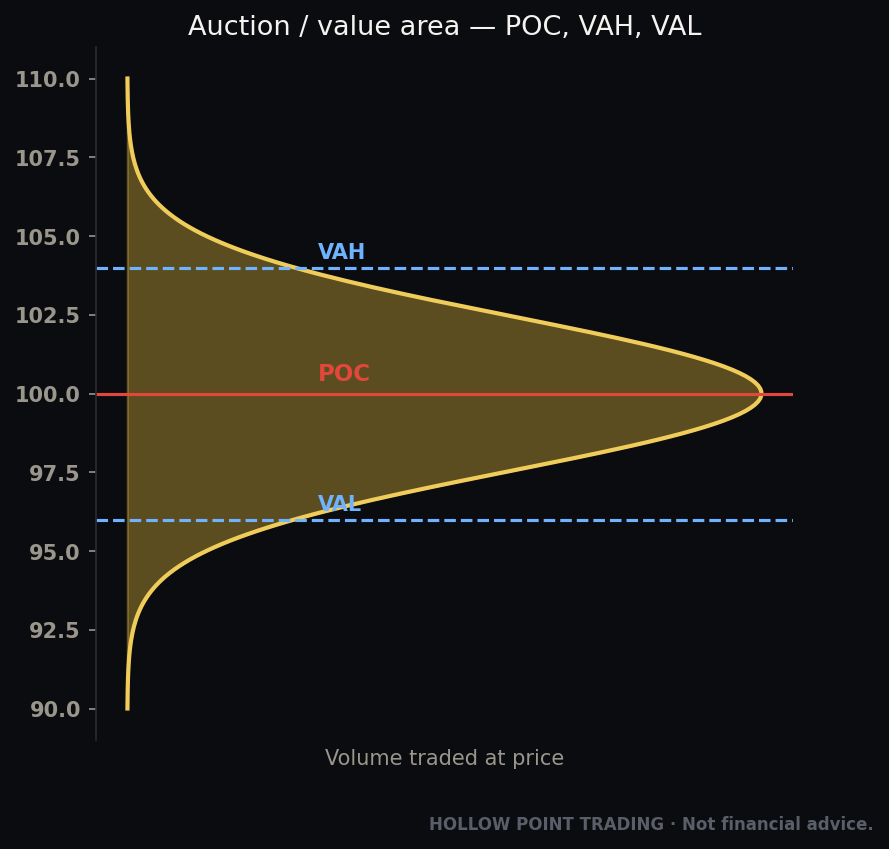
The cloud tells you where equilibrium is; the volume profile tells you how much was actually traded there. Their agreement is dynamite. When a flat Span B lines up with a volume-profile POC (point of control — the price with the most traded volume), you have two completely different tools pointing at the same wall: one says "medium-term equilibrium sits here," the other says "more shares changed hands here than anywhere else." Price will fight hard at that shared level. When they disagree — a thick cloud in a price zone that the volume profile shows as a low-volume gap — expect price to move fast through that zone, because there is cloud resistance but no real transacted supply to back it up. Use the profile to grade how much respect a cloud level actually deserves.
Ichimoku + RSI
RSI answers a question Ichimoku doesn't: is the current push overextended? Ichimoku will happily keep you long in a screaming uptrend; RSI at 82 with a bearish divergence into a thick red cloud overhead is the tap on the shoulder that says take some off. The cleanest combo trade is an RSI divergence firing exactly as price reaches a major cloud edge — momentum fading right at structural resistance. Ichimoku gives you the level and the regime; RSI gives you the fuel gauge. Neither alone is as good as both, and crucially, they are looking at genuinely different things, so their agreement is real confluence and not two indicators lagging the same price in slightly different colors.
R/R and discipline, baked in
Because the Kijun and cloud give you a structural stop location — not an arbitrary percentage but the actual line where the regime breaks — Ichimoku makes the 1:3 R/R calculation honest. Your stop is where the thesis dies (a close through the cloud), your target is three times that distance, and if the math doesn't clear 1:3 you don't take the trade. The indicator enforces the rule instead of fighting it. This is why Ichimoku fits HPT so well: it is not just a signal generator, it is a risk framework with the stop location built into the structure.
How the Pros Use It Differently From Beginners
Watch a beginner and a veteran run the same Ichimoku chart and you will see almost opposite behavior. The differences are worth stating plainly, because copying the veteran's habits is a shortcut past a year of tuition.
Beginners trade every TK cross. Pros trade almost none of them. A cross is a trigger, not a signal. The professional waits for the cross that is above the cloud, in an aligned regime, with the Chikou confirming — which is maybe one cross in ten. The other nine, they ignore. The edge is in the crosses you skip.
Beginners obsess over the fast lines; pros anchor to the slow ones. A newcomer stares at the Tenkan flicking around. A veteran barely looks at it — their eye goes to the cloud, the flat Span B levels, and the Kijun. The slow structure is where the money and the meaning are. The Tenkan is just for timing the last step.
Beginners see the cloud as a line to cross; pros see it as a zone to respect. To a beginner, price touching the cloud is a binary event. To a pro, the cloud is a field with a top, a bottom, a thickness, a color, and a twist coming — a piece of terrain with texture, not a threshold. They read how price behaves approaching it, whether the first touch gets rejected, whether the cloud is thick enough to lean on.
Beginners run all five lines forever; pros simplify. Many experienced Ichimoku traders trade off just the cloud and the Kijun (more on that below), having internalized the rest. They earned the right to simplify by first learning the full system, and now their chart is nearly empty and their reads are faster.
Beginners force the tool in every market; pros know when to holster it. The single biggest professional skill is recognizing the flat, coiled, in-cloud state and simply not trading Ichimoku signals until the regime declares itself. Beginners think a trading indicator is for trading. Pros know a great trading indicator is at least half about staying out.
Beginners curve-fit the settings; pros leave them at 9/26/52. The veteran understands the defaults are not just Hosoda's math — they are the settings the entire market watches, which makes them self-fulfilling. They would rather trade the levels everyone else is watching than a "better" setting only they can see.
The Common Mistakes — Where Traders Blow It
Mistake 1: Trading inside the cloud. Said again because it is the big one. The cloud is a war zone; bias is undefined there by design. Waiting for a clean break and close out of the cloud is most of the discipline. If you take one thing from this entire guide: no trades in the Kumo.
Mistake 2: Taking the TK cross naked. A bullish TK cross below the cloud is not a buy signal — it is counter-trend bait. Always grade the cross by its location relative to the cloud, and demand steepness and separation. Above-cloud crosses in an above-cloud regime; below-cloud crosses in a below-cloud regime. Location is everything.
Mistake 3: Ignoring the Chikou. Beginners drop the lagging span because it "looks weird." It is the veto that keeps you out of setups where the recent structure is stuffed with sellers. Two seconds to check. Skip it and you'll take breakouts straight into invisible overhead supply the chart was warning you about.
Mistake 4: Changing the settings to curve-fit. 9/26/52 encode Hosoda's decades of work and — just as important — they are the settings everyone else watches, which makes them self-fulfilling support and resistance. Yes, the numbers date to a six-day trading week, and some traders test 7/22/44 or 20/60/120 for crypto's 24/7 tape. Fine — once you're fluent. Until then, changing settings to make a past trade "work" is fitting noise to history. Leave them.
Mistake 5: Using Ichimoku in a dead range. The system is a trend tool. In tight, sideways, low-volatility chop the lines flatten and every signal whipsaws. Flat Tenkan, flat Kijun, thin flat cloud = the market is asleep. Recognize the flat-line state and stand down.
Mistake 6: Chart clutter. Running Ichimoku plus five other indicators defeats the entire purpose — Ichimoku already is five indicators. Cloud, Bollinger Bands, three MAs, MACD, RSI, and a supertrend all fighting for the same pixels rebuilds the exact noise Ichimoku was invented to replace.
Mistake 7: Confusing a cloud touch with a cloud break. Price wicking into the cloud is not a regime change. A close beyond the far edge is. Beginners flip bias the instant a shadow pokes the cloud; the cloud is a zone, and price is allowed to test it and reject. Wait for the close, and ideally a follow-through bar, before you call the regime flipped.
Mistake 8: Fighting a flat Span B. The long flat stretches of Senkou Span B are the strongest S/R the indicator produces. Traders who short into a rising market right at a flat Span B (or buy into a falling one) are stepping in front of the heaviest line on the chart. Flat Span B is a level to trade toward and off of, not through, until price proves it can close beyond it.
Mistake 9: Ignoring the future cloud. The right edge of the chart — the projected cloud past price — is Ichimoku's unique gift, and beginners never look at it. Buying just below a thick red cloud that price is about to run into, or shorting into a thick green one, is walking into a wall you could see coming. Always check the terrain ahead.
Mistake 10: Over-trading the Tenkan. The Tenkan is a timing line, not a trade signal. People treat every price cross of the Tenkan as an entry and get chopped to pieces. Use it to fine-tune the last step of an already-validated setup, or as an aggressive trailing exit — not as a standalone trigger.
Mistake 11: Wrong timeframe for the account. Ichimoku's math is identical on a 1-minute and a monthly chart, but the noise is not. Beginners try to swing-trade off a 5-minute cloud and get shaken out constantly, or scalp off a daily cloud and hold through moves that were never meant for their timeframe. Match the timeframe to your holding period, and always sanity-check against the one above it.
Mistake 12: Treating four-of-five as five-of-five. Wishful counting. A setup with four boxes checked is a good trade sized as a good trade; it is not the rare all-five "back up the truck" configuration, and pretending it is leads to oversizing a merely-decent setup. Count honestly, size to the honest count.
Running It Without the Clutter
The single most common reason people quit Ichimoku is visual overwhelm. Fix it and the system becomes a joy to read. Three levels of de-cluttering — pick your comfort, and graduate through them as you gain fluency.
Level 1 — Learn on the full system. Keep all five lines while you build fluency. Use a clean color scheme: one color for the fast Tenkan, one for the anchor Kijun, a soft green/red fill for the cloud, and a muted tone for the Chikou so it doesn't dominate. Turn off every other indicator on the chart. Let Ichimoku be the only voice for a few weeks. You cannot simplify what you have not first learned in full — Level 1 is where the reflexes get built.
Level 2 — Cloud-and-Kijun only. Once the regime logic is automatic, many pros hide the Tenkan and Chikou and trade off just the cloud (bias + support/resistance) and the Kijun (trend spine + pullback entries + stop location). This is a remarkably clean, powerful two-line system and it's where a lot of experienced Ichimoku traders live day to day. You lose the trigger precision of the TK cross but gain a chart you can read in half a second, and you make up the trigger with a simple price-action candle at the Kijun.
Level 3 — Cloud only, as a bias overlay. The most minimal use: keep only the Kumo on your normal chart as a background bias filter, and do your actual entry work with your existing HPT tools. Green cloud below = longs allowed; red cloud above = shorts allowed; in the cloud = careful. Ichimoku becomes a silent regime gate behind everything else you do — a single, glanceable "which way am I allowed to lean" filter that costs you almost no chart real estate.
There is no prize for using all five lines forever. The prize is a chart you can read at a glance — which is, after all, the literal translation of the name. Start full, simplify as you gain fluency, and land on the version that lets you decide in one look.
Frequently Asked Questions
Does Ichimoku work on all markets and timeframes? The math works on anything with a high, low, and close — stocks, futures, forex, crypto, any timeframe. But it works best on liquid, trending instruments where the range-midpoint logic has clean data to chew on. It struggles on thin, gappy, illiquid names and in dead ranges regardless of the market. On a monthly chart it defines multi-year regimes; on a 1-minute it defines the next twenty minutes. Same lines, different holding period.
Is Ichimoku a lagging indicator? Partly, like everything built on past prices — but less than most, and in a smarter way. The Chikou is deliberately lagging (that's its job — clean comparison to the past). The cloud is deliberately leading, projected 26 bars into the future. So the system has a lagging component, a present component, and a leading component on the same chart. Calling it "lagging" misses that it's the only common tool that draws you the ground ahead of price.
Should I use the TK cross or the Kijun bounce as my entry? Both, in different situations. Use the TK cross to enter a fresh trend just breaking out above/below the cloud. Use the Kijun bounce to re-enter or add to a trend that's already running and is now pulling back. Over a full trend you'll take one cross and several bounces.
What settings should I use for crypto or 24/7 markets? Start with the standard 9/26/52 even on crypto — the defaults are what the market watches, which is half their power. Only after you're genuinely fluent should you experiment with 24/7-adjusted numbers like 10/30/60 or 20/60/120, and even then, know that you're trading levels fewer other participants see. For most traders, most of the time: leave the defaults alone.
Can I trade Ichimoku completely mechanically? You can automate the five-point checklist, and it will keep you disciplined. But the highest-value reads — cloud thickness, twist timing, how price behaves on a cloud touch, whether a Chikou is truly clear — carry judgment a rigid rule set flattens. Use the checklist as a floor for discipline, not a ceiling on your reading.
How is Ichimoku different from just using moving averages? Moving averages average closing prices; Ichimoku averages the range (high + low)/2. That makes Ichimoku steadier in whippy conditions and gives it clean flat-line S/R levels MAs don't produce. Add the future-projected cloud and the lagging span and you have three time dimensions no MA stack offers. They're cousins, not twins.
What's the single most important line? For trade management, the Kijun — it's the trend spine, the pullback magnet, and the natural stop location. For bias, the cloud. If you could keep only two lines, keep those two (that's Level 2 above).
The Cheat-Sheet
Screenshot this. It's the whole system on one card.
THE FIVE LINES
- Tenkan (9): fast equilibrium. (9-bar high + low)/2. Short-term trend, entry timing. Flat = no new extreme.
- Kijun (26): anchor equilibrium. (26-bar high + low)/2. Trend spine, pullback magnet, stop location. Flat = strong S/R shelf.
- Senkou A: (Tenkan + Kijun)/2, shifted +26. Faster, reactive cloud edge.
- Senkou B (52): (52-bar high + low)/2, shifted +26. Slower cloud edge; long flat = strongest S/R. A vs B = cloud = bias + S/R.
- Chikou (26 back): close shifted −26. Confirmation/veto line; wants open space.
READ IN THIS ORDER (heaviest first)
- Price vs cloud → regime. Above = longs, below = shorts, inside = NO TRADE.
- Future cloud color + thickness + twist → projected bias, how strong the S/R, and regime-change warning.
- TK cross graded by location + angle → above-cloud, steep, separating bull cross = A-grade; below-cloud = trap.
- Chikou in open space? → confirm or veto.
- Kijun pullback → the continuation entry inside a trend.
MAX-CONVICTION LONG (mirror for short) Price above cloud • cloud ahead green • Tenkan > Kijun • bull TK cross above cloud • Chikou above price in clear air. All five = load up (by rules). Four = solid trade. Three = needs other tools. Two = pass.
MECHANICS
- Entry: TK cross above cloud, or bounce off rising Kijun with a confirming candle.
- Stop: below the Kijun / below the cloud (the regime-break level, not an arbitrary %).
- Target: 1:3 R/R off that structural stop, or no trade.
- Trail: aggressive off Tenkan, patient off Kijun.
REGIME NOTES
- Strong trend → trade every signal, ride the Kijun, don't exit on noise.
- Range/chop → flat lines = stand down; fade extremes to flat Kijun only if you must.
- High vol → lean on flat Span B + cloud body; widen stops (shrink size); distrust the Tenkan.
CONFLUENCE
- EMA 12/22/55 agrees with cloud = conviction; disagrees = wait. Kijun + 55-EMA same price = doubled shelf.
- Flat Span B + volume POC = wall. Thick cloud over low-volume gap = fast move through.
- RSI divergence at a major cloud edge = take some off.
DON'T Trade in the cloud • take naked TK crosses • ignore the Chikou • curve-fit settings • trade a flat dead range • bury it under other indicators • confuse a cloud touch with a close-through • fight a flat Span B • skip the future cloud • over-trade the Tenkan • miscount four as five.
FIT THE FUNNEL Daily cloud = King bias → 1H cloud = setup → 15/5m = trigger. Nest the clouds; agreement across timeframes = conviction, disagreement = an early warning to read, not ignore.
Ichimoku rewards the exact temperament HPT is built on: patience for the regime to declare itself, respect for the levels the market actually watches, a structural stop where the thesis genuinely breaks, and the discipline to sit out the cloud when the market itself doesn't know. Learn the five lines, read them in order of weight, know which weather you're in, simplify as you gain fluency, and you'll have a trend system that tells you where you stand — past, present, and projected — in a single glance. Then trade the plan, not the noise.
Bound by rules, feared by trade.