
Most traders watch the VIX the way they watch the weather: they glance at the number, mutter "vol's high" or "vol's low," and move on. That's not reading it. That's noticing it. Noticing is what a passenger does. Reading is what the person in the driver's seat does — and this guide is about getting you into the seat.
The VIX is one of the most information-dense numbers on your screen. It tells you what options traders are collectively paying to hedge the S&P 500 over the next month. It tells you whether the crowd is asleep or panicking. And its structure — the shape of the futures curve, the vol-of-vol, the rank versus its own history, the way it moves relative to price — tells you things about the tape that price alone will never reveal. Learn to read all of it and you stop reacting to fear. You start pricing it, sizing to it, and occasionally selling it back to the people who are drowning in it.
This is the complete guide, and it is deliberately exhaustive. We'll build it from the ground up: what the VIX actually is, how it's calculated, how the term structure works and why its slope is a mechanical force and not just a mood, why the volatility ETFs everyone gambles on are mathematically designed to bleed, how the second-order gauges like VVIX front-run the first-order ones, how to tell whether vol is actually high with IV rank, and — most important for Hollow Point Trading — how volatility regimes rewrite the rules of every single trade you take, whether or not you ever touch a VIX product in your life. By the time you finish this, you'll read the vol complex like a second chart running underneath your first one.
The Concept: What the VIX Actually Is
The VIX is the ticker symbol for the Cboe Volatility Index. In one sentence: it's the market's estimate of how much the S&P 500 will move over the next 30 days, expressed as an annualized percentage.
That's it. It is not a price. It's not directional. It doesn't tell you up or down. It tells you how much — the expected magnitude of the swing, in either direction. A VIX of 20 says nothing about whether stocks go up or down next month. It says the options market expects a certain size of move, and it is silent on the sign of that move. This is the first mental rewiring most people need: strip the word "fear" of its directional baggage. Fear, in VIX terms, is symmetrical. It is a measure of expected turbulence, not expected loss.
Implied Versus Historical Volatility
Here's the crucial distinction that trips up beginners: the VIX is derived from implied volatility, not historical volatility. Two entirely different animals.
- Historical (realized) volatility is backward-looking. It measures how much SPX actually moved over some past window — the standard deviation of its recent returns. It's a fact. It already happened. You can compute it exactly.
- Implied volatility (IV) is forward-looking. It's baked into the prices people are paying right now for SPX options. When traders get nervous, they bid up the price of options — especially puts, for protection. Higher option prices mathematically imply a larger expected move, because an option is only worth more if the underlying is expected to travel farther. The VIX reads that expectation straight out of the SPX options chain.
So when you hear "the VIX is the fear gauge," what's literally happening is: frightened money is paying up for downside protection, that demand inflates option premiums, and the VIX formula translates those premiums into a single annualized volatility number. Fear has a price, and the VIX is the receipt.
There's a subtle but tradeable relationship between the two. Implied vol usually sits above realized vol — the market charges a premium for uncertainty, the same way an insurer charges more than the statistically expected payout. That gap, the volatility risk premium, is the structural reason premium-selling strategies have a long-run edge. When implied vol collapses below realized vol, something unusual is happening: the market is complacent about turbulence that's actually occurring, and that gap tends to close violently.
How the Number Is Actually Built
You don't need to compute the VIX by hand, but you should know what's under the hood, because it explains the quirks. The VIX isn't pulled from a single at-the-money option. It's a weighted blend of a wide strip of out-of-the-money SPX puts and calls across the two nearest expirations that bracket 30 days, interpolated to a constant 30-day horizon. It sums the prices of all those options, weights them, and expresses the whole thing as a single 30-day annualized volatility.
Two consequences follow directly. First, because it uses a broad strip of OTM strikes — not just the money — the VIX captures the tails. When traders bid up far-out-of-the-money puts (crash insurance), the VIX rises even if at-the-money vol barely moves. That's why the VIX is so sensitive to demand for downside protection specifically. Second, because deep OTM puts are almost always more expensive than equidistant OTM calls (the skew — people fear crashes more than melt-ups), the VIX has a structural downside bias baked into its construction. It rises faster on the way down than on the way up. That's not a flaw; it's the honest reflection of how the crowd actually prices risk.
Reading and Converting the Number
The VIX is quoted in annualized percentage terms. A VIX of 16 means the options market expects SPX to move roughly 16% over the next year — but you almost never care about the year. You care about the day and the month. So convert it.
To get the expected move over a shorter period, divide the VIX by the square root of the number of periods in a year. This is the single most important piece of arithmetic in the whole complex. Volatility scales with the square root of time, not linearly. A month isn't 30 times a day's worth of vol; it's √30 times.
- Daily expected move: VIX ÷ √252 ≈ VIX ÷ 15.9 (252 trading days in a year). So a VIX of 16 implies a daily SPX move of about 1% (16 ÷ 16 ≈ 1.0%).
- Weekly (5-day) expected move: VIX ÷ √50 ≈ VIX ÷ 7.1. A VIX of 16 implies about a 2.25% weekly range.
- Monthly (30-day) expected move: VIX ÷ √12 ≈ VIX ÷ 3.46. A VIX of 16 implies a ~4.6% move over the month.
Memorize the daily one. VIX ÷ 16 ≈ today's expected 1-standard-deviation SPX move in percent. VIX 16 → 1% days. VIX 32 → 2% days. VIX 48 → 3% days. VIX 64 → 4% days. That single mental shortcut turns the VIX from a vague mood ring into a tradeable range forecast, and it's the first thing to internalize. Every morning, glance at the VIX, divide by sixteen, and you have the market's own honest guess at today's SPX range before the bell even rings.
What "One Standard Deviation" Actually Buys You
One standard deviation means there's roughly a 68% chance the actual move lands inside that band, and a 32% chance it breaks out of it — a one-in-three chance, which is not rare. So VIX 16 isn't a promise SPX moves exactly 1%. It's the market saying "two days out of three, we stay inside ±1%; one day out of three, we don't." Push it further and the bands get useful for framing risk:
- 1 standard deviation (VIX ÷ 16): ~68% of days land inside. The everyday range.
- 2 standard deviations (double it): ~95% of days land inside. A move beyond this is a genuinely notable day.
- 3 standard deviations (triple it): ~99.7% in a normal distribution — but here's the catch. Real markets have fat tails. Three- and four-sigma days happen far more often than the bell curve predicts. The 1987 crash was a move so many standard deviations out that under a normal distribution it shouldn't occur once in the life of the universe — and it happened on a Monday. This is exactly why the VIX construction weights the tails, and why you never treat the expected-move band as a hard wall. It's a fog line, not a guardrail.
Practically, use the band as a context frame, not a prediction. If SPX is up 0.4% at noon on a VIX-16 day, it's used less than half its expected daily range — plenty of room left in either direction. If it's up 1.8% on that same day, it has already blown through nearly two sigma, and the odds of a mean-reverting fade climb sharply. The expected move tells you where you are inside the day's statistical envelope.
The Mechanism: Term Structure, Futures, and the Products Built on Them
The spot VIX — the number on TV — is a calculated index. You cannot buy it. There is no basket of shares called "the VIX." This is the single most important fact in the whole complex, because everything you can trade is a derivative built on top of it, and every one of those derivatives carries a catch that the spot index does not.
VX Futures and the Term Structure
The tradeable foundation is VIX futures (ticker root VX). These are contracts betting on where the spot VIX will settle on a specific future expiration date. There's a September contract, an October contract, a November contract, and so on down the calendar, usually eight or nine listed months out.
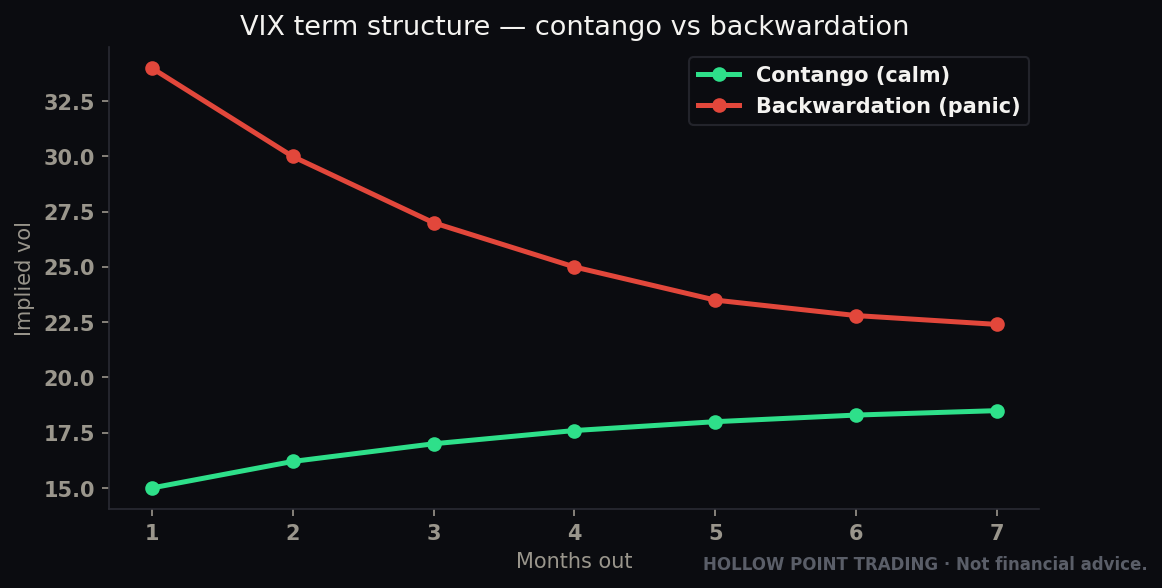
Because each month's contract prices in a different expectation, you get a term structure — a curve of VIX futures prices plotted against their expiration dates. The shape of that curve is one of the richest, least-watched signals in all of markets, and learning to read it separates people who understand vol from people who just watch a number.
Two shapes matter, and a couple of transitional states matter almost as much.
Contango (the normal state). The curve slopes upward — further-out months cost more than nearer months, and the front months cost more than spot VIX. This is the market's resting state, present maybe 75–85% of the time. Why? Because on any calm day, traders figure "vol is low now, but who knows what happens in three months — could be an election, an earnings season, a geopolitical shock, a Fed surprise." Uncertainty rises with time, so distant vol is priced higher. Contango means calm-to-normal conditions and a market that is not frightened about the immediate present.
Backwardation (the panic state). The curve slopes downward — spot VIX and the front month are priced higher than the back months. This happens when the market is in acute stress right now. The crowd is saying "it's on fire today, but this too shall pass — three months out, we'll have calmed down." Backwardation is comparatively rare and it is a genuine, high-conviction fear signal. When the curve inverts, something real is happening in the tape — not a wobble, a rupture. The deeper and steeper the inversion, the more acute the stress.

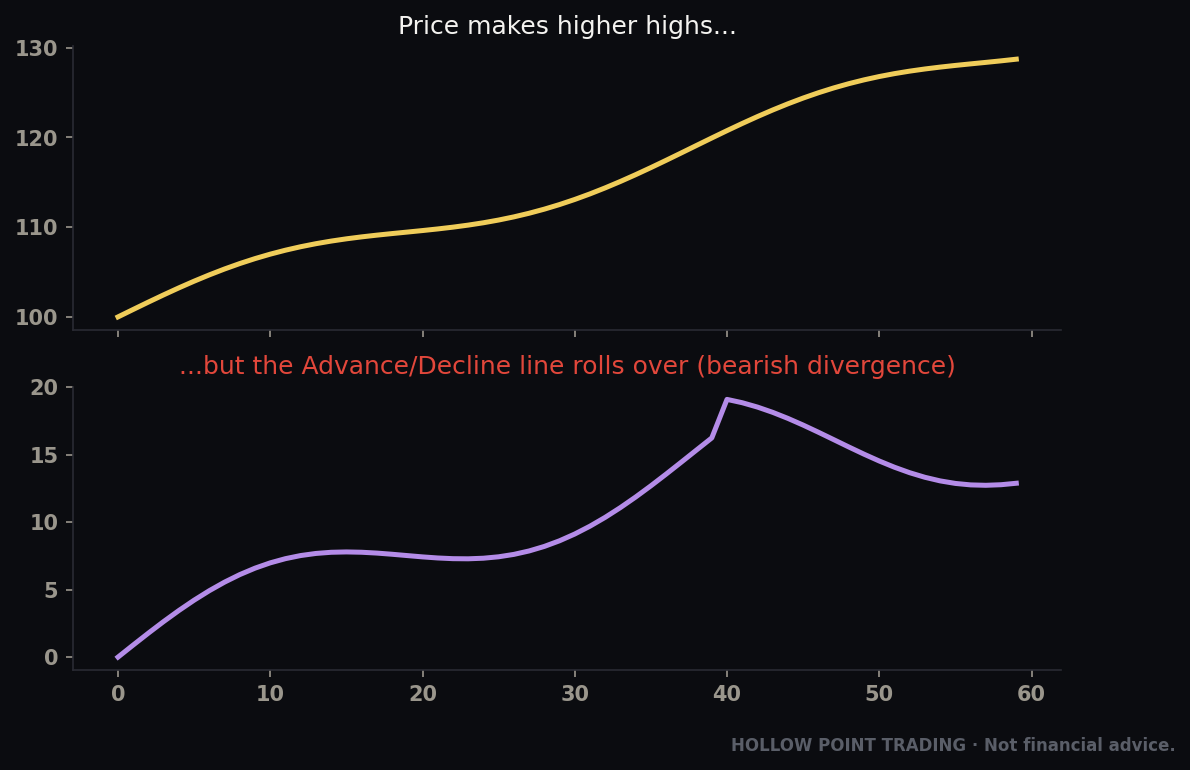
The flattening warning (the transition nobody watches). Between those two states is the tell that front-runs both. When the curve is normally steep in contango and then quietly flattens — the spread between front-month and back-month VX compresses even though spot VIX is still low — that is the term structure bracing itself. It's the curve's version of the VVIX divergence we'll get to below. Flattening contango in a calm tape is one of the earliest structural warnings that the resting state is under strain. You won't see it on the spot VIX at all. You have to look at the shape.
The M1/M2 ratio — a number you can actually track. You don't need to eyeball a curve. Divide the front-month VX by the second-month VX. In healthy contango that ratio sits below 1.0 (front cheaper than back) — often around 0.90–0.95. As it climbs toward 1.0, contango is flattening. When it crosses above 1.0, you've tipped into backwardation. Watching that single ratio drift over a week tells you which regime the plumbing is moving toward, days before the headline VIX confirms it.
Roll Yield and the Decay Trap
Here's why the curve's slope matters far beyond mood-reading: the slope creates a mechanical force called roll yield, and roll yield is the engine that drives — and destroys — the ETFs.
VIX futures don't last forever; each contract expires. A product that wants to maintain continuous VIX exposure has to constantly roll — sell the expiring near-month contract and buy the further-out one to hold its position. It never gets to just sit there.
In contango (the normal state), that roll is a loser by construction. The fund is perpetually selling a cheaper expiring contract and buying a more expensive later one — sell low, buy high, over and over, every single day, mechanically, forever. On top of that, as each futures contract approaches expiration, its price is pulled down toward the lower spot VIX — this is convergence. A long-vol product holding that contract eats the drift as the contract "rolls down the curve" toward spot. In steep contango, this bleed can run several percent a month, which compounds into staggering losses over a year.
The short-vol side is the mirror image: in contango, a fund short the front month collects that same roll as positive carry. It earns the bleed the long side pays. That's the whole engine of the short-vol trade — harvesting the structural premium the frightened long-vol holders keep paying.
This is the decay trap, and it is not a bug — it is the designed behavior of the math. Nobody is cheating you. The product is doing exactly what it says. The trap is entirely in the holder's misunderstanding of time.
The VIX ETPs — What You're Actually Buying
You can't trade VX futures in a normal brokerage account easily, and most retail traders shouldn't, so the industry packaged them into Exchange-Traded Products (ETPs). The famous ones:
- VXX — an ETN tracking a rolling position in short-term (roughly 30-day, blending front two months) VIX futures. Long volatility. Goes up when vol spikes, bleeds in contango.
- UVXY — a leveraged (1.5x) version of the same short-term futures exposure. Moves faster, bleeds faster, resets its leverage daily (which adds its own path-dependent decay in choppy tape).
- SVXY — short volatility (−0.5x since the 2018 blowup forced the leverage down). Profits when vol falls and contango does its thing. Suffers when vol spikes.
- VIXY, VIXM — other flavors; VIXY is short-term like VXX, VIXM is mid-term (4–7 month futures), which decays more slowly but also responds more sluggishly to spikes.
The brutal truth about the long-vol products (VXX, UVXY): they are long-run wealth incinerators. Because contango is the default state, these funds are rolling into the decay 75–85% of the time. VXX and its predecessor VXX-notes have executed multiple reverse splits just to keep the share price off the floor — a 1-for-4 here, a 1-for-5 there, decade after decade. If you'd bought and held UVXY for years, you'd have lost essentially everything, punctuated by brief, violent, seductive rallies during crashes that lure people into thinking they can hold it. The long-run chart of any leveraged long-vol product is a waterfall to zero with occasional geysers.
The daily-leverage decay on top. UVXY carries a second, sneakier drag: because it resets to 1.5x exposure every day, it suffers volatility drag in choppy conditions even when the underlying VX futures go nowhere net. If the futures drop 10% one day and rise 11% the next (roughly round-trip), the daily-reset product does not round-trip — it lands lower, because the gain is applied to a shrunken base. Sideways-but-violent tape grinds leveraged ETPs down independent of the roll. This is why they're strictly intraday-to-a-few-days instruments.
So who actually uses them, and correctly? Two legitimate camps:
- Short-term tactical hedgers and traders who buy the long-vol ETP for days, not months, expecting a near-term vol spike — a Fed meeting, a jobs print, a cliff-edge technical setup in the tape, a known binary event. They're renting a spike, and they get out fast, before the decay and the mean-reversion claw it back. Enter Tuesday, gone Thursday.
- The short-vol crowd who sell or short these products (or hold inverse products like SVXY) to harvest the contango decay — collecting the structural bleed as their profit month after month. This is a real, mathematically sound strategy, but it carries catastrophic tail risk. On February 5, 2018 — "Volmageddon" — a single-day VIX spike from roughly 17 to 37 destroyed the short-vol product XIV overnight; it lost about 96% of its value in hours and was terminated. People who'd been quietly harvesting decay for years, compounding beautiful steady returns, were wiped out in one session. The strategy printed money right up until the day it detonated, which is the defining signature of a hidden short-vol position: it looks like genius until it looks like a smoking crater.
The lesson HPT drills relentlessly: the vol ETPs are tools for a thesis measured in hours or days, never a position you marry. If you don't understand roll yield in your bones, you have no business holding them overnight — and if you're short vol, you define your risk or you eventually die.
Reading the Fear Behind the Fear: VVIX and Vol-of-Vol
If the VIX measures the expected volatility of the S&P 500, then VVIX measures the expected volatility of the VIX itself. It's the vol-of-vol — how jumpy the fear gauge is expected to be over the next month, computed from the prices of VIX options the same way the VIX is computed from SPX options.
Why would you care about a second derivative of fear? Because it front-runs. VVIX often moves before the VIX does. When VVIX is climbing while the VIX is still calm, it means traders are quietly loading up on VIX call options — buying insurance on their insurance, positioning for a spike before the spike arrives. That's frequently smart, patient money getting long volatility ahead of the crowd. The VIX is the surface of the pond; VVIX is the current underneath it.
Reading VVIX:
- VVIX in the 80s–100 = calm, boring, complacent. Nobody's paying up for VIX calls.
- VVIX 100–120 = normal tension, ordinary hedging demand.
- VVIX 120–130+ = elevated, tension building, real demand for VIX upside.
- VVIX spiking above ~140 = the market is bracing hard for a real vol event; VIX call demand is surging.
The Divergence That Warns Early
The single most useful VVIX pattern: VVIX rising while VIX is flat or low. That's a divergence — the plumbing is nervous even though the surface is calm. Someone is paying up for protection on volatility while spot volatility snoozes. It's one of the earliest warnings that complacency is about to break, and it often shows up alongside the flattening-contango tell we covered above. When both fire together — VVIX creeping up and the term structure flattening while spot VIX and SPX both look serene — you have a genuine structural early-warning system that price gives you no hint of. The tape looks fine. The vol complex is quietly screaming.
The reverse is a comfort signal: after a spike, when VVIX collapses back under 100 while VIX is still elevated, the market has stopped bracing for further escalation — often an early sign the worst of a scare is passing and the mean-reversion is coming.

IV Rank and IV Percentile: Is Vol Actually High?
Here's a trap beginners fall into constantly: they see VIX at 20 and say "vol is high." Compared to what? Twenty is low for a bear market and high for a sleepy summer grind. A raw number means nothing without context. That's exactly what IV Rank and IV Percentile fix — and, crucially, they apply to any optionable instrument, not just SPX. Every stock, every ETF, every commodity has its own implied-vol history, and rank/percentile normalize each one against itself.
IV Rank answers: where does today's IV sit between its lowest and highest reading over the past year?
IV Rank = (Current IV − 52-week Low IV) ÷ (52-week High IV − 52-week Low IV) × 100
If a stock's IV ranged from 20 to 60 over the past year and it's at 40 today: IV Rank = (40 − 20) ÷ (60 − 20) × 100 = 50. Today's vol is exactly midway between its calmest and its most panicked over the year.
IV Percentile answers a subtly different question: what percent of the past year's days had IV lower than today's? If IV Percentile is 80, then on 80% of trading days in the past year, vol was lower than it is now — today is genuinely elevated relative to its own history.
The two can diverge, and the divergence is informative. Rank is anchored only to the year's extremes — one freak spike a year ago can pin the "high" and drag every subsequent rank reading down. Percentile counts every day, so it's more robust to a single outlier. If IV Rank reads 30 but IV Percentile reads 65, a lone historical spike is distorting the rank; the percentile is telling you vol is actually higher-than-usual most of the time. When they disagree, trust the percentile — it has more information in it.

Why This Changes How You Trade
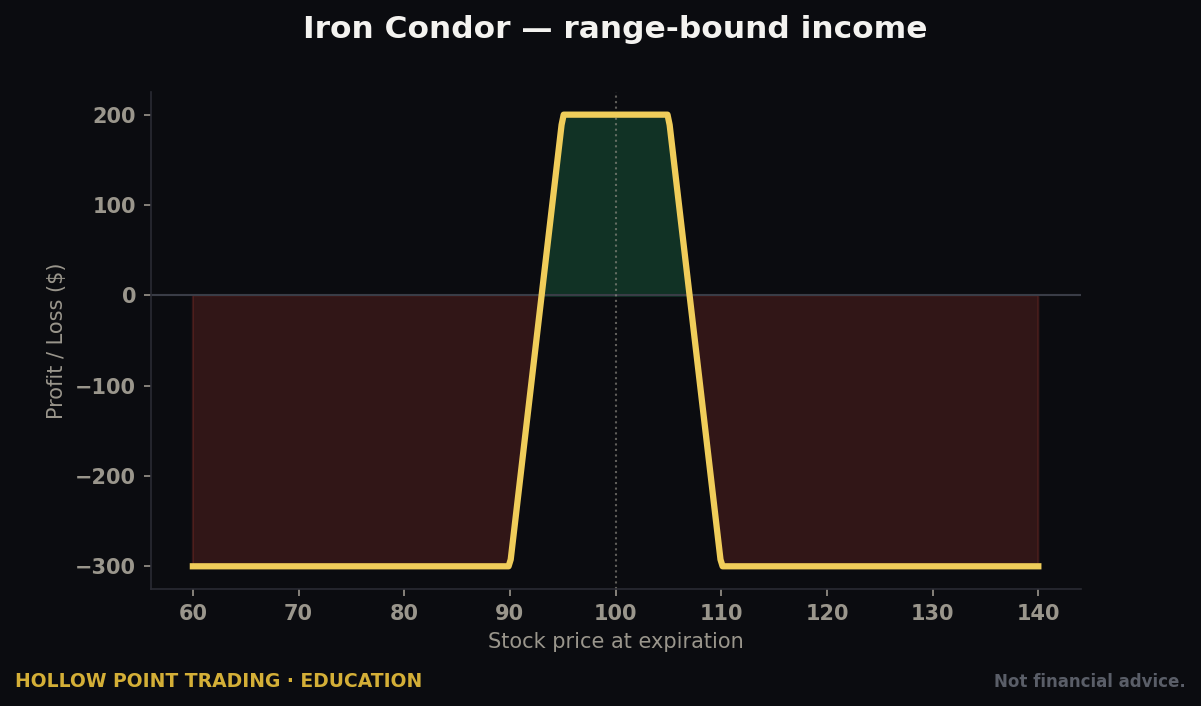
- High IV rank (>50, especially >70): options are expensive. Premium is fat. This is when sellers of premium — credit spreads, iron condors, cash-secured puts, covered calls, short strangles — have the structural edge. You're selling overpriced fear, and if vol reverts to its mean (which it does, reliably, because vol is the most mean-reverting series in all of finance), you win on the vol crush alone, even if price does nothing. High IV rank also flags a market pricing in a big move, so respect the possibility that the big move is real.
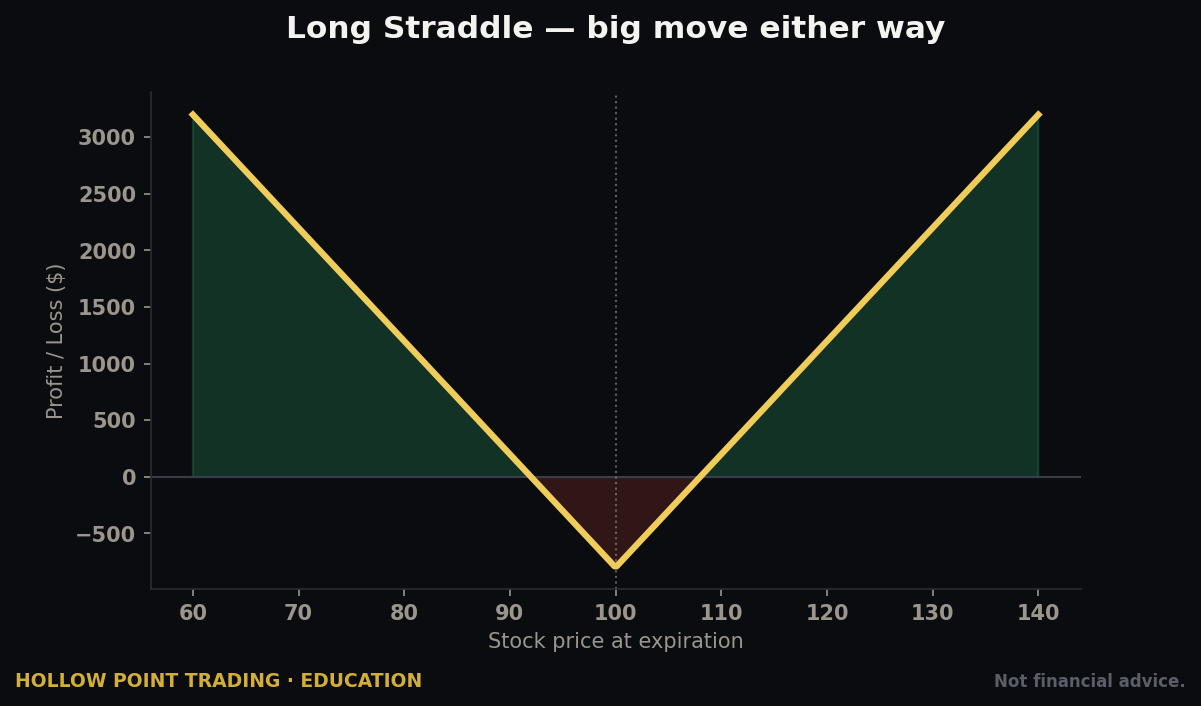
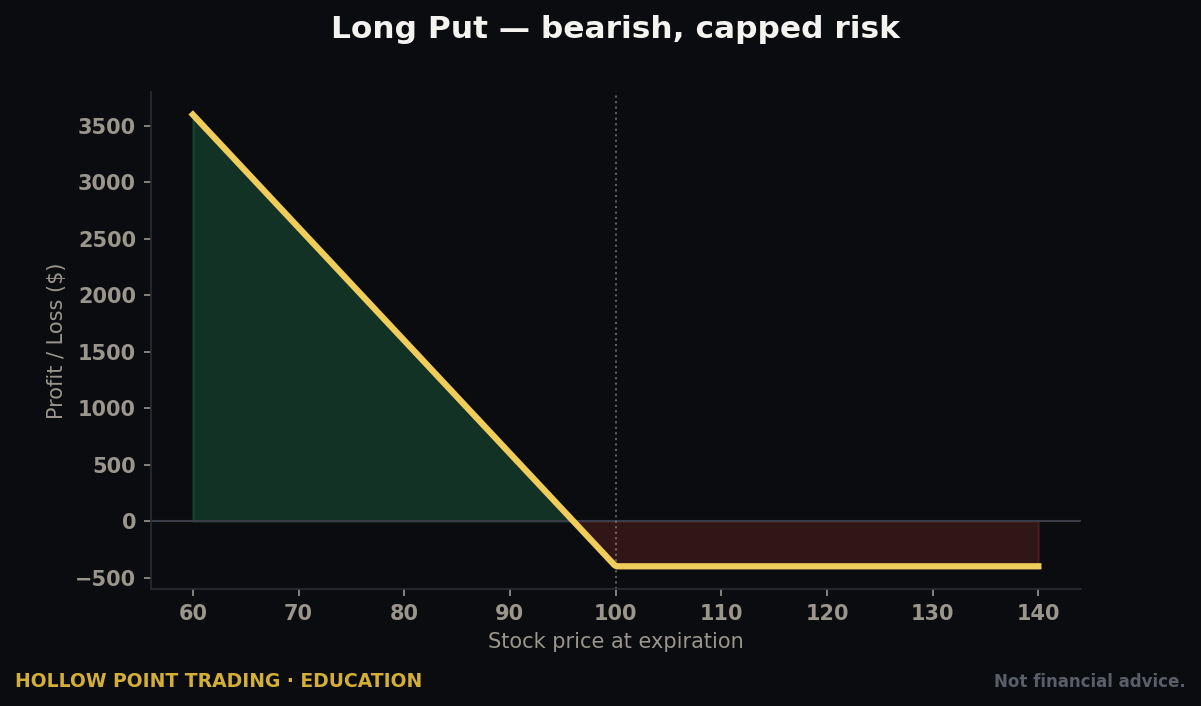
- Low IV rank (<25): options are cheap. This is when buyers of premium — long calls, long puts, debit spreads, calendars, straddles — get a fair price, and when a vol expansion would pay you handsomely. Complacent tape; cheap insurance; the time to own optionality rather than sell it.
The rule of thumb the pros live by: sell premium when IV rank is high, buy premium when it's low. You're not primarily predicting direction — you're trading whether fear is overpriced or underpriced. Direction is the second decision, and it rides on top of the vol decision, not the other way around.
The One Place This Rule Reverses
Blindly selling premium because IV rank is high is how people get hurt around known catalysts. If IV rank is 90 the day before earnings, that's not free money — the market is pricing a real binary. Sell the premium and you're short gamma into a coin flip; the vol crush is real but the directional gap can bury the credit you collected many times over. The pro adjustment: sell high IV rank when it's ambient (elevated across the whole tape with no single scheduled event), and define your risk tightly when the high rank is sitting on top of a specific, dated catalyst. High rank tells you premium is rich; it does not tell you the richness is unjustified.
The Regimes: Why Below 15 and Above 25 Are Different Worlds
This is the part that changes how you trade everything, even if you never touch a single VIX product in your life. The absolute level of the VIX defines the regime — the physics of the tape. The same setup, drawn identically on the chart, behaves completely differently at VIX 12 versus VIX 35. It's not that your analysis changes; it's that the medium your analysis is moving through changes density.
Complacency Regime — VIX below ~15
Low vol, grinding markets. Trends are smooth and persistent. Pullbacks are shallow and get bought almost reflexively. Mean-reversion works; buying dips works; trends melt up on low, unremarkable volume. The daily expected move is under 1%, so ranges are tight and overnight gaps are small and forgettable. This is a trend-follower's paradise and an options-buyer's graveyard — long premium decays into nothing because nothing moves enough to overcome theta.
The danger hides in the comfort. Prolonged sub-13 VIX breeds complacency; leverage builds up quietly across the system because carry trades and short-vol strategies look free; and the eventual snap is violent precisely because everyone was leaning the same relaxed way. Low vol is not "safe" — it's a coiled spring. The lower and longer it stays down, the more positioning crowds onto one side, and the harder the eventual reversion when it comes. This is the regime where the VVIX-divergence and curve-flattening tells earn their keep, because they're the only warning you'll get while the surface stays glassy.
Normal Regime — VIX ~15 to ~25
The honest middle. This is the market's ordinary operating range. Expected daily moves of roughly 1–1.5%. Both trend and mean-reversion strategies work with normal position sizing. Nothing exotic — this is where your standard playbook, your standard stops, and your standard R/R apply cleanly and without adjustment. Most trading days of most years live here. If you built your entire system and never adjusted for regime, this is the band where you'd survive. The other two bands are where the un-adjusted die.
Panic Regime — VIX above ~25 (and especially above 30)
Everything changes at once. Daily expected moves are 2%+; intraday ranges triple; correlations go to 1 — everything sells off together, sector rotation stops mattering, and diversification quietly stops working exactly when you were counting on it. The term structure flips into backwardation. And — critically — the VIX itself becomes mean-reverting. Spikes into the 30s, 40s, and 50s do not last, historically. They are, in hindsight, some of the best long-side entries the market ever offers — for those with the discipline and staying power to buy fear while the crowd is puking.
But you must size down, hard, because a 2%+ daily move means your stop needs far more room to avoid being knifed on noise, and a normal-sized position now carries double or triple the dollar risk it did last week. The panic regime punishes size and rewards patience. The people who get destroyed here aren't wrong on direction — they're right on direction with a position size calibrated for a market that no longer exists.

The Regime-Driven Position-Sizing Rule — This Is the Whole Point
Your position size should be inversely proportional to volatility. When VIX doubles, your expected move doubles, your stop distance (in dollars, to hold the same probability of survival) roughly doubles, and to hold constant dollar risk you must roughly halve your position size. When VIX triples, cut to a third. This isn't a suggestion; it's arithmetic.
Traders who blow up in high-vol regimes are almost always running low-vol position sizes into 3% daily ranges. Same setup, same stop in percent of price, but the dollars behind it are twice or three times as violent, and their equity curve turns into an EKG. The VIX doesn't just tell you the mood — it tells you how big to trade. It is the single most reliable position-sizing input you have, and it's free, and it's on your screen right now.
How Regime Rewrites Each Style
- Trend followers: thrive in low vol, struggle in panic. In the panic regime, "trends" are actually violent two-way whipsaws that stop you out both directions in a day. Widen stops or step aside.
- Mean-reversion faders: modest edge in low vol, strong edge in panic (because the VIX and price both over-shoot and snap back), danger in the transition — fading the first leg of a regime shift is how you catch a falling knife. Fade extremes after the regime is established, not as it's breaking.
- Premium sellers: starved in low vol (nothing to sell), feasting on rich premium in high vol — if they've sized for the tail. Selling into a spike is lucrative and lethal in equal measure.
- Breakout traders: their false-breakout rate soars in high vol because 2% noise looks like a breakout. In low vol a break of a level means more.
Multi-Timeframe Vol: The Regime Has Its Own Fractal
The VIX itself is a 30-day measure, but volatility exists on every timeframe, and they don't always agree. You can have a calm 30-day VIX sitting on top of a violent intraday tape — a "quiet on the daily, knife-fight on the 5-minute" day, common around a single scheduled event that the month has priced but the hour hasn't digested. Conversely, an elevated VIX can sit over a suspiciously orderly intraday grind when the fear is about a future date, not today.
Read them as layers. The 30-day VIX sets your swing and overnight sizing and your macro regime. The short-dated measures — the 9-day VIX (VIX9D) and 1-day (VIX1D), plus the realized range of the last few sessions — set your intraday sizing and stop width. When VIX9D spikes above the 30-day VIX (a short-end inversion of the vol term structure itself), the fear is immediate and near-dated — a today-and-tomorrow problem. When the 30-day sits well above VIX9D, the fear is scheduled and distant — the market's bracing for something on the calendar, not something on the tape right now. That short-end-vs-long-end comparison is the term-structure logic applied to the fear gauge itself, and it tells you whether to defend the next hour or the next month.
How It Fits the Top-Down HPT Process
At Hollow Point we run every read the same direction: macro → sector → stock → technical → behavioral. The VIX complex isn't a side toy — it's a core input at the macro layer, and it cascades down through every layer below it, quietly setting the terms of everything underneath.
Macro Layer — The Regime Filter
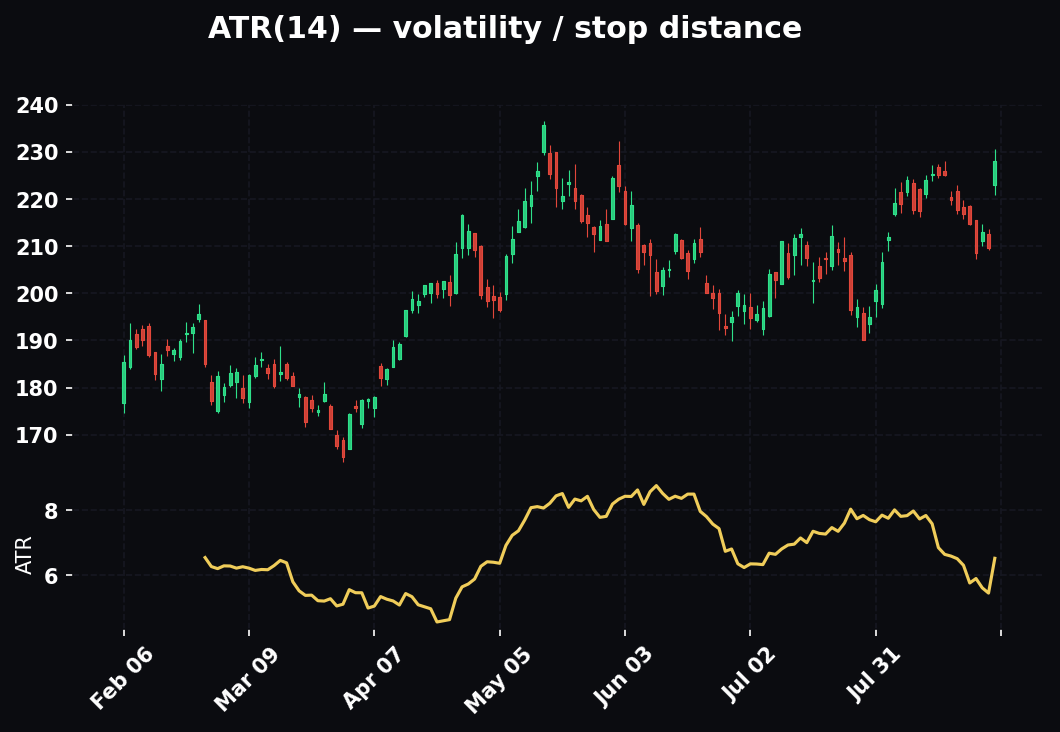
Before any single-name idea, the VIX and its term structure set the environment. Contango + VIX under 20 = risk-on, trend-friendly, longs get the benefit of the doubt, you can carry a fuller book and hold overnight with confidence. Backwardation + VIX over 25 = risk-off, defense first, everything correlates, you cut size and tighten up and stop trusting overnight holds. VVIX rising into a calm VIX = a yellow flag that raises your guard even when price looks pristine. This one filter tells you which playbook is even valid today. You don't run breakout-continuation plays into a backwardated panic tape, and you don't buy cheap crash puts in a dead-calm melt-up. Getting the regime wrong means running the right tactics in the wrong world — the fastest way to be consistently, confidently unprofitable.
Sector Layer
In a rising-vol regime, leadership rotates defensive — staples, utilities, healthcare, and low-beta dividend names hold their bid while high-beta tech, small caps, and recent momentum darlings get hit hardest, because they carry the most implied vol to shed and the most crowded positioning to unwind. The VIX regime tells you which sectors to hunt in and which to avoid being long into a spike. In a falling-vol regime coming out of a scare, the same high-beta names that led the fall lead the recovery hardest — the beta cuts both ways, and the vol regime tells you which way the blade is pointing.
Stock / Technical Layer — Where Our EMA Framework Meets Vol
HPT trend structure runs on the EMA 12/22/55, with the daily 55 as the bias tell. Volatility regime governs how you read those EMAs. In a low-vol regime, price rides the 12/22 in a clean, obedient stack, and shallow dips to the 22 get bought — you can trust pullback entries close to the fast EMAs, and a tag of the 22 is a gift. In a high-vol regime, price whipsaws through the 12 and 22 constantly; those fast EMAs get sliced a dozen times a session and carry almost no signal; only the 55 holds any authority, and you have to give trades room to breathe around the 55 or you'll get stopped on pure noise before the thesis has a chance. Same EMAs, different tolerances — and vol sets the tolerance. The chart didn't change. The air around it got thicker.
Concretely: an entry that hugs the 12-EMA with a stop just beneath it is a fine low-vol trade and a shredder in a VIX-35 tape, where price routinely stabs 1.5% below the 12 and reclaims it inside an hour. In high vol, anchor entries and stops to the 55 and the day's realized range, not to the fast EMAs.

Risk Layer — Sizing and R/R
Our mandate is 1:3 reward-to-risk with timeframe-weighted confluence. The VIX sizes the "risk" side of that ratio. A 1:3 setup with a 1% stop in a VIX-13 tape and a 1:3 setup with a 3% stop in a VIX-35 tape are not the same trade — the second one needs one-third the share count to keep the dollar risk identical, and it needs a target three times as far away to keep the ratio at 1:3, which means the whole trade takes place on a larger canvas. The VIX is the input that keeps your 1:3 honest across regimes. Skip it and your "consistent" risk quietly triples when the market gets scary — which is exactly the wrong time for your risk to be secretly ballooning. Half the traders who think they run consistent risk actually run consistent share counts, which means their dollar risk breathes in and out with the VIX, largest right when the tape is most dangerous.
Behavioral Layer — Discipline Over Prediction
This is the HPT core, and vol is where it's tested hardest. When the VIX rips into the 40s, the entire crowd is puking in fear — and that is mechanically when the best long entries appear, because the VIX mean-reverts and the term structure will normalize. But you can only take those entries if you sized down beforehand, kept powder dry, and pre-decided your levels while you were calm. Nobody makes good decisions at the emotional peak of a panic. The edge isn't bravery in the moment; it's the plan you wrote when the VIX was 14 that told you exactly what to do when it hit 40. Fear is the trade. Your rules are the edge that lets you take the other side of it. The VIX doesn't just measure the crowd's fear — it measures the emotional gap you're being paid to have the discipline to cross.
Worked Examples
Example 1 — Sizing a Trade Off the VIX
You've got a long setup on a $100 stock, planning a stop at $97 (3% away). VIX is 14. Your account risks $500 per trade. Position = $500 ÷ $3 = ~166 shares ($16,600 exposure). Now the same setup appears with VIX at 34. The stock's realized vol has doubled with the market's; a 3% stop now gets hit on noise — the stock swings 3% before lunch and reclaims it — so you widen it to 6% ($94 stop) to survive the range. Position = $500 ÷ $6 = ~83 shares. Half the shares, same $500 risk. The VIX told you to cut size in half. Ignore it and you'd have carried $16,600 into a tape moving twice as hard, and your "$500 risk" would really have been a $1,000+ risk the first time price sneezed.
Example 2 — Reading the Term Structure for a Hedge
SPX is grinding to new highs, VIX at 13, everything looks calm. But you notice three things stacking: the term structure is unusually flat (normally steep contango has compressed, M1/M2 has crept from 0.91 up to 0.98), VVIX has climbed from 90 to 125 over a week, and the 9-day VIX has quietly ticked above the 30-day. The surface is calm; the plumbing is nervous on all three gauges. You don't short the market — price hasn't broken, and shorting a melt-up because vol is nervous is how you die of a thousand cuts. But you buy a small, cheap, short-dated SPX put or a defined-risk UVXY call spread as a tactical hedge into the event you suspect is coming, sized so the decay can't hurt you if you're wrong and early. That's using the vol complex to hedge before the spike, when insurance is cheap, rather than chasing it after, when it's expensive. If nothing happens, you paid a small, known premium for a week of sleep. If the snap comes, the hedge pays multiples and funds your fear-buying entries.
Example 3 — IV Rank Driving Strategy Selection
Earnings on a stock you follow; IV rank is 92 (vol near its yearly high — the market's pricing a huge move, and the fat premium is justified by the binary). You're not a naked buyer of that overpriced premium, and you're not a naked seller into a coin flip either. If you have a directional lean, you sell it with defined risk — a credit spread or an iron condor — collecting the fat premium and letting the post-earnings vol crush work for you as IV collapses back to baseline the instant the news is out, while your defined wings cap the damage if the gap runs against you. Same stock, three weeks later, no catalyst, IV rank now 15 (cheap vol, quiet name): now a long debit spread or a straddle is the fair-priced way to play an expected move, and if vol expands you get paid twice — once on direction, once on the vol. IV rank picked the strategy in both cases; direction was the second decision, riding on top of the vol decision.
Example 4 — The Full Regime Read, Start to Finish
Monday morning. VIX opens at 31, up from 18 on Thursday. Before you look at a single chart, you know the regime: panic. You run the checklist. Term structure? You pull the curve — front month 30, second month 27, third 25: backwardation, confirmed acute stress, not a wobble. VVIX? 145 — the market's still bracing for more, so this isn't the bottom yet. VIX ÷ 16 = ~1.9%, so today's expected SPX range is nearly 2% in each direction; a 4% peak-to-trough day is entirely normal now. Your sizing: cut to a third of your low-vol share count. Your EMAs: ignore the 12 and 22 intraday, trade around the daily 55. Your playbook: no breakout-continuation, no trusting overnight holds; instead, watch for the VVIX to roll over under 100 and the front-month VX to stop making new highs — the first structural sign the spike is exhausting. When that comes, then the mean-reversion long entries you pre-planned at your levels become live, sized small, into the fear. You didn't predict the bottom. You defined the conditions under which you'd act, sized for the regime, and waited for the vol complex to tell you the crowd had finished puking.
How the Pros Use It Differently From Beginners
The gap between an amateur and a professional reading the same VIX isn't access to secret data — it's the same screen, read with completely different questions.
Beginners read the level; pros read the change and the structure.** A beginner sees "VIX 22, kind of high." A pro sees "VIX 22, up from 14 in three sessions, curve just inverted, VVIX 138" and knows a fast regime shift is underway — versus "VIX 22, down from 40, curve re-steepening, VVIX back under 100," which is the same number* telling the opposite story: a panic resolving. The level is nearly meaningless without its trajectory and its curve.
Beginners treat the VIX as a signal to act; pros treat it as a filter that decides which of their signals are valid. The VIX rarely tells a pro to do something directly. It tells them which of their existing setups to trust and how big to trust them. It's a lens, not a trigger.
Beginners buy vol products hoping vol goes up; pros trade the structure — roll yield, skew, term-structure trades, calendar spreads on VX* — where the edge is mechanical and repeatable rather than a directional bet on fear.
Beginners size by conviction; pros size by volatility. The amateur bets bigger when they feel more sure. The pro's size is set almost entirely by the VIX and the instrument's realized range, with conviction as a minor modifier. Feelings scale with the market's euphoria; the VIX scales against it, which is exactly what you want governing your size.
Beginners fear the spike; pros pre-plan for it. To an amateur, VIX 45 is terror. To a pro, it's the environment they wrote a plan for weeks ago while calm, with levels pre-drawn and size pre-cut, waiting to be the liquidity provider to the panic.
Beginners watch only spot VIX; pros watch the whole complex as a system — spot, the curve, VVIX, IV rank across their watchlist, the short-end-vs-long-end vol spread — and they read the disagreements between those gauges as the highest-value signal of all.
The Common Mistakes
1. Trading the ETPs like stocks. Buying and holding UVXY/VXX because "vol has to go up eventually." The decay trap eats you alive in contango, and the daily-leverage drag finishes the job. These are hours-to-days tools with a mathematical downhill built in. "Eventually" arrives after the product has already lost you 80%. Never a hold.
2. Confusing "low VIX" with "safe." The lowest-vol regimes precede the biggest snaps, because that's when leverage and one-sided positioning quietly build. Complacency is a setup, not a green light. When everyone's calm and VVIX is creeping and the curve is flattening, you raise your guard — you don't drop it.
3. Ignoring the term structure entirely. Just watching spot VIX and missing that the curve inverted. Backwardation is a fundamentally different world than contango even at the identical VIX level — VIX 22 in steep contango (a market that's edgy but orderly) is not VIX 22 in backwardation (a market that's actively breaking). Read the shape, not just the number.
4. Same position size across regimes. The number-one account-killer, full stop. Running VIX-13 size into a VIX-35 tape. Your dollar risk silently triples exactly when the market is most capable of hurting you. If you fix only one mistake on this list, fix this one — it's the one that ends accounts rather than just denting them.
5. Buying vol after the spike. By the time VIX is at 40 and the crash is on every screen, the insurance is priced at its most expensive and vol is about to mean-revert down.* You buy protection when it's cheap and complacent, not when it's expensive and panicked. Chasing the spike is buying the very top of fear and then eating the roll and the reversion on the way back down.
6. Selling vol naked in a low-vol regime. The Volmageddon trade. Harvesting contango decay works beautifully — right up until the one day it doesn't, and then it takes everything you made and everything you had. If you sell vol, define your risk with a long wing. Always. There is no version of "just this once, naked" that survives a long enough sample.
7. Reading a raw IV number without rank. "IV is 45, that's high." High versus what? A biotech's baseline IV of 60 makes 45 low for that name; a utility's baseline of 15 makes 45 an earthquake. Without IV rank or percentile the number is context-free noise. Always contextualize against the instrument's own year.
8. Trusting the expected-move band as a hard wall. VIX ÷ 16 gives you a one-standard-deviation fog line, not a guardrail. One day in three closes outside it, and fat tails mean the big breaches happen more often than the math suggests. Traders who sell "the market can't move more than 1% today" naked strangles because the VIX said so eventually meet the day it moves 4%.
9. Forgetting vol crush around known catalysts. Buying long options right before earnings when IV rank is 90, then watching the stock move exactly as you predicted — and still losing money because IV collapsed and gutted your premium the moment the news dropped. Being right on direction and wrong on vol is a losing trade. Know when a crush is coming.
10. Fading the first leg of a regime change. The VIX is mean-reverting within a regime, but regime shifts trend hard and fast. Fading VIX 25 on the way up to 45 because "it always comes back" is how you catch the falling knife with both hands. Fade extremes after the regime is established and the vol complex shows exhaustion — not as the regime is tearing.
11. Watching the VIX but not your own instrument's vol. SPX vol is the market's, but you trade individual names with their own vol lives. A single stock can have collapsing IV rank while the VIX rises, or the reverse. The VIX sets the environment; the instrument's own IV rank sets its premium pricing. Use both.
12. Marrying a directional view to a vol product. Deciding "I'm bearish, so I'll hold UVXY as my short." You've now stacked a directional bet on top of a structurally decaying, leverage-dragged, mean-reverting instrument. Even if you're right on the market direction over weeks, the product's internals can hand you a loss. Express directional views with directional tools; use vol products only for vol theses on a short clock.
FAQ
Can I just buy the VIX when it's low? No — there's nothing to buy. Spot VIX isn't a tradeable instrument. The closest proxies are VX futures or the ETPs (VXX, UVXY), and every one of them carries roll decay that punishes the "buy low and wait" instinct. Buying vol requires a near-term thesis and a short holding period, not patience.
What VIX level is "normal"? Roughly 15–25 is the ordinary operating range, with the long-run average sitting around the high teens to low 20s depending on the era. Below 15 is complacency; above 25 is stress; above 30 is genuine panic. But always read the level against its recent trajectory, not against a fixed textbook number.
Does a high VIX mean the market will crash? No. A high VIX means the market expects large moves and is paying up for protection — magnitude, not direction. Very high VIX readings have historically been closer to bottoms than tops, because peak fear coincides with peak selling exhaustion. High VIX is a warning about turbulence, not a forecast of further decline.
Why does VXX keep going down over years even when there are scares? Because contango is the default state ~75–85% of the time, VXX is rolling into decay far more often than it's spiking, and the scares — however violent — don't last long enough or occur often enough to overcome the relentless daily bleed. The math favors the downside over long horizons, which is why the product reverse-splits repeatedly.
Is selling volatility "free money"? No — it's positive-carry money with a catastrophic tail. You collect small, steady premium harvesting the volatility risk premium, and it feels free for months or years, until a Volmageddon-style spike erases everything at once. It can be a sound strategy only with strictly defined risk on every position. Naked short vol is a strategy with a hidden expiration date.
How is VVIX different from VIX? VIX is the expected volatility of the S&P 500 over 30 days. VVIX is the expected volatility of the VIX itself — the vol-of-vol, computed from VIX options. VVIX often moves first, so a rising VVIX under a still-calm VIX is one of the earliest warnings that a vol event is being positioned for.
Should a stock trader who never touches options care about the VIX? Absolutely, and this is the whole point of the regime section. Even if you only ever buy and sell shares, the VIX tells you how big to size, how wide to set stops, which setups are valid today, and whether to trust an overnight hold. It's the most useful free position-sizing input on your screen regardless of whether you ever trade a single option.
What's the fastest daily use of the VIX? Divide it by 16 every morning. That's your expected 1-standard-deviation SPX range for the day. VIX 20 → expect roughly a 1.25% day. It instantly frames whether the market has used up its range or has room to run, and it sets your intraday expectations before the first candle prints.
The Cheat-Sheet
What the VIX is: 30-day implied volatility of SPX, derived from a strip of OTM options prices. Annualized %. Not directional — magnitude only. Reflects demand for protection, especially puts (hence the built-in downside skew).
Convert it (square-root-of-time):
- Daily expected move ≈ VIX ÷ 16 (in %). VIX 16 → 1% days. VIX 32 → 2% days. VIX 48 → 3%.
- Weekly ≈ VIX ÷ 7.1. Monthly ≈ VIX ÷ 3.46.
- That's the ~68% (1-standard-deviation) band. 2σ = double it (~95%). Real tails are fatter than the math — it's a fog line, not a wall.
Term structure:
- Contango (upward slope) = normal/calm, ~75–85% of the time. Long-vol ETPs decay here; short-vol earns carry.
- Backwardation (downward slope) = acute panic. Rare. Real fear signal. Deeper inversion = deeper stress.
- Flattening contango = early structural warning while spot is still calm.
- M1/M2 ratio: below 1.0 = contango; climbing toward/above 1.0 = flattening into backwardation.
- VIX9D vs 30-day VIX: 9D above 30-day = fear is immediate/near-dated; 30-day above 9D = fear is scheduled/distant.
The products:
- VX futures — the tradeable foundation.
- VXX (1x long), UVXY (1.5x long, daily-reset drag) — decay traps; days not months, never a hold.
- SVXY (−0.5x short) — harvests decay; catastrophic tail risk (see XIV, 2018).
- VIXY (short-term), VIXM (mid-term, slower decay & slower response).
- Spot VIX is not tradeable.
Second-order gauges:
- VVIX — vol of vol. Rising VVIX + flat VIX = early warning. Calm 80–100, tension 110–130, bracing >140. Collapsing VVIX after a spike = scare exhausting.
- IV Rank = where current IV sits in its 52-week range. >50 favor selling premium, <25 favor buying.
- IV Percentile = % of past year's days with lower IV. When it disagrees with rank, trust the percentile.
- Around dated catalysts, high IV rank is justified — sell only with defined risk, and mind the post-event vol crush.
The regimes:
| VIX | Regime | Daily move | How to trade |
|---|---|---|---|
| < 15 | Complacency | < 1% | Trend-follow, buy dips, don't buy premium; trust fast EMAs; watch for the snap (VVIX/curve) |
| 15–25 | Normal | 1–1.5% | Standard playbook, standard size, standard stops |
| > 25 | Panic | 2%+ | Cut size, widen stops, correlations→1, trade the 55 not the 12/22, fade extremes only after exhaustion, VIX mean-reverts |
The one rule that ties it together: when VIX doubles, halve your size; when it triples, cut to a third. Position size is inversely proportional to volatility. That's how a 1:3 R/R stays honest across every regime.
HPT integration: VIX + term structure = the macro regime filter that decides which playbook is even valid. EMA 12/22/55 read tolerances loosen as vol rises — only the daily 55 survives high vol. VIX sizes the risk leg of every 1:3. Sector leadership rotates defensive as vol rises. And the biggest long entries live inside the panic you were disciplined enough to prepare for while you were calm.

Trade the fear, don't feel it. The VIX isn't there to scare you — it's there to price the crowd's fear so you can decide whether it's overdone or just getting started, how big to trade around it, and which of your setups the day even permits. Master the number, the curve, the vol-of-vol, the rank, and the regime, and you stop being a passenger on other people's panic. You become the one reading the whole complex as a system, sizing to the turbulence instead of to your feelings, selling insurance when it's expensive and complacent, and buying it — or buying stocks — when it's cheap or when the crowd has finished puking. That's the whole game, and it's played on a screen you already own.
Bound by rules, feared by trade.
Not financial advice.