
Welcome. If you have never placed a trade in your life, you are in exactly the right place. This guide assumes you know nothing yet, and that is a strength, not a weakness. You get to learn it clean, without bad habits to unlearn.
We are going to talk about chart patterns — the repeating shapes that price draws on a chart. By the end, you will be able to open a chart on Monday morning, point at a shape, name it out loud, and know what it usually means. That is a real skill, and most people who have traded for years never learn it properly.
Let's start from the very bottom.
First, what even is a chart?
Imagine you are watching the price of one thing — a stock like Apple, or a futures contract, or Bitcoin. The price changes all day. A chart is just a picture of that price over time.
Reading left to right is time getting later. Reading bottom to top is price getting higher. So a line that goes up and to the right means price rose over time. A line going down and to the right means it fell. Simple.
Most traders don't use a plain line. They use candlesticks. A candlestick is a little rectangle with thin lines sticking out the top and bottom. Each candle covers a chunk of time — say five minutes, or one day. It tells you four things about that chunk of time:
- Where price opened (started)
- Where price closed (ended)
- The high (the highest it reached)
- The low (the lowest it reached)
The fat body of the candle is the distance between open and close. The thin lines — called wicks or shadows — reach up to the high and down to the low. Green (or white) usually means price closed higher than it opened. Red (or black) means it closed lower.
That's it. A chart is a wall of these candles side by side. When you step back and squint, those candles form shapes. Those shapes are what this whole guide is about.
What is a "chart pattern," really?
A chart pattern is a recognizable shape that price makes, that has shown up over and over throughout market history, and that tends to be followed by a particular kind of move.
Here is the honest, grown-up truth first: patterns are not magic and they do not predict the future. They do not "always work." Anyone who tells you a pattern is guaranteed is either lying or hasn't traded long enough to get burned yet.
So why bother? Because a pattern is a crowd behaving the same way it usually does. A chart is a picture of thousands of humans (and computer programs) buying and selling. Humans get greedy, scared, impatient, and hopeful in predictable ways. When enough of them feel the same thing at the same time, price draws the same shape. Patterns are the fingerprints of crowd emotion.
Think of it like weather. A meteorologist can't promise it will rain tomorrow. But when they see a certain cloud formation and a certain pressure drop, the odds of rain go way up. That's what a chart pattern gives you: better odds, not certainty. Your entire job as a trader is to find spots where the odds tip in your favor, then manage the times you're wrong so they cost you little.
Why a beginner should care about this
You might be thinking, "Why learn shapes? Can't I just buy things I like?"
Here's why patterns matter more than almost anything else you'll learn early on:
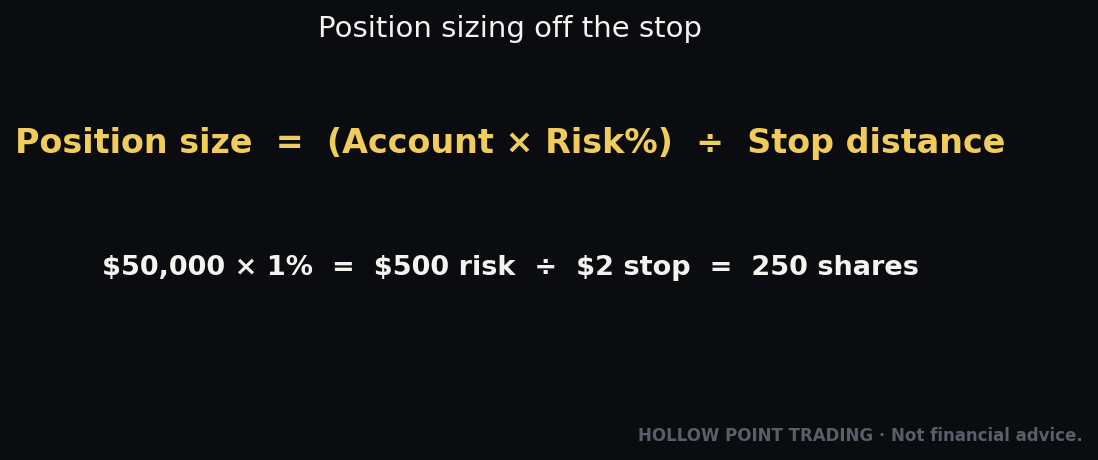
1. Patterns give you a plan. A beginner's biggest enemy is not being wrong — it's having no plan and reacting emotionally. A pattern hands you three numbers before you ever click buy: where to get in, where to get out if you're wrong, and where you're aiming. We'll cover all three.
2. Patterns tell you where the exit is. Every good pattern has a clear "if price does this, I was wrong, and I leave." That single line is what keeps a small mistake from becoming an account-destroying disaster. At Hollow Point Trading, protecting your money comes first — always before chasing a win. Patterns are one of the cleanest tools for that.
3. Patterns make charts less scary. Right now a chart might look like random noise. Once you know a handful of shapes, the noise organizes itself. You'll start seeing "oh, that's a triangle, that's a flag" — and calm replaces confusion.
Let's meet the shapes. We'll do the friendliest ones first.
The most important idea before any pattern: support and resistance
You can't understand patterns without these two words, so let's nail them now.
Support is a price level where falling stops and buyers step in. Picture a ball bouncing on a floor. The floor is support. Every time price drops to it and bounces up, that floor gets more real in people's minds.
Resistance is the opposite — a ceiling. Price rises to a level, gets rejected, and falls back. Like a ball hitting a ceiling. Sellers show up there.
Why do these levels exist? Memory. If lots of people bought at $100 and price dropped, then climbs back to $100, many of them just want to break even and sell. That selling creates a ceiling right at $100. Price has a memory because people have a memory.
Almost every pattern in this guide is really a story about price testing a floor or a ceiling — and then either bouncing off it or crashing through it. When price finally punches through a floor or ceiling with force, we call that a breakout. Hold that word. It's the heartbeat of pattern trading.
Pattern #1: The Flag (the "catch your breath" pattern)
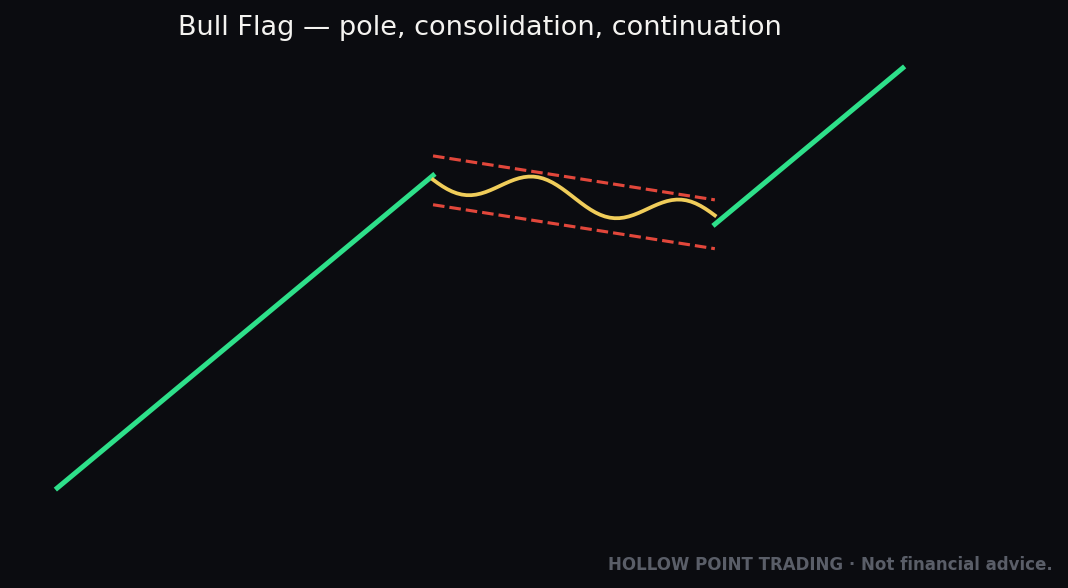
What it is in plain English: A flag is a short pause after a strong, fast move. Price shoots up (or down) hard, then drifts sideways or slightly against the move in a tight little channel for a bit, then continues in the original direction.
The analogy: Imagine a runner sprinting up a hill. Partway up, they slow to a light jog to catch their breath — but they don't stop and they don't turn around. Then they sprint again. The jog is the flag. The sprint before it is the "flagpole."

Why it forms: After a fast run, early buyers take some profit and the move stalls. But the people who missed the first run are waiting to jump in. So price only drifts a little, then the fresh buyers pile in and it takes off again.
How it works, step by step:
- Spot the flagpole — a strong, nearly straight move up (this is a bullish flag) or down (a bearish flag).
- Spot the flag — a small, tidy pullback that leans gently against the pole, usually on quieter, shrinking volume.
- Wait for the breakout — price pushes back out of the little flag in the original direction.
- Enter as it breaks out.
- Measure your target using the flagpole (we'll show this in the measured move section).
A fully worked beginner example:
Say a stock jumps from $50 to $60 in two days — a strong $10 flagpole. Then for three days it drifts calmly down to $58, $57.50, $57 in a tight little slope. Volume is quiet during this drift. On day six, price pushes back up and closes at $58.50, breaking out of the flag.
- Entry: ~$58.50 (the breakout)
- Stop-loss (where you admit you're wrong and exit): just below the flag, say $56.80
- Target: take the flagpole height ($10) and add it to the breakout point → $58.50 + $10 = $68.50
That's a complete trade idea from one shape. Risk is about $1.70 per share (58.50 − 56.80). Reward is about $10. That's a great ratio, which we'll get to.
Pattern #2: The Triangle (the "squeeze")
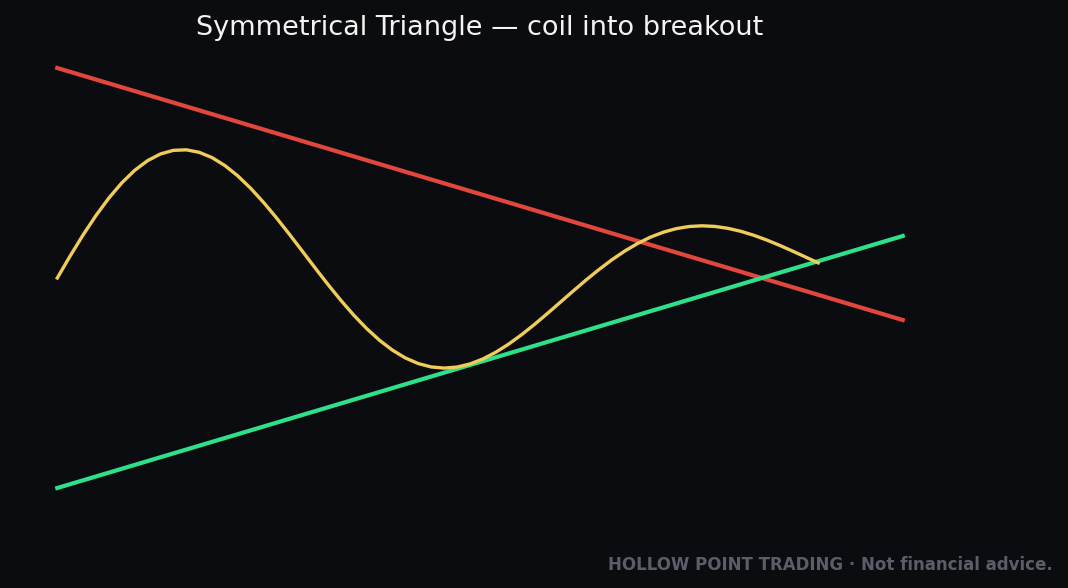
What it is: A triangle is price squeezing into a tighter and tighter range, like it's being funneled. The swings get smaller. Eventually price has nowhere to go but to burst out one side.
The analogy: Think of squeezing a garden hose. Pressure builds. When you finally let go, water shoots out hard. A triangle is that pressure building. The breakout is the water.
There are three flavors:
Ascending triangle — a flat ceiling on top, but the floor keeps rising. Buyers get more and more eager (they keep bidding higher), pressing price against a fixed ceiling. This usually breaks up. Bullish lean.
Descending triangle — a flat floor on the bottom, but the ceiling keeps dropping. Sellers get more aggressive, pressing price down onto a fixed floor. Usually breaks down. Bearish lean.
Symmetrical triangle — both lines squeeze toward each other evenly. Neither side is clearly winning. This one can break either way, so you wait and follow the breakout rather than guessing.

How it works, step by step:
- Draw a line connecting the swing highs (the ceiling) and a line connecting the swing lows (the floor).
- Watch them converge — the range tightens.
- Do not guess the direction early. Wait for a candle to close firmly outside one of the lines. That's your breakout.
- Enter on the breakout, in the direction it broke.
- Stop-loss goes just back inside the triangle.
- Target = the height of the triangle (its fattest part, on the left) added to the breakout point.
Worked example:
A stock chops between a firm floor at $20 and a ceiling that drops from $24 to $23 to $22 over two weeks — a descending triangle. The widest part on the left was $4 tall ($24 − $20). Price finally closes at $19.50, breaking below the $20 floor.
- Entry (short/sell idea): $19.50
- Stop-loss: back above the broken floor, ~$20.60
- Target: $19.50 − $4 = $15.50

Pattern #3: The Double Top and Double Bottom (the "two knocks")
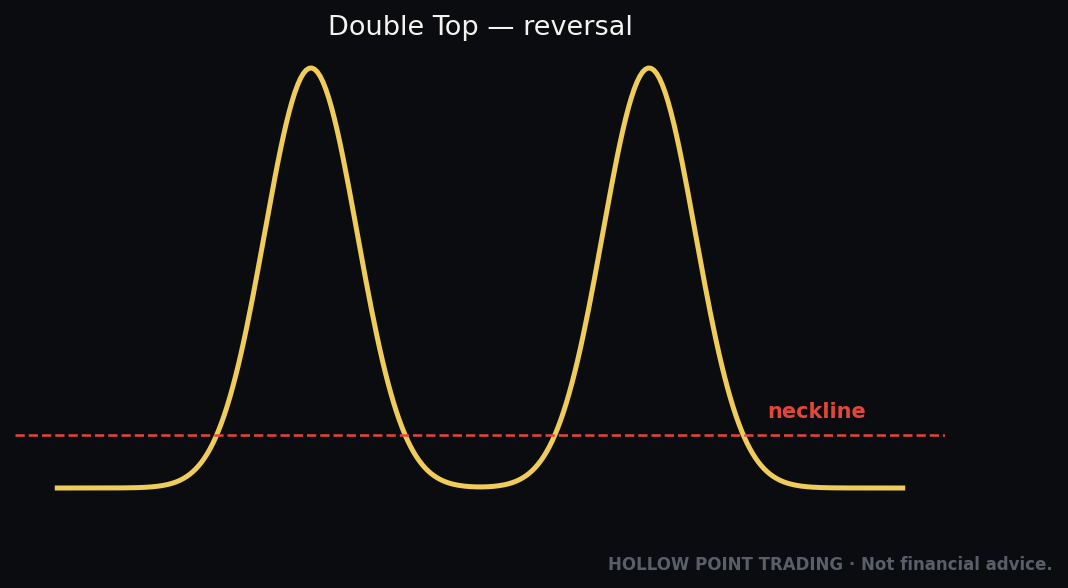
What it is: Price tries to break through a level twice, fails both times, and reverses. It draws the letter M (double top) or the letter W (double bottom).
The analogy: Someone knocks on a locked door twice. Both times, no answer, the door holds. They give up and walk away. Price knocking on a ceiling twice and failing is a double top — likely to fall. Knocking on a floor twice and holding is a double bottom — likely to rise.

Why it matters to you: These are among the easiest reversal patterns for a beginner to spot, because they're literally just two bumps at the same height. A reversal pattern warns that the current trend may be ending and turning around.
How it works (double top), step by step:
- Price rises to a high — call it Peak 1 — then pulls back to a dip.
- Price rises again to about the same high — Peak 2 — but can't get past it.
- The dip between the two peaks is the key level, called the neckline.
- When price falls and closes below the neckline, the pattern is confirmed. Not before.
- Enter on that neckline break (a sell idea).
- Stop-loss goes just above the second peak.
- Target = the height from the peaks down to the neckline, subtracted from the neckline.
Worked example (double top):
A stock hits $105, pulls back to $100 (that dip is the neckline), rallies back to $104.50 — basically the same peak — and rolls over. It then falls and closes at $99.
- The pattern height = $105 − $100 = $5
- Entry: $99 (neckline break)
- Stop-loss: above the peaks, ~$105.50
- Target: $100 − $5 = $95
A double bottom is the exact mirror: two dips at the same low, a neckline above them, and you buy when price closes above the neckline, targeting the pattern height added on top.

The single most important word here: confirmation. Beginners see two peaks and sell immediately. Don't. Two peaks alone are just a pause. It only becomes a real double top when the neckline breaks. Waiting for that break is the difference between a real edge and a hopeful guess.
Pattern #4: Head & Shoulders (the "three bumps")
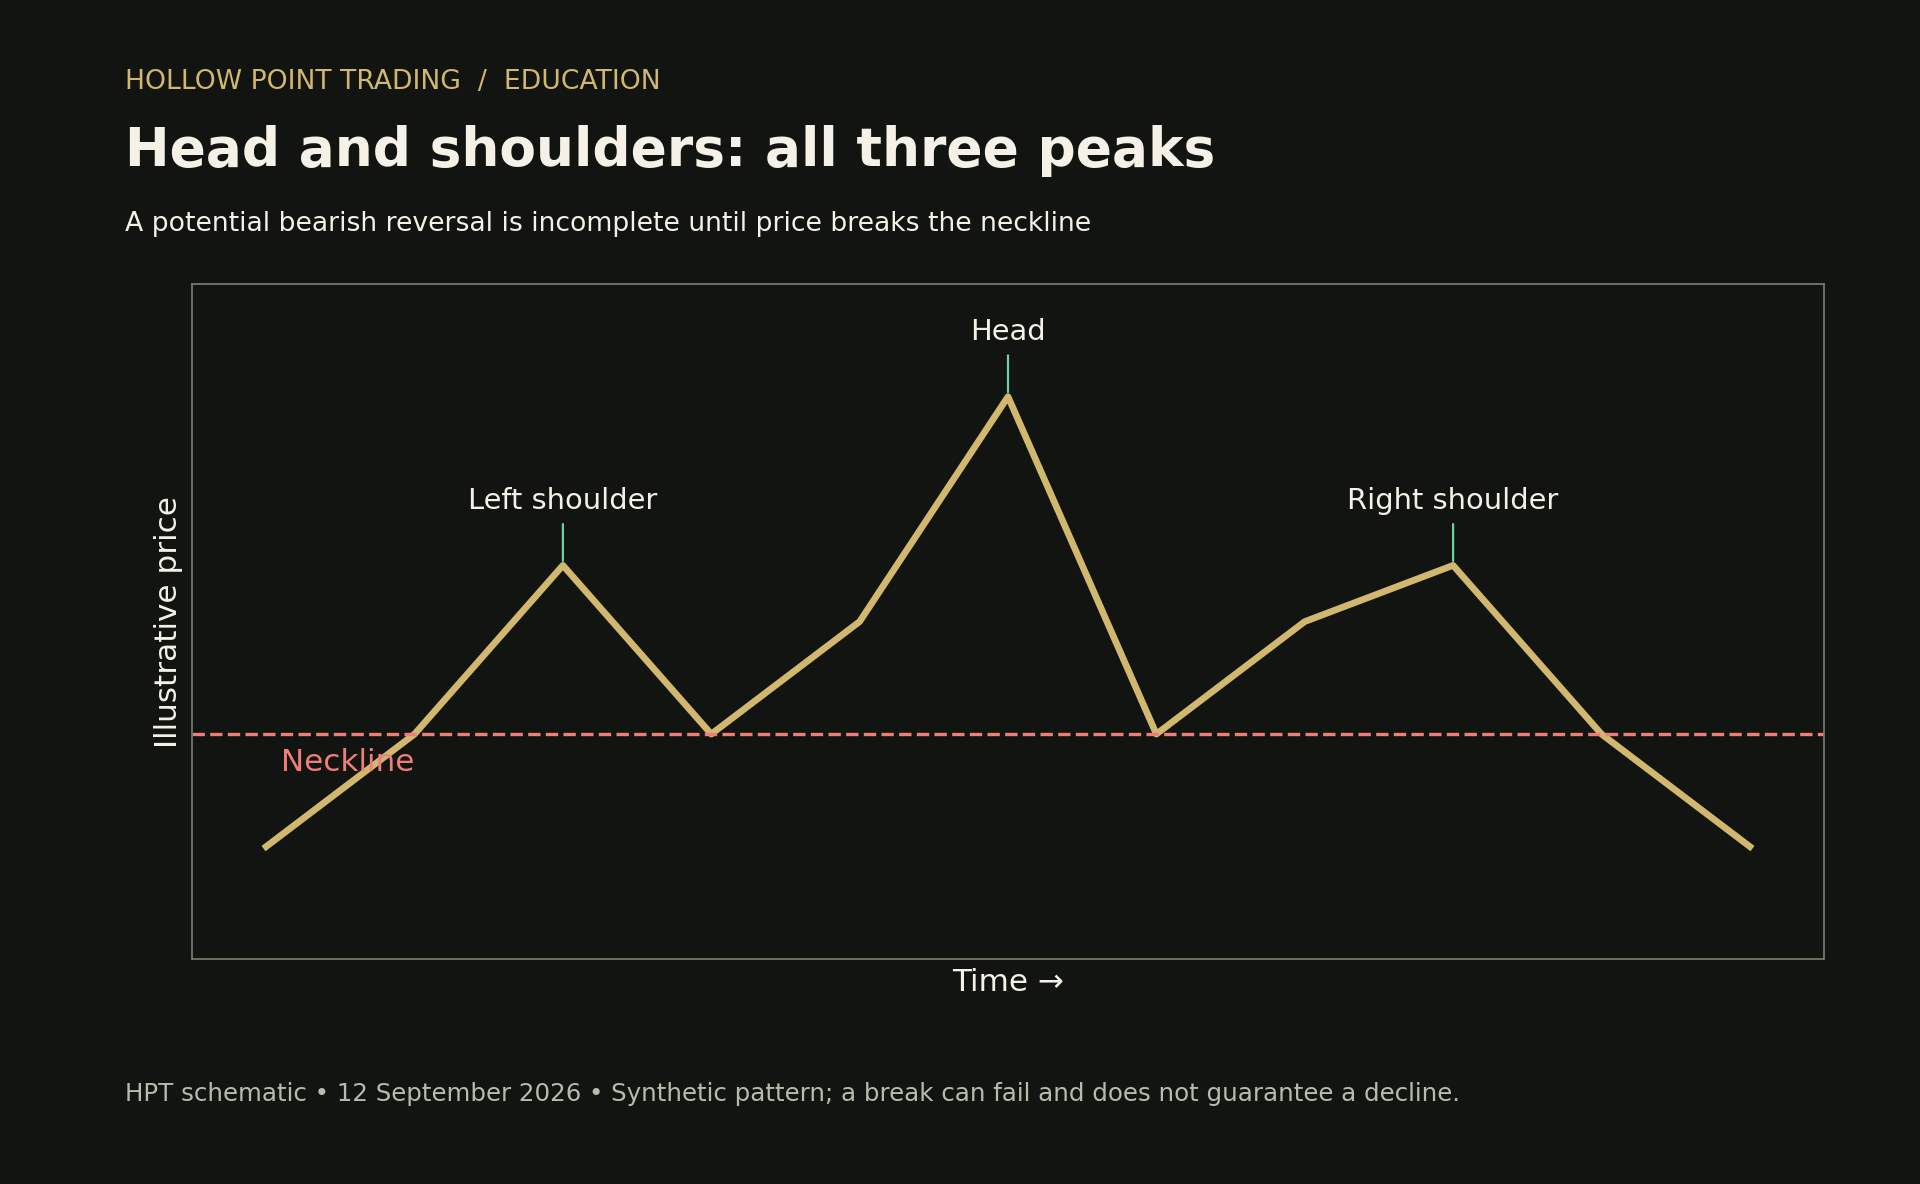
What it is: The most famous reversal pattern of all. Three peaks in a row: a medium one, then a higher one, then another medium one — like a left shoulder, a taller head, and a right shoulder. It signals an uptrend may be ending and turning down.
There's also an upside-down version — inverse head & shoulders — with three dips, signaling a downtrend may be ending and turning up.
The analogy: Picture the market trying to keep pushing higher. The first shoulder is a decent push. The head is one last, exhausted, higher push — the final burst of energy. The right shoulder is a weaker attempt that can't reach the head's height. The buyers are out of gas. When price then breaks the floor beneath all this (the neckline), the sellers take over.
How it works, step by step:
- Left shoulder: price rises to a peak, then dips.
- Head: price rises to a higher peak, then dips back down to roughly the same level as the first dip.
- Right shoulder: price rises again but fails to reach the head's height, then falls.
- Neckline: connect the two dips between the bumps — that's your floor.
- Confirmation: price closes below the neckline. Only now is it real.
- Enter on the neckline break (a sell idea).
- Stop-loss above the right shoulder.
- Target = the height from the head down to the neckline, subtracted from the neckline break.
Worked example:
- Left shoulder peaks at $52, dips to $48.
- Head peaks at $56, dips back to $48 (neckline is around $48).
- Right shoulder peaks at only $51 (weaker — a warning sign), then falls.
- Price closes below the neckline at $47.50.
Head height above neckline = $56 − $48 = $8.
- Entry: $47.50
- Stop-loss: above the right shoulder, ~$51.50
- Target: $48 − $8 = $40

That right shoulder being weaker than the head is the tell. It's the crowd running out of strength. The whole pattern is a story of fading momentum, and the neckline break is the moment the story confirms.
The Measured Move: how patterns hand you a target
You've noticed a theme by now. Every pattern gave us a target using the pattern's own size. This trick is called the measured move, and it deserves its own spotlight because it's the same simple idea every single time.
The plain-English rule: The size of the move before or inside the pattern tends to repeat after the breakout.

How to do it, three steps:
- Measure the pattern's height — top to bottom, in dollars (or points). For a flag, measure the flagpole. For a triangle or double top or head & shoulders, measure the tallest vertical part of the shape.
- Find the breakout point — where price escaped the pattern.
- Project — add that height to the breakout for an upside target, or subtract it for a downside target.
Worked example: A symmetrical triangle is $6 tall at its widest. Price breaks upward out of it at $80. Measured-move target = $80 + $6 = $86. If it had broken down at $80, the target would be $80 − $6 = $74.
That's the whole trick. It's not a promise — price may fall short or blow past it — but it gives you a sensible, pre-planned place to take profit instead of guessing or getting greedy. A target you decided before the trade protects you from the emotion during the trade.
The Volume Signature: the pattern's lie detector
Here is the secret that separates people who actually use patterns from people who just draw pretty lines. It's volume.
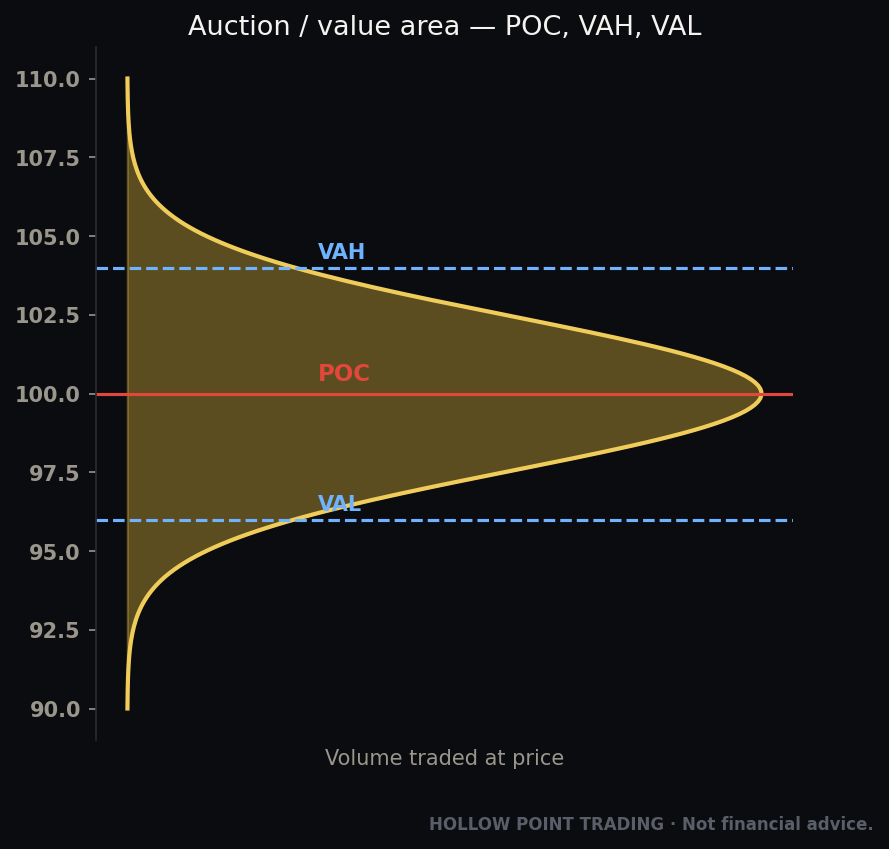
Volume is simply how many shares (or contracts) changed hands in a given period. On most charts it's shown as bars along the bottom — tall bar means lots of trading, short bar means little. Volume tells you how much conviction is behind a move. A price move on huge volume means a lot of people care. The same move on tiny volume means almost nobody's participating — it's weak, and more likely to fail.
Every pattern has a volume signature — a way volume "should" behave if the pattern is healthy. Learn these and you'll dodge a huge share of fake-outs.
The flag: Volume should be big on the flagpole (the sprint), then shrink during the flag (the rest), then surge again on the breakout. Loud, quiet, loud. That drop in volume during the flag is good — it means sellers aren't really fighting, price is just resting.
Triangles: Volume should shrink as the triangle tightens (the squeeze, everyone waiting), then explode on the breakout. A breakout on weak volume is suspicious.
Double tops / bottoms: Watch the second peak or dip. In a double top, if the second peak comes on lighter volume than the first, that's a tell — the buyers are weaker the second time. Then you want a volume surge on the neckline break.
Head & shoulders: Classic signature — volume is often highest on the left shoulder and head, then noticeably lighter on the right shoulder (fading strength), then a spike as the neckline breaks.
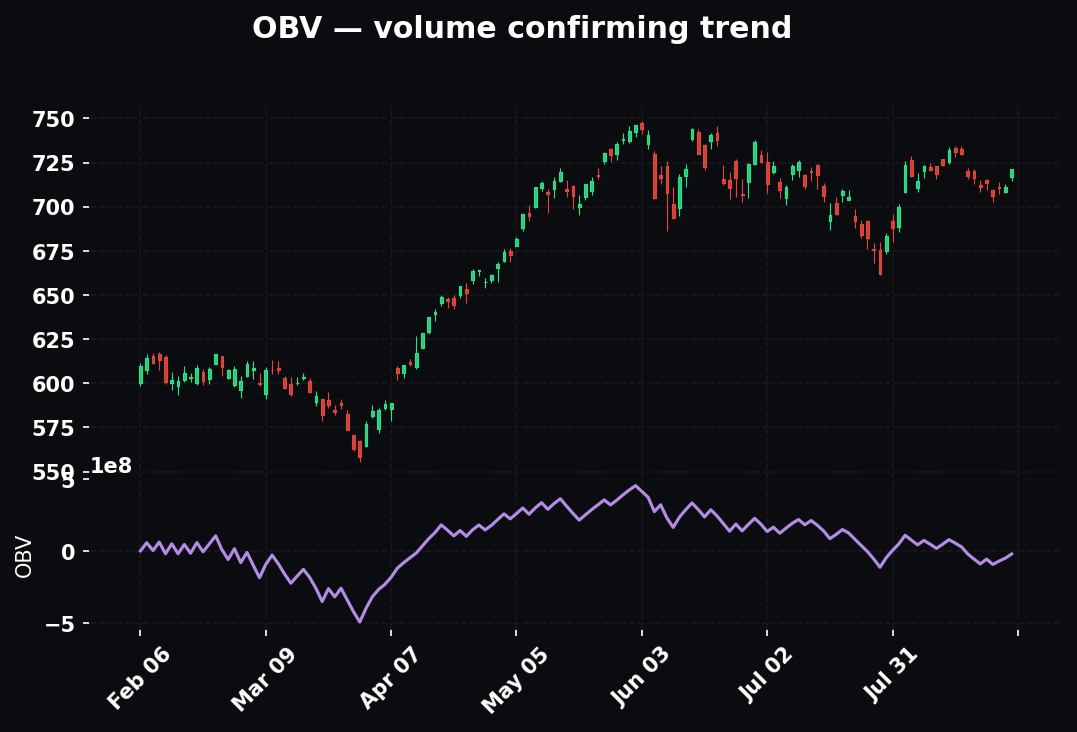
The one rule to tattoo on your brain: A real breakout comes with a jump in volume. A breakout on weak, quiet volume is a prime suspect for a fake-out.
A fake-out (also called a false breakout) is when price pokes out of a pattern, sucks people in, then snaps right back and traps them. Volume is your best early warning. If the crowd isn't showing up (low volume), don't trust the move.
The beginner mistakes to avoid (read this twice)
These are the exact errors that cost new traders money. Every one is avoidable.
1. Trading before confirmation. The number one killer. You see two peaks and short before the neckline breaks. You see a triangle and guess the direction early. Patterns are only patterns once they confirm — a candle closing beyond the key line. Anticipating feels smart; it's just gambling with extra steps.
2. Ignoring volume. You now know better. A gorgeous pattern with dead volume on the breakout is a trap dressed up nicely. Always glance at the volume bars.
3. Forcing patterns that aren't there. Stare at any chart long enough and you'll "see" a head & shoulders in random noise, the way you see animals in clouds. If you have to squint and tilt your head, it's not a clean pattern. The best ones are obvious. When in doubt, there is no trade — and no trade is a position.
4. No stop-loss. Every example above had a stop — the price where you admit you're wrong and leave. Beginners skip it, hope, and turn a $200 loss into a $2,000 one. The stop is non-negotiable. Decide it before you enter, while you're calm.
5. Chasing a move you missed. Price already broke out and ran halfway to target? Let it go. If you buy late, your stop is now far away and your reward is small — the exact opposite of what you want. There is always another setup. Missing one is free; chasing one is expensive.
6. Betting the farm on one trade. Even a perfect pattern fails a good chunk of the time. Never put so much on one idea that being wrong hurts badly. Which brings us to the ratio that governs everything.
How this fits the bigger Hollow Point picture
Patterns are a tool, not a religion. Here's how they slot into a disciplined approach.
Reward-to-risk of 1:3. Look back at the flag example: we risked about $1.70 to make about $10. That's roughly 1-to-6 — even better than our minimum. The Hollow Point standard is at least 1:3 — you aim to make at least three dollars for every one dollar you're willing to lose. Why does this matter so much? Because with 1:3, you can be wrong more often than you're right and still come out ahead. Win just 4 out of 10 trades at 1:3, and you're profitable. Patterns are useful precisely because they hand you clean entry, stop, and target numbers — which is exactly what you need to check the ratio before you trade. If a pattern's target doesn't give you at least 1:3, you skip it. The pattern is allowed to say no.
Protect capital first. Notice the order of operations in every example: we found the stop-loss before we got excited about the target. That's on purpose. Your first job is not to make money — it's to not lose too much so you're still in the game to catch the good ones. A pattern's greatest gift isn't the entry; it's the clean line that tells you when to fold.
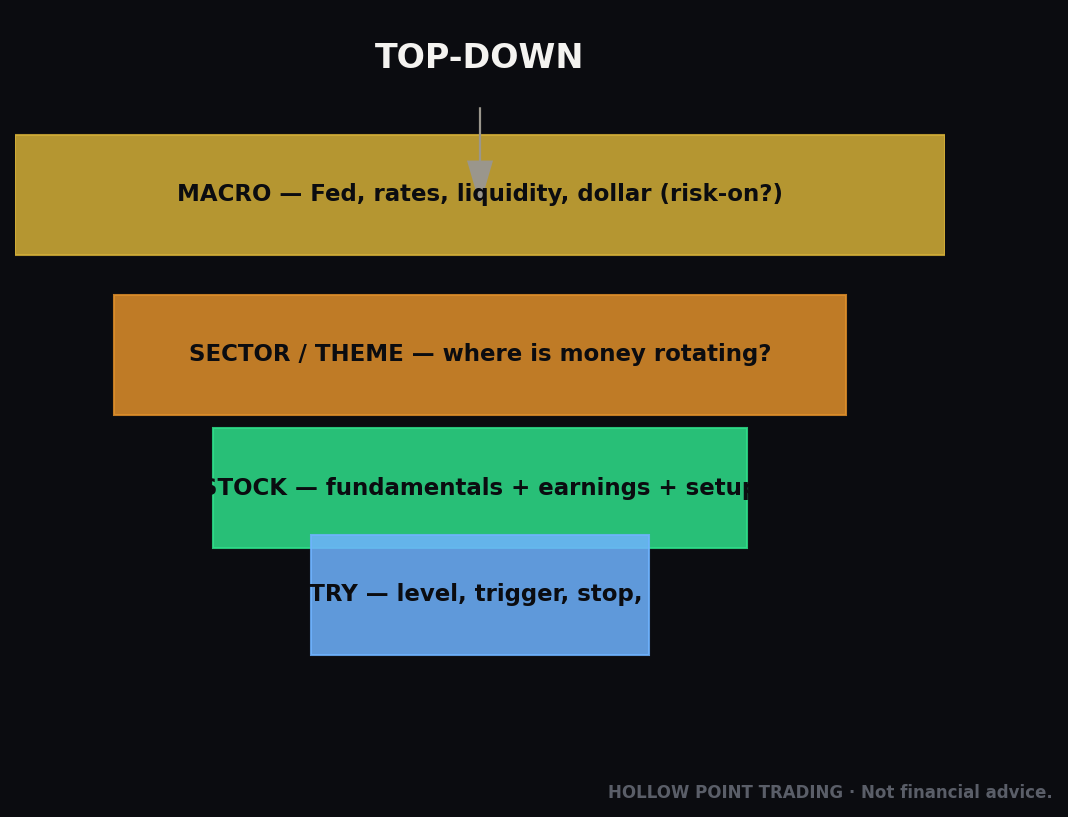
Macro, then sector, then stock. Patterns work best when the bigger picture agrees. Before trusting a bullish flag on a single stock, a disciplined trader asks: is the whole market (macro) leaning up? Is this stock's sector (say, tech or energy) strong? A great pattern swimming with the broader tide is far stronger than a great pattern fighting it. You don't need to master this on day one — just plant the idea now: top-down. The market sets the weather, the sector sets the mood, the individual stock is where you act.
Discipline over prediction. No one predicts the market. The whole point of patterns, stops, targets, and the 1:3 ratio is to stop needing to predict. You set a plan where the winners are bigger than the losers, you follow it the same way every time, and you let the math do the work over many trades. Boring, repeatable, rule-bound — that's the point. That's the edge.
Your simple pattern cheat-sheet
Print this. Tape it near your screen.
The five patterns at a glance:
- Flag — sharp move, small tidy pause, then continues the same direction. (Continuation.)
- Triangle — range squeezes tighter until it bursts out. Ascending = lean up, descending = lean down, symmetrical = wait and follow. (Usually continuation.)
- Double top (M) — two failed pushes at a ceiling → likely falls. Double bottom (W) — two holds at a floor → likely rises. (Reversal.)
- Head & shoulders — three peaks, tall one in the middle, weak right shoulder → likely falls. Inverse = flipped → likely rises. (Reversal.)
- Measured move — target = pattern height projected from the breakout.
The checklist for every single pattern trade:
- Name it. Can I clearly say which pattern this is? If I'm squinting, skip it.
- Wait for confirmation. Has a candle closed beyond the key line (breakout / neckline)? If no — no trade yet.
- Check volume. Did volume rise on the breakout? If it's dead quiet — be very suspicious.
- Mark my three numbers. Entry, stop-loss (where I'm wrong), target (measured move).
- Check the ratio. Is my reward at least 3× my risk? If no — skip it, no matter how pretty.
- Check the bigger picture. Is the pattern going with the broader trend or fighting it?
- Size it small. Would being wrong here only cost a small, planned amount? If it could hurt badly — size down.
- Set the stop the moment I enter. Not later. Now.
If a setup can't tick all eight boxes, the answer is the most powerful move a beginner owns: do nothing and wait for a better one. The market opens every day. Patience is a position.
A final word before Monday
You now know the five workhorse chart patterns, the measured move that gives every one of them a target, and the volume signature that tells you which breakouts to trust. That's genuinely more structure than most people trade with after years of winging it.
Start slow. This week, don't trade a dime — just open a chart and find these shapes on past price. Point at flags. Draw necklines on double tops. Say the names out loud. Check whether volume did what it "should" have. Train your eyes first; risk money second. When you do begin, start small enough that your tuition — because early losses are tuition — stays cheap.
The market doesn't reward the person who predicts the best. It rewards the person who follows a sound plan the most consistently, protects their capital first, and waits for the odds to line up. Patterns are how you find those odds. The rules are how you survive long enough to profit from them.
Bound by rules, feared by trade.