
Imagine you walk into a farmers market at noon. Apples have been selling all morning. Some folks paid $2 a pound early, some paid $2.20 when the good ones were still out, a few paid $1.80 near closing when the vendor wanted to clear the crate. If someone asked you, "What's the fair price of an apple today?" you wouldn't just grab the last sticker you saw. You'd want the price that reflects where most of the apples actually changed hands.
That single number — the average price weighted by how much stuff traded there — is the whole idea behind VWAP. And it happens to be one of the most-watched lines on a professional trader's screen. By the end of this guide, you'll understand it as well as they do, and you'll be able to use it Monday morning without a finance degree, without jargon, and without guessing.
Let's build it from zero.
What VWAP Actually Is (In Plain English)
VWAP stands for Volume-Weighted Average Price. Let's take that name apart one word at a time, because each word matters.
Price — that's easy. It's what a share of stock (or a contract, or a coin) is trading for at any moment.
Average — you already know this from school. Add up a bunch of numbers, divide by how many there are. If a stock traded at $10, $12, and $14, the plain average is $12.
Volume — this is the word beginners trip on, so let's nail it. Volume simply means how many shares changed hands. If 1,000 shares of a stock trade in a minute, that minute's volume is 1,000. Volume is the "how much stuff moved" number. High volume = lots of people trading. Low volume = a quiet, sleepy market.
Weighted — this is the secret sauce. A "weighted" average gives more importance to some numbers than others. VWAP gives more weight to the prices where more volume happened.
Put it together and VWAP is: the average price of everything that traded today, but with the busy prices counting more than the quiet ones.
Here's why the "weighted" part is so powerful. A plain average treats a price where 5 shares traded exactly the same as a price where 5 million shares traded. That's silly. If 5 million shares traded at $100 and only 5 shares traded at $110, the real center of gravity is way down near $100 — that's where the action was. VWAP knows this. The plain average would get fooled by the $110 outlier; VWAP barely notices it.
So think of VWAP as the market's fair-value line for the day — the price level where, on balance, the most money agreed to do business. Everyone above it (in theory) paid more than average today. Everyone below it got a relative deal.
One crucial rule you must burn into memory right now: standard VWAP resets every single day. When the market opens in the morning, VWAP starts fresh from the first trade and rebuilds itself all day long. Tomorrow, it wipes clean and starts over. This is why traders call it an intraday tool — "intraday" just means "within a single trading day." (There are longer versions we'll meet later, but the everyday VWAP is a one-day creature.)
Why a Beginner Should Care About This Line
Fair question. There are hundreds of squiggly lines you could put on a chart. Why should VWAP be one of the first you learn?
Reason one: the big money uses it, so it moves price. Here's something most beginners never get told. When a giant institution — a pension fund, a bank, a hedge fund — needs to buy a million shares, they can't just slam the buy button. That would spike the price against themselves. Instead, they buy slowly all day, and their performance gets graded against VWAP. A fund's trader is literally judged on whether they bought below VWAP (good, they got a bargain) or above it (bad, they overpaid).
Read that again, because it's the whole reason this line matters. Millions of dollars are actively trying to buy under VWAP and sell over VWAP. That creates real, repeatable behavior around the line. When you watch VWAP, you're watching the same benchmark the whales are being graded against. You're not using a magic indicator — you're standing where the elephants drink.

Reason two: it answers a question you'll ask constantly. Every trader, all day, is silently asking: "Is this cheap or expensive right now?" VWAP gives you a fast, honest, no-opinion answer. Price above VWAP? The average buyer today is underwater relative to now — the day leans strong, and dips toward the line are where value-buyers step in. Price below VWAP? The day leans weak, and pops back up to the line are where sellers wake up. It's a instant read on who's winning the day, bulls or bears.
Reason three: it's objective. VWAP is pure math. It has no opinion, no feelings, no lag from a setting you fiddled with. Two traders looking at the same stock see the exact same VWAP. That makes it a shared reference point — like everyone agreeing on where the 50-yard line is. In a game full of noise and guessing, having one honest, math-only line is a gift for a beginner.
Reason four: it keeps you humble. New traders love to predict. VWAP quietly retrains you to react. Instead of "I think this goes up," you learn to say "price is above VWAP and holding — the evidence says buyers are in control right now." That shift, from predicting to reading evidence, is the single biggest mental upgrade a beginner can make, and VWAP teaches it naturally.
How VWAP Works, Step by Step
You will never calculate VWAP by hand in real trading — your charting software does it automatically. But you must understand the recipe, because understanding it is what stops you from misusing it. Let's walk through it slowly with tiny, friendly numbers.
VWAP is built one time-slice at a time. Let's use one-minute slices. For each minute, we do three little things:
Step 1 — Find the "typical price" of that minute. Each minute has a high, a low, and a close (the last price of the minute). The typical price is just the average of those three:
Typical Price = (High + Low + Close) ÷ 3
If a minute had a high of $10.20, a low of $10.00, and closed at $10.10, the typical price is (10.20 + 10.00 + 10.10) ÷ 3 = $10.10. This is our best single guess for "where did this minute mostly trade?"
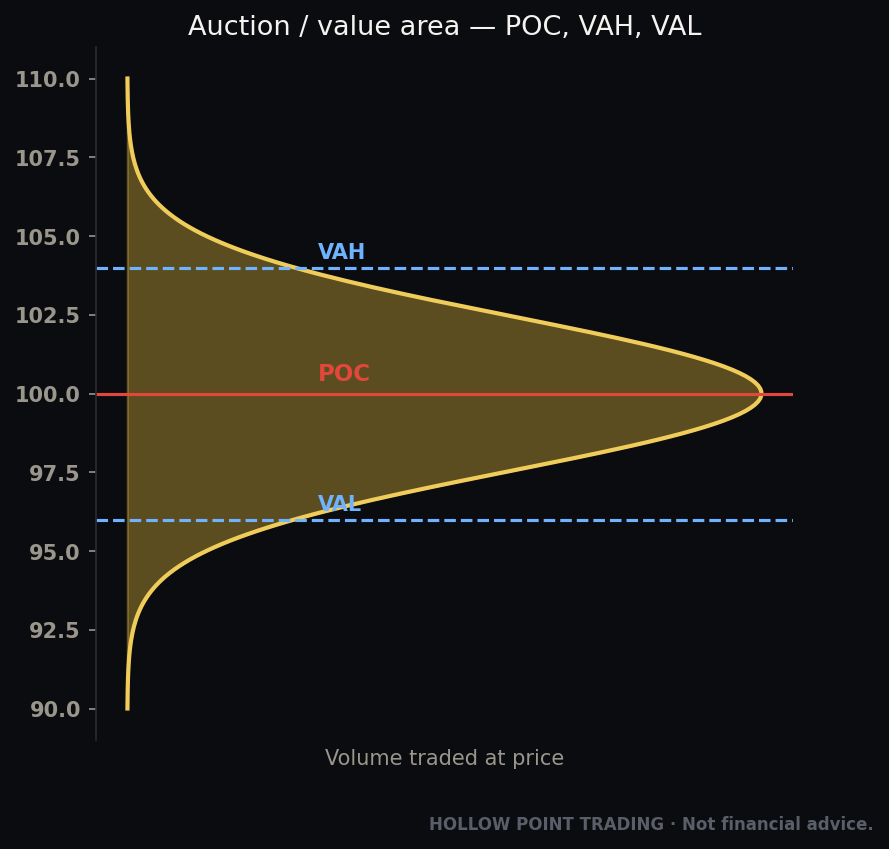
Step 2 — Multiply that typical price by the minute's volume. This is the "weighting." We're asking, "how many dollars of importance does this minute get?" If that minute traded 1,000 shares, then 10.10 × 1,000 = 10,100. Think of it as this minute casting 10,100 "votes" for the $10.10 area.
Step 3 — Keep a running total and divide. As each minute passes, we keep two running tallies: the total of all those price×volume numbers, and the total of all the volume. VWAP at any moment is simply:
VWAP = (running total of price × volume) ÷ (running total of volume)
That's it. That's the whole engine. Let's watch it come alive.

Watching VWAP build across four minutes
Say a stock opens and we track four minutes.
Minute 1: typical price $10.00, volume 1,000 shares.
- Price × volume = 10.00 × 1,000 = 10,000
- Running price×volume total = 10,000
- Running volume total = 1,000
- VWAP = 10,000 ÷ 1,000 = $10.00
Makes sense — one minute in, VWAP just equals that minute.
Minute 2: typical price $10.20, volume 3,000 shares. Notice the big volume here.
- Price × volume = 10.20 × 3,000 = 30,600
- Running price×volume total = 10,000 + 30,600 = 40,600
- Running volume total = 1,000 + 3,000 = 4,000
- VWAP = 40,600 ÷ 4,000 = $10.15
Even though price jumped to $10.20, VWAP only rose to $10.15 — but notice it moved most of the way up, because that minute was heavy (3,000 shares). The busy minute pulled harder.
Minute 3: typical price $10.05, volume 500 shares. A quiet little dip.
- Price × volume = 10.05 × 500 = 5,025
- Running price×volume total = 40,600 + 5,025 = 45,625
- Running volume total = 4,000 + 500 = 4,500
- VWAP = 45,625 ÷ 4,500 = $10.14 (rounded)
Price dipped to $10.05, but VWAP barely budged, dropping only a penny to $10.14. Why? Because only 500 shares traded on that dip — it was a quiet move, so VWAP shrugged it off. This is the whole magic in one line: VWAP ignores quiet moves and respects loud ones.

Minute 4: typical price $10.30, volume 5,000 shares. A big, heavy push up.
- Price × volume = 10.30 × 5,000 = 51,500
- Running price×volume total = 45,625 + 51,500 = 97,125
- Running volume total = 4,500 + 5,000 = 9,500
- VWAP = 97,125 ÷ 9,500 = $10.22 (rounded)
Now VWAP climbs meaningfully to $10.22, because a huge 5,000-share minute pushed price up. Big volume, big influence.
See what happened over four minutes? Price bounced around from $10.00 to $10.20 to $10.05 to $10.30, but VWAP smoothly walked from $10.00 to $10.22, leaning toward wherever the heavy trading happened and ignoring the light stuff. That smooth, honesty-weighted line is what you'll see draped across your chart.

Now here's a subtle but important beginner insight. Notice that early in the day, VWAP moved a lot with each new minute. By minute four, each new minute moved it less. That's because the running volume total keeps growing — later in the day there's so much accumulated volume that one new minute can't yank the line around. So VWAP is jumpy in the morning and steady in the afternoon. Early on, treat it gently; by lunchtime, it's a heavy, reliable anchor. Beginners who don't know this get faked out by a wild 9:35am VWAP that means very little yet.
A Fully Worked Beginner Example: A Day With "Zeta"
Let's put it all together with a made-up stock called Zeta, so you can see how you'd actually think with VWAP during a live day. (Numbers are illustrative, to teach the mechanics — not a real stock.)
9:30am — the open. Zeta opens at $50.00. VWAP is basically sitting right at $50.00 because we're one minute in. There's no useful signal yet. A disciplined beginner does nothing here — the line hasn't earned trust. You just watch.

9:45am. Buyers show up in size. Zeta pushes to $50.80 on strong volume, and VWAP has risen to $50.40. Price is now clearly above VWAP. What does that tell you in plain English? The average buyer today is sitting on a small gain, and the day is leaning bullish (bullish just means "leaning up / buyers in charge"). You now have a bias: today, you'd rather look for reasons to buy dips than to short.
10:15am. Zeta pulls back. It drifts down toward $50.45 and touches the VWAP line at $50.42. Volume on the pullback is light — few shares changing hands. This is the moment VWAP shines. Price has come back to the "fair value" line on quiet volume, in an up-leaning day. This is exactly the spot where those institutions grading themselves against VWAP like to buy, because they're getting the stock at fair value or better. A beginner watching sees: price tested VWAP from above and buyers defended it. That's a textbook "VWAP bounce."
10:30am. Zeta bounces off VWAP and climbs back to $51.00. The defense of the line worked. If you'd bought near $50.45 with a protective exit just under VWAP (say $50.20), you risked about $0.25 to potentially make far more as price ran. Hold that thought — we'll connect it to HPT's reward-to-risk rule shortly.
12:30pm — lunchtime lull. Volume dries up. Zeta chops sideways right around VWAP, crossing back and forth: $50.90, $50.75, $50.95. Here's a beginner trap you must know: around midday, price often glues itself to VWAP and whipsaws. Crossings during a dead, low-volume lunch are noise, not signal. The best traders often just step away. VWAP is most trustworthy when volume is healthy — the open and the last hour — and least trustworthy in the sleepy middle.

2:00pm — the character change. Now something different happens. Zeta breaks below VWAP on a surge of heavy volume, dropping to $50.20 while VWAP sits at $50.60. Price is now below the fair-value line, and it happened on big volume — that's meaningful. The story of the day just flipped: the average buyer is now underwater, and sellers have taken control. Your bias should flip with it. The dips-buying idea from this morning is dead. Now, rallies back up to VWAP become the spot where sellers may re-load.
2:20pm. Sure enough, Zeta pops back up to $50.55, kisses the underside of VWAP at $50.58, and rolls over — rejected. Price failed at the line from below. That's the mirror image of this morning's bounce: earlier VWAP was a floor holding price up; now it's a ceiling pressing price down. Same line, opposite job, depending on which side price is living on. This flip — support becoming resistance — is one of the most useful things VWAP will ever show you.

3:55pm — the close. Zeta drifts into the bell at $50.30, below VWAP, closing the day weak. Tomorrow at 9:30, VWAP erases itself and starts fresh from Zeta's first trade. None of today's line carries over. Clean slate.
Walk back through Zeta's day and notice what VWAP gave you without a single prediction: a bias (above = lean long, below = lean short), specific spots to act (tests of the line), a bias flip when character changed (the heavy break below), and a place to be wrong (the line itself). That's a full framework from one honest math line.
The Beginner Mistakes to Avoid
Every new trader burns money on the same VWAP mistakes. Here's how to skip the tuition.
Mistake 1: Treating VWAP as a buy/sell button. VWAP is not a signal that screams "buy now." It's a reference line that tells you which side of fair value you're on. "Price crossed VWAP, so I buy" is how beginners get chopped to pieces, especially at lunch. VWAP sets your bias and marks spots to watch — you still need confirmation (a bounce, a rejection, a candle pattern) before you act.
Mistake 2: Trusting VWAP in the first few minutes. As we saw, VWAP is wild and meaningless right at the open because there's almost no volume behind it yet. Give it time to gather weight — usually the first 15–30 minutes — before you lean on it.
Mistake 3: Ignoring volume. This is the big one, and it's ironic given VWAP is built from volume. A test of VWAP on heavy volume is a real fight worth respecting. A test on dead volume is often just drift. Always ask: "Is this move to the line loud or quiet?" A bounce off VWAP means far more when real volume shows up to defend it.
Mistake 4: Forgetting the daily reset. Beginners sometimes look at a VWAP line and think it's been building for a week. Standard VWAP is a one-day tool. If you want a multi-day reference, you need an anchored VWAP (coming up next) — but never confuse the two.
Mistake 5: Using VWAP naked, with no bigger context. VWAP tells you about today. It knows nothing about the major weekly support level sitting just below, or the fact that the whole sector is falling apart. VWAP is one instrument in the orchestra, not the whole symphony. We'll place it properly in the HPT picture at the end.

Mistake 6: Fighting a strong trend at VWAP. On a powerful trending day, price can ride far above VWAP for hours and never come back to touch it. Beginners keep shorting into strength expecting a "return to VWAP" that never comes, and get run over. If price is trending hard and refusing to even revisit the line, that is the signal — the trend is strong. Respect it; don't fade it just because it's "far from fair value."
Mistake 7: Overloading the chart. New traders slap on VWAP plus ten other indicators and freeze. Start simple: price, volume, and VWAP. Learn to read that clean picture first. Complexity can come later, once the basics are second nature.
A Quick Word on "Anchored" VWAP (Bonus, But Worth It)
Once the daily VWAP makes sense, there's a close cousin worth knowing: Anchored VWAP (AVWAP). Regular VWAP always starts at the day's open. Anchored VWAP lets you pick the starting point — you "anchor" it to a specific important bar, like a huge earnings gap, a major low, or the start of a big rally, and it calculates the volume-weighted average from that moment forward, across many days.
Why care? Because it answers a rich question: "Since that big event, is the average buyer winning or losing?" Anchor a VWAP to a stock's earnings pop, and if price stays above it for weeks, everyone who bought since that news is, on average, in profit — a sign of real strength. Anchor it to a crash low, and watch price reclaim it as a sign the tide turned. It's the same math you already learned; you just get to choose when the clock starts. You don't need it on day one, but file it away — it's one of the most professional tools you can graduate into.
Your Simple VWAP Cheat-Sheet
Print this. Tape it to your monitor. This is everything above, boiled to the bone.
What it is
- VWAP = the day's average price, weighted so busy prices count more than quiet ones.
- It's the market's honest "fair value" line for today.
- It resets to zero every morning at the open.
The one-glance read
- Price above VWAP → day leans bullish, prefer buying dips to the line.
- Price below VWAP → day leans bearish, prefer selling rallies to the line.
- Price glued to VWAP → no edge, especially at lunch. Stand aside.
When to trust it
- Trust it MORE: after the first 30 minutes, and during high-volume periods (open, power hour).
- Trust it LESS: in the first few minutes, and during the low-volume midday lull.
How to actually use it (the beginner routine)
- Mark your bias: which side of VWAP is price on?
- Wait for price to come to the line — don't chase it away from the line.
- Check the volume of that test: loud = respect it, quiet = be skeptical.
- Wait for confirmation: a bounce (if above) or a rejection (if below).
- Decide where you're wrong — usually just past the VWAP line — before you enter.
- Make sure your potential reward is at least 3× that risk. If not, pass.
Red flags (don't trade)
- It's the first 5 minutes.
- It's dead lunchtime chop across the line.
- Price is trending hard and refusing to return to VWAP (don't fade it).
- You can't clearly say where you'd be wrong.
How VWAP Fits the Bigger Hollow Point Picture
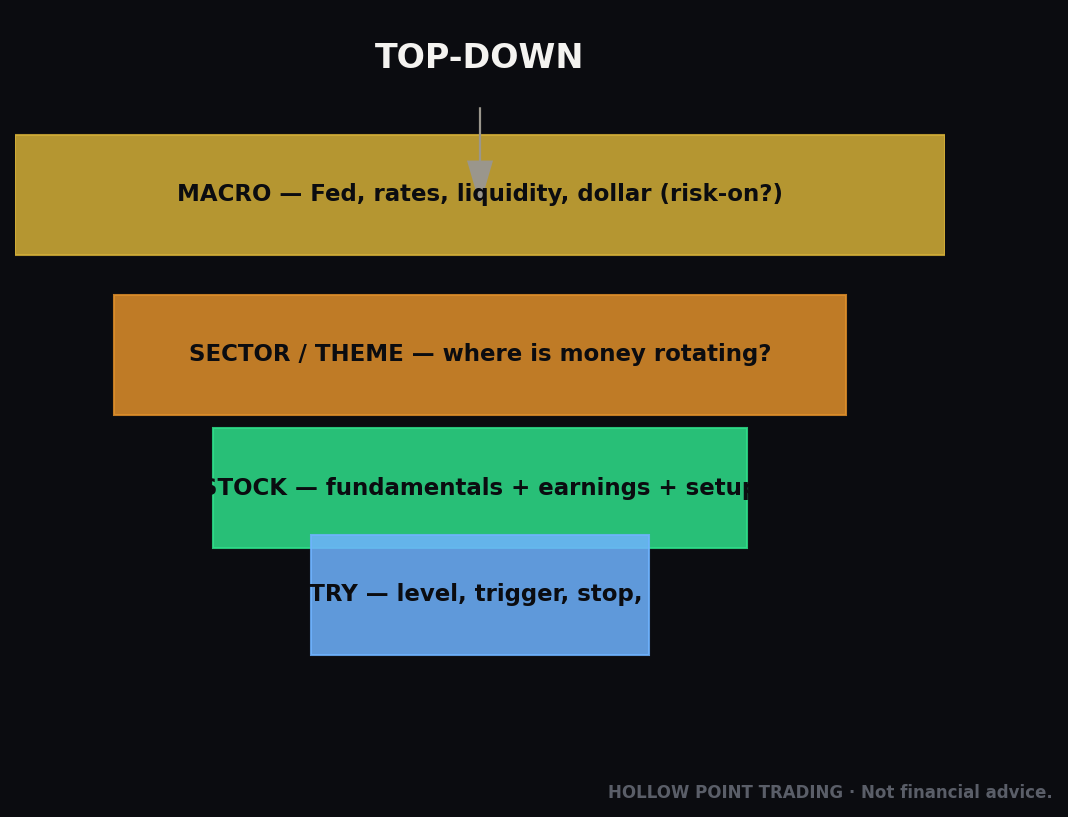
Here's the part that turns a line on a chart into actual, durable skill. At Hollow Point Trading, we don't hunt for one magic indicator. We work top-down: macro → sector → stock. That means we first ask what the whole market is doing (macro), then what the stock's neighborhood — its sector — is doing, and only then do we zoom into the individual stock. VWAP lives in that final, zoomed-in step. It's a superb intraday tool for timing your entry once the bigger picture already agrees with you.
Think of it like this. Macro and sector tell you which direction the river is flowing. VWAP tells you where the calm, fair-value spots are to step into that river today. If the whole market is strong and the sector is leading and your stock is above its VWAP — now those pullbacks to the line are gorgeous, because three layers agree. But if the market's falling apart and you're buying a VWAP bounce anyway, you're paddling upstream. VWAP is a timing tool, not a direction decider. Never let a pretty intraday line talk you into fighting the macro river.
This connects to the second HPT pillar: discipline over prediction. Notice we never once "predicted" what Zeta would do. We read which side of fair value price was on and reacted to how it behaved at the line. That's the whole game. VWAP is a discipline machine — it hands you an objective, math-only reference so your decisions come from evidence, not hope. When price loses VWAP on heavy volume, you don't argue with it; you flip your bias. The market talks; you listen.
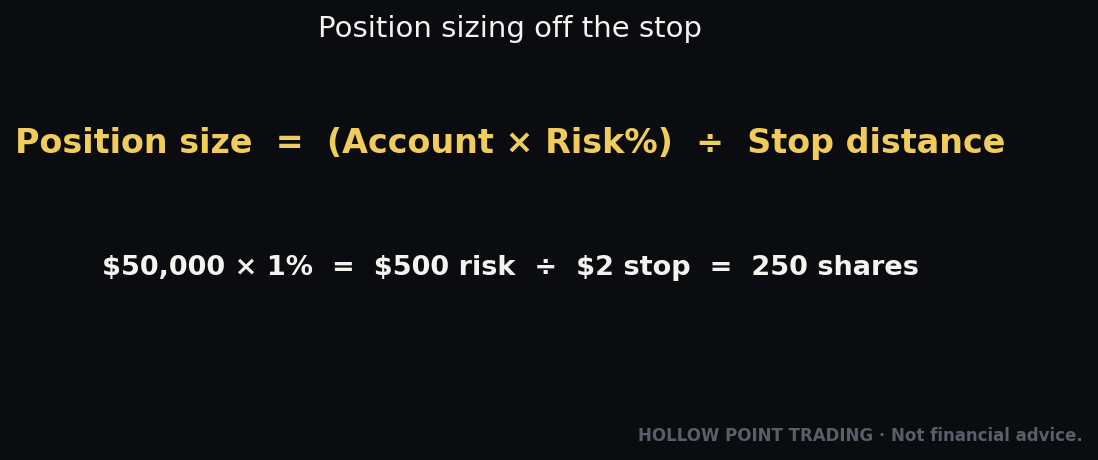
Third pillar: protect capital first, and demand at least 1:3 reward-to-risk. Remember Zeta's 10:15am bounce — buying near $50.45 with a protective exit just under VWAP at $50.20. That's $0.25 of risk. HPT's rule says you don't take that trade unless the realistic reward is at least three times that risk — here, at least $0.75 of upside, targeting roughly $51.20 or better. This is why VWAP pairs so beautifully with our system: the line gives you a natural, tight, objective place to be wrong (just past VWAP), which keeps your risk small, which is exactly what makes a 1:3 or better trade possible. A tight, honest stop is the foundation of good reward-to-risk, and VWAP hands you one for free.
So here's your homework, beginner. Don't rush to trade VWAP with money. First, just watch it for a week or two. Pull up any liquid stock or index, add VWAP and volume, and each day narrate the story to yourself: "We opened here, buyers took us above VWAP, we came back and tested it on light volume and bounced, then at 2pm we lost it on heavy volume and rolled over." Do that until reading the line is automatic. Then, and only then, start layering it into the full HPT framework — macro river first, sector second, VWAP timing last, risk defined at the line, reward at least triple.
Master this one honest line, and you'll have something most beginners never get: a way to see, in real time, where the smart money thinks fair value is — and the patience to wait for price to come to you.
Bound by rules, feared by trade.