
If you have ever opened a price chart and felt your stomach drop, you are not alone. It looks like static. Hundreds of little red and green bars, jittering up and down, going nowhere and everywhere at once. Where do you even start?
You start here. With a single, gentle curved line laid over the top of all that noise. It is called a moving average, and it is the closest thing beginners have to a pair of glasses that suddenly bring the whole blurry mess into focus.
By the end of this guide you will know exactly what that line is, where it comes from, why Hollow Point Trading uses three specific ones — 12, 22, and 55 — and how to use them on Monday morning to answer the two questions that matter most when you are new: which way is this thing going, and where might it be safe to lean. No finance degree required. We define every word the first time we use it. Let's go.
What a moving average actually is (in plain English)
Let's kill the jargon before it can hurt you.
A moving average is just the average price of something over the last several bars, recalculated every time a new bar shows up. That's it. That's the whole idea.
You already know what an average is. If your last five test scores were 80, 90, 70, 100, and 60, you add them up (400) and divide by how many there are (5) and you get 80. Eighty is the average. It's a single number that smooths out the ups and downs and tells you roughly where the middle is.
A moving average does the exact same thing, but with price instead of test scores, and it does it over and over as time passes. Imagine standing at the back of a train and dropping a marker every few seconds that shows the average position of the last ten seconds of track. As the train moves, your marker moves too — always trailing a little behind, always smoother than the bumpy track itself. That trailing marker is your moving average. It "moves" because it recalculates with every new moment. It "averages" because each point is the mean of a chunk of recent prices.
Here is why that smoothing is a gift. Raw price is emotional. It spikes on a scary headline, dips when a big seller dumps, jumps when a rumor hits. A lot of that motion is just noise — random wiggle that means nothing for the bigger picture. The moving average quietly ignores most of it and shows you the underlying drift, the direction the crowd is actually leaning over time. It answers the question a beginner most needs answered: forget the last five minutes of panic — where is this really headed?
Two quick vocabulary words and then we build one by hand.
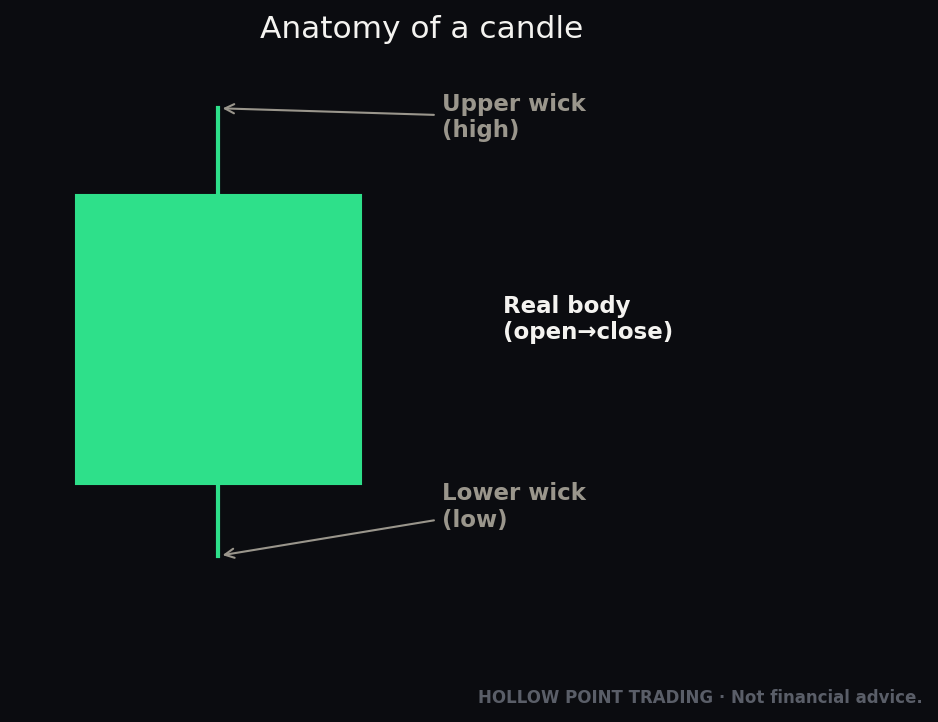
A bar (or candle) is one chunk of time on your chart. If you're on a "5-minute chart," each bar is five minutes of trading squished into one shape. Each bar has a close — the price at the very last instant of that time chunk. The close is the number moving averages care about most, because it's where the fight between buyers and sellers finished for that period.
The length or period of a moving average is how many bars it averages. A "20-period moving average" averages the last 20 closes. A shorter length (like 12) hugs price tightly and reacts fast. A longer length (like 55) sits farther away and reacts slowly, like a big ship that takes time to turn.

SMA versus EMA: the two flavors, and why HPT picks one
There are two common recipes for a moving average, and you'll see both names everywhere, so let's define them clearly.
The Simple Moving Average (SMA) is the plain version we just did with the test scores. Add up the last N closes, divide by N. Every bar in the window counts exactly the same. The close from 20 bars ago matters just as much as the close from one bar ago. Simple, honest, a little slow.
The Exponential Moving Average (EMA) is the smarter cousin. It does the same basic job — average the recent closes — but it gives more weight to the most recent bars and less weight to the older ones. Think of it as an average with a better memory of now. The most recent close gets the loudest vote; the vote gets quieter and quieter as you look further back, fading out exponentially (that's where the fancy name comes from). Because it leans on fresh prices, the EMA turns and reacts a little faster than the SMA. For a trader trying to catch shifts early, that responsiveness is worth a lot.
Here's the intuition without the scary math: an EMA basically takes yesterday's EMA and nudges it a little toward today's new close. If price is climbing, each nudge pulls the line up. If price is falling, each nudge tugs it down. The nudge is bigger for shorter lengths (fast, twitchy) and smaller for longer lengths (calm, steady).
Hollow Point Trading uses EMAs. When you see us write "the 12," "the 22," or "the 55," we mean the 12-period EMA, the 22-period EMA, and the 55-period EMA. We choose exponential over simple because markets reward you for noticing a change in weather a few bars sooner, and the EMA's fresher memory does exactly that. You don't need to calculate any of this yourself — your charting software draws it instantly. But understanding why the line bends the way it does is what separates a trader from someone gambling on squiggles.
Why a total beginner should care about this line
Fair question. You have limited time and a hundred tools to eventually learn. Why start here?
Because trend is the single biggest edge a beginner has, and the moving average is how you see trend. Almost every painful rookie mistake comes down to fighting the direction the market is already going — buying something that's falling because it "looks cheap," or shorting something that's ripping higher because it "has to come down." A moving average makes the direction visible at a glance, so you can stop fighting it. There's an old market saying: the trend is your friend. The moving average is how you find out who your friends are.
Because it gives you a place to act instead of a feeling to act on. New traders tend to enter on emotion — excitement, fear of missing out, panic. A moving average replaces the feeling with a location. Instead of "I feel like buying," you get "price pulled back to the 22 EMA and held — that's a defined spot with a defined risk." That shift, from feelings to locations, is the beginning of real discipline.
Because it hands you a built-in exit before you ever enter. As you'll see, the line doesn't just tell you where to get in — it tells you the price where your idea is wrong. Knowing where you're wrong before you start is the whole game. It's how you protect your money, which at Hollow Point Trading is job number one. You cannot make money next month if you blow up your account this month.
Because everyone else is watching it too. Millions of traders and their algorithms watch popular moving averages. When a lot of eyes expect price to bounce at a certain line, their buying can make it bounce. The moving average is partly a self-fulfilling prophecy — and as a beginner, standing where the crowd is looking is far safer than standing somewhere only you can see.
How it works, step by step
Let's build a moving average with our own hands so it stops being magic. We'll use a tiny 3-period example so the numbers stay friendly. In real life you'd use 12, 22, or 55, but the machinery is identical — just more numbers.
Imagine a stock closes on five days like this:
- Day 1 close: $10
- Day 2 close: $12
- Day 3 close: $14
- Day 4 close: $13
- Day 5 close: $16
Step 1 — pick your length. We'll use a 3-period simple moving average (3 SMA) first, because simple is easiest to hand-calculate. We need at least 3 days of data before we can plot our first point.
Step 2 — average the first full window. The first three closes are 10, 12, 14. Add them: 36. Divide by 3: 12. So on Day 3, our 3 SMA equals 12. Plot a dot at $12.
Step 3 — slide the window forward one bar. Now drop the oldest price and add the newest. For Day 4, the window is Days 2, 3, 4: that's 12, 14, 13. Add: 39. Divide by 3: 13. Plot a dot at $13 on Day 4.
Step 4 — keep sliding. For Day 5, the window is Days 3, 4, 5: 14, 13, 16. Add: 43. Divide by 3: about 14.33. Plot a dot on Day 5.
Connect those dots — 12, then 13, then 14.33 — and you have a rising line. Notice it climbs more gently than the raw price, which jumped from 10 to 16. That gentleness is the smoothing at work. The line is telling you "the underlying drift is up," without getting yanked around by the Day 4 dip to $13.
Now, the EMA. You won't hand-calculate this often, but here's the honest shape of it so you trust the line. The EMA takes yesterday's EMA value and adds a fraction of the gap between today's close and that old value. If our EMA was sitting at 12 and today's close is 16, the EMA doesn't leap to 16 — it steps part of the way, maybe to 13. Tomorrow it steps part of the way again. It's always chasing price, never quite catching it, leaning closer to the recent action than a simple average would. Shorter lengths chase harder (bigger steps); longer lengths chase gently (smaller steps). That's the entire difference in feel between the 12 and the 55.
The beautiful part: your software does all of this instantly. You will never do this arithmetic in the heat of a trade. But now when the 12 EMA snaps upward while the 55 EMA barely budges, you'll know exactly why — the short one has a fast memory, the long one has a patient one.
Meet the HPT stack: 12, 22, and 55
Hollow Point Trading doesn't throw a dozen random lines on the chart. We use three EMAs, and each one has a job. Think of them as three runners of different sizes moving down the same track.
The 12 EMA — the sprinter. Short and twitchy. It hugs price closely and reacts within a handful of bars. Its job is to show you the immediate, short-term momentum — what the market is doing right now, this hour, this session. When the 12 is pointed up and price is riding along the top of it, the near-term energy is bullish (buyers in control). When it rolls over, the short-term mood just soured.
The 22 EMA — the pacer. The middle runner. It's slow enough to ignore most noise but fast enough to stay relevant to your trade. This is often the line beginners lean on most for dynamic support and resistance (we'll define that in a second). In a healthy trend, price frequently dips back to the 22, touches it like a runner tagging a wall, and pushes off again. It's the heartbeat of the move.
The 55 EMA — the referee. The slow, heavy, patient line. It barely reacts to any single bar. Its job isn't to be fast — it's to tell you the real bias, the big-picture direction that all the short-term chop is happening inside of. At Hollow Point Trading, the 55 is the tell. On the daily chart especially, the slope and side of the 55 EMA is our headline read of trend. Price above a rising 55 = the big weather is fair. Price below a falling 55 = storm season, be careful, favor the downside. The 55 doesn't get you in early; it keeps you honest about which way you should be leaning in the first place.
Why these exact numbers instead of the more famous 9, 21, 50, and 200 you'll see elsewhere? Because HPT tested them against the tape we actually trade and found this trio gave the cleanest read for our style — 12 and 22 catch the working move, 55 defines the bias, and the three of them together form a "stack" whose order tells a story. Which brings us to the most important beginner concept in this whole guide.
Reading the stack: the single most useful trick
Forget every individual line for a second. The magic is in the order of the three lines from top to bottom. We call that order the stack.

Bullish stack (healthy uptrend): the fast line is on top, the slow line is on the bottom. From high to low on the chart: 12, then 22, then 55, all sloping up, price riding above all three. Picture the runners in order — sprinter out front, pacer behind, referee trailing. When you see this, the market is saying everything agrees, up is the path of least resistance. For a beginner, this is the friendliest picture there is. You look for chances to buy pullbacks, not to short.
Bearish stack (healthy downtrend): the exact mirror. Slow line on top, fast line on the bottom: 55, then 22, then 12, all sloping down, price below all three. The crowd is leaning down. You look for chances to sell rallies, not to buy the dip.
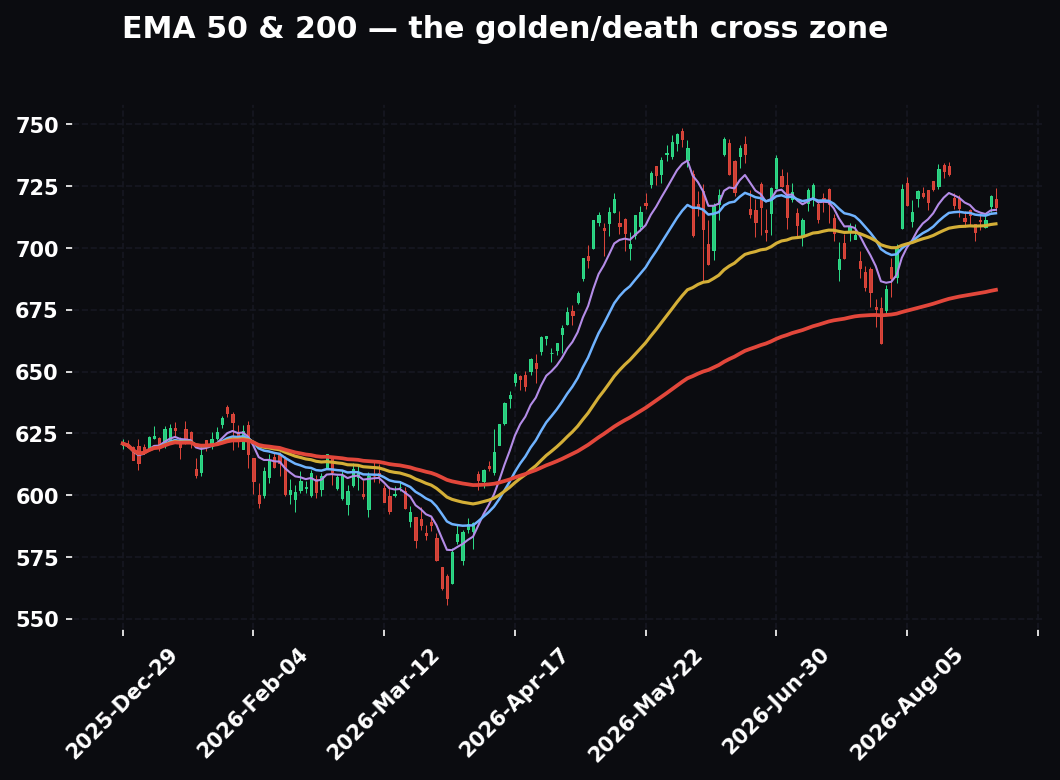
Tangled stack (no trend — danger zone): the three lines are crossing over each other, weaving, flat, hugging together like earbuds in your pocket. This is a market with no agreement. Nobody's in charge. For a beginner, this is the single most important picture to recognize, because it's where accounts go to die. When the lines are tangled, the honest read is "I don't have an edge here," and the professional move is to do nothing. Discipline over prediction. You are not paid to trade every minute; you're paid to trade the clear ones.

That's it. Three states. Stacked up, stacked down, or tangled. Learn to name which one you're looking at in under two seconds and you're already ahead of most people who've been staring at charts for a year.
Dynamic support and resistance: the moving floor and ceiling
Now the second superpower, and the source of that "where might it be safe to lean" answer.
First, definitions. Support is a price level where falling prices tend to stop and bounce — think of it as a floor. Resistance is a price level where rising prices tend to stall and turn back — a ceiling. Beginners usually learn these as flat horizontal lines. But here's the thing: a moving average can act as support and resistance too — a floor or ceiling that moves, sliding along under (or over) price as the trend rolls forward. That's why we call it dynamic support and resistance. "Dynamic" just means "moving," as opposed to a "static" flat line.

In a bullish stack, the moving averages — especially the 22 EMA — act as a moving floor. Price runs up, gets tired, pulls back down, kisses the 22, and buyers step in right there and shove it back up. It happens again and again in a strong trend. Each of those touches is a dynamic support test. For a beginner, those pullback-to-the-line moments are the cleanest, lowest-stress spots to consider getting long, because you have a very specific place where you're wrong: just below the line.
In a bearish stack it flips. The moving averages become a moving ceiling. Price sinks, bounces weakly, rallies up into the 22 EMA from below, sellers appear, and it rolls back down. Those are dynamic resistance tests — the cleaner spots to consider getting short in a downtrend.
Why does this happen at all? Partly because so many traders watch these lines and place their orders there — the bounce becomes real because everyone expects it. And partly because a trend that keeps respecting its moving average is, by definition, a healthy trend. The day price slices clean through the line and keeps going is the day the trend is telling you something changed. That break is information, not just an annoyance.
Crosses: when the lines trade places
A cross (or crossover) is exactly what it sounds like — one moving average line crossing over another. Crosses are how the stack changes state, and they're among the first tradeable signals a beginner can actually name.

When a faster line crosses up through a slower line — say the 12 EMA climbs above the 55 EMA — that's a bullish cross. It's a sign that short-term momentum has flipped strong enough to start pulling the bigger trend upward. The famous version of this on a daily chart, where a medium average crosses above a long one, even has a nickname you'll hear on financial TV: the golden cross. It's a classic "the tide may be turning up" signal.
When a faster line crosses down through a slower line — the 12 dropping below the 55 — that's a bearish cross, a hint that momentum has turned down hard enough to threaten the trend. Its famous nickname is the death cross. (Dramatic, we know. Traders love a nickname.)
Here is the beginner's honest truth about crosses, and please tattoo it on your brain: crosses are late. Because a moving average is built from past prices, a cross only confirms a move that already started. It's a rear-view mirror, not a windshield. You will sometimes get a cross right as the move exhausts itself, which produces a whipsaw — a false signal that flips you the wrong way just before price reverses and stops you out. Whipsaws happen most in that tangled, no-trend market we told you to avoid. Which is exactly why HPT doesn't trade crosses in isolation. A cross is a clue, strongest when it agrees with the bigger 55 EMA bias and lines up with a clean pullback. One clue is never a trade. Confluence — several clues agreeing — is a trade.
A fully worked beginner example
Let's put every piece together in one slow, imaginary trade. Numbers are made up and rounded to keep it clean. Follow the reasoning, not the digits.
The setup. You pull up a stock — call it ABC — on the daily chart, meaning each candle is one day. You drop on the HPT stack: 12, 22, and 55 EMA.
Step 1 — read the bias with the 55. ABC is trading at $102. The 55 EMA is at $95 and clearly sloping up. Price is above a rising 55. Big-picture read: bullish. I will look for longs, not shorts. This is the macro-to-micro discipline in miniature — you set the big weather first, and only then hunt for a specific spot.

Step 2 — check the stack. From top to bottom the lines read 12 ($100), then 22 ($98), then 55 ($95), all rising. That's a clean bullish stack. Everything agrees. Green light to keep looking.
Step 3 — wait for the pullback to the line. You do not chase ABC at $102 just because it's going up. Buying extended, far above the lines, is a classic rookie error — you'd be buying right where a pullback is most likely. Instead you wait. Two days later ABC dips to $98 and taps the 22 EMA — the moving floor. A green candle forms right on the line and closes back up at $99. That's a dynamic support test that held. This is your spot.

Step 4 — define where you're wrong BEFORE you enter. If the 22 EMA is real support, price should not close decisively below it. You decide: if ABC closes below $96 (comfortably under the line and the recent low), your idea was wrong and you're out. That $96 is your stop-loss — the pre-planned exit that caps your loss. Entry $99, stop $96. Your risk is $3 per share. You never, ever skip this step. Protecting capital comes before dreaming about profit.
Step 5 — set a target using 1:3. Hollow Point Trading wants at least three dollars of potential reward for every one dollar of risk — a 1:3 reward-to-risk ratio. You risked $3, so your first target is $9 of reward: entry $99 plus $9 equals a $108 target. Now the trade has a full shape: in at $99, out-and-wrong at $96, out-and-right at $108.
Step 6 — manage with the line. As ABC grinds from $99 toward $108, the whole stack rises under it. Some traders trail their stop up behind the 22 EMA — as the floor rises, so does the price where they'd admit they're wrong, locking in gains. If ABC eventually loses the 22 and the 12 crosses down through it, that's your sign the healthy trend is cracking and it's time to respect the exit.
Notice what the moving averages did in this trade: they told you the bias (55), confirmed agreement (stack), handed you an entry (pullback to the 22), defined your risk (below the line), and even helped you manage the exit (trailing the 22). One tool, the whole skeleton of a disciplined trade. That's why we start beginners here.
The beginner mistakes to avoid
Every trader makes these. You can skip the tuition by learning them now.
Mistake 1 — trading the tangle. When the lines are crossed up and flat, there is no trend and no edge. Beginners force trades here out of boredom and get chopped to pieces. The fix: name the state first. Tangled? Hands off.
Mistake 2 — chasing price far from the line. Buying when price is stretched way above the 12 EMA feels safe because it's "going up," but you're buying right before the snap-back. The fix: wait for the pullback to the line. Patience is a position.
Mistake 3 — treating a cross as gospel. A golden cross alone is not a trade. Crosses are late and whipsaw in choppy markets. The fix: only weight a cross when it agrees with the 55 bias and a clean setup. Confluence, never a lone signal.
Mistake 4 — expecting a precise bounce to the penny. Moving averages are zones, not lasers. Price often overshoots the line by a little before turning. The fix: think of the MA as a neighborhood, and give your stop a little breathing room below it — not one cent under.
Mistake 5 — using a moving average alone in a flat, rangey market. MAs are trend tools. In a sideways range they generate constant false signals. The fix: know that this tool shines in trends and stays quiet in ranges.
Mistake 6 — no stop, or a stop you move to avoid the loss. The line hands you a logical stop. Widening it because you can't stomach the loss is how a small planned loss becomes an account-ending one. The fix: set the stop at entry, write it down, honor it. Discipline over prediction, capital first.
Mistake 7 — too many lines. Beginners pile on ten moving averages until the chart is spaghetti. The fix: three lines. 12, 22, 55. Master them before adding anything.
Your one-page cheat-sheet
Screenshot this. Keep it next to your monitor.
The three lines
- 12 EMA = fast / short-term momentum (the sprinter)
- 22 EMA = medium / main dynamic support–resistance (the pacer)
- 55 EMA = slow / the true bias, the referee — watch it on the daily
Read the stack first
- 12 over 22 over 55, all up = bullish → hunt longs on pullbacks
- 55 over 22 over 12, all down = bearish → hunt shorts on rallies
- Tangled / flat = no trend → no trade
The A-plus beginner setup
- Bias: price above a rising 55 (long) or below a falling 55 (short)
- Stack agrees (clean, not tangled)
- Wait for the pullback to the 22 EMA
- Confirmation candle holds the line
- Stop just beyond the line where you're wrong
- Target at least 1:3 reward-to-risk
- If it's not clean, pass — there's always another bus
Remember
- MAs are zones, not exact prices
- Crosses are late — clues, not commands
- MAs work in trends, mislead in ranges
- Fewer lines, more discipline
How this fits the bigger Hollow Point picture
A moving average feels like a small thing — one curved line. But it's actually your first working model of the entire Hollow Point Trading philosophy, in miniature.
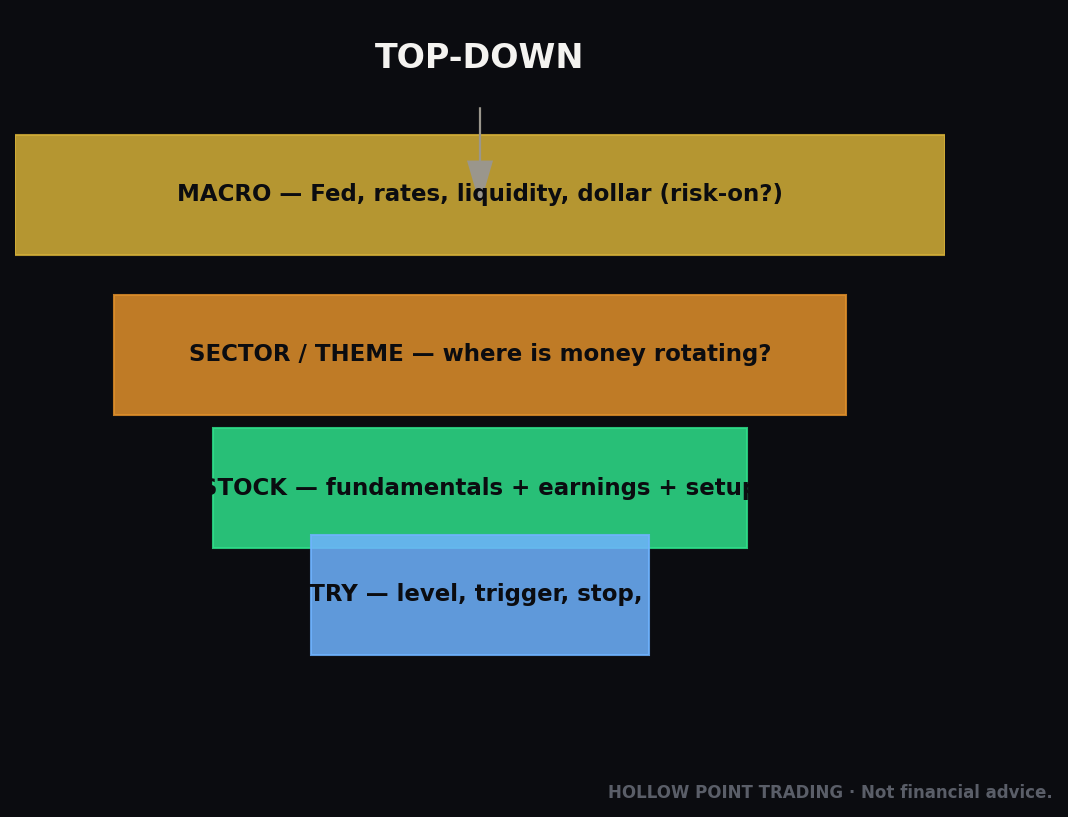
We trade macro to sector to stock — big picture first, then narrower, then the individual name. The 55 EMA teaches you that habit on a single chart: you check the big, slow bias before you ever look for a fast entry. You earn the right to zoom in by respecting the zoomed-out view first. That's the same discipline, just scaled down to three lines.
We preach discipline over prediction. The moving average never predicts. It has no idea what tomorrow holds. It simply describes what is — the current trend, the current agreement or disagreement — and gives you defined places to act. You're not guessing the future; you're responding to a readable present. That's the whole mindset.
We demand 1:3 reward-to-risk, and the moving average is what makes that math possible for a beginner. The line gives you a logical stop, which gives you a defined risk, which lets you set a target three times as far and know your trade is worth taking before you take it. No line, no clean risk. No clean risk, no ratio. No ratio, no edge.
And above all, we protect capital first. The moving average's greatest gift isn't the entries it finds — it's the exits it defines and the tangled markets it warns you to sit out. Most of what keeps a beginner's account alive is not trading the bad ones, and this humble line, read honestly, tells you which ones are bad. Survive first. The profits come to the traders who are still in the game.
Master these three lines — 12, 22, 55 — before you touch anything fancier. Read the stack. Wait for the line. Define your risk. Respect the tangle. Do that, and you'll already be trading with more structure than most people ever manage.
That's the job. Not to predict the market — to read it, respect it, and let your rules keep you safe while it does whatever it's going to do.
Bound by rules, feared by trade.