
Imagine you're standing at the back of a room, and a crowd suddenly starts moving toward the exit. The direction they're heading tells you where they're going. But there's a second, more important question: how many people are moving? Ten people drifting toward the door is a coincidence. Three hundred people sprinting for it is a fire.
That second number — how many — is volume. And in trading, it's the difference between a move you can trust and a move that's about to fall apart.
Most beginners stare at price. Price is loud, price is obvious, price is the number that goes up and makes you money or goes down and hurts. But price alone is only half the story. Volume is the other half — and once you learn to read it, you'll stop getting faked out by moves that looked strong and turned out to be hollow.
This guide teaches you volume from zero. No assumptions. Every term defined. By the end, you'll be able to open a chart Monday morning and know, at a glance, whether the crowd is actually behind a move or whether it's just a few people making noise.
What Volume Actually Is (In Plain English)
Let's start with the simplest possible definition.
Volume is the number of shares (or contracts) that changed hands during a specific period of time.
That's it. If 1,000,000 shares of a company were bought and sold today, the daily volume is 1,000,000.
Now, here's the part that trips beginners up, so let's kill the confusion right now. Every single trade has two sides: a buyer (someone who wants to own the stock) and a seller (someone who wants to get rid of it). You can't buy something unless someone sells it to you. So when we say "1,000,000 shares traded," we do not mean a million shares were bought and another million sold. We mean one million shares moved from sellers to buyers. One count. One number.
Think of it like a game of musical chairs where shares are the chairs. Volume doesn't measure how many chairs exist — it measures how many times a chair got passed from one person's lap to another during the song.
A quick vocabulary stop, because we just used a word you need to own:
- Share — one small unit of ownership in a company. Buy one share of a company and you own a tiny slice of it.
- Contract — the equivalent unit in futures and options markets (the world Hollow Point trades most, like NQ, the Nasdaq futures). For beginners, just know: shares for stocks, contracts for futures. Volume counts both the same way — units that changed hands.
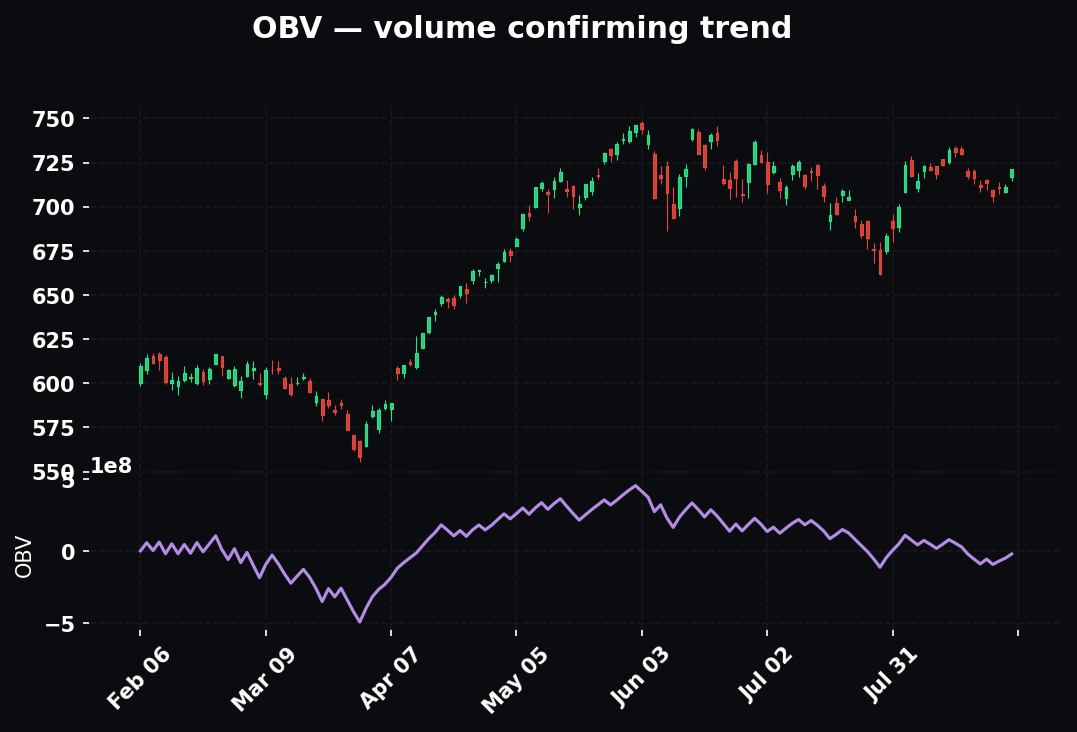
On almost every chart you'll ever open, volume shows up as a row of vertical bars along the bottom of the screen. Each bar sits directly underneath a price candle (the little colored rectangles that show the price). A tall bar means lots of shares traded during that period. A short bar means few. That's the entire visual language you need to start.

Most charting platforms color these bars too — usually green when price closed higher than it opened during that period, and red when price closed lower. This is a helpful hint, but don't over-trust the colors. A green volume bar does not mean "only buyers." Remember: every trade has a buyer and a seller. The color just tells you which direction price finished. We'll come back to why that matters.
Why a Complete Beginner Should Care About This
Here's the honest reason volume matters, stripped of all the fancy talk:
Volume tells you whether the market actually agrees with a price move — or whether it's a bluff.
Price can move on almost nothing. On a quiet afternoon, a handful of small orders can nudge a stock up 2%. It looks like a rally. Your eyes see green, your brain says "it's going up, get in." But if only a few thousand shares traded to create that move, then almost nobody in the market participated. The move is fragile. It's a stage set — looks like a building, falls over in a breeze.
Now compare that to a stock that rises 2% on ten times its usual volume. That's not a few people. That's a stampede. Big institutions — the banks, hedge funds, and giant funds that move real money, often called "smart money" or "institutions" — are the only players capable of creating that kind of volume. When you see a huge volume bar, you're seeing the footprints of people who move markets. And you want to be on their side, not fighting them.

This connects directly to the Hollow Point way of thinking. HPT's whole philosophy is discipline over prediction — you don't guess what the market will do, you wait for the market to show you what it's doing and then act on real evidence. Volume is one of the purest forms of evidence there is. It can't be faked. A company can put out a glowing press release; that's talk. But it takes real money to create real volume, and money leaves a trace you can see.
There's also the concept of fuel, which is the mental model I want you to carry out of this guide. A price move is like a car. Price is the car moving down the road. Volume is the gas in the tank. A move with heavy volume behind it has a full tank — it can keep going. A move with thin volume is a car coasting on fumes — it might roll a little farther, but it's going to stall, and soon. When you learn to check the fuel gauge before you trust the car, you stop chasing moves that were always going to die.

How Volume Works, Step by Step
Let's build your understanding one layer at a time. There are really only a few core ideas, and once they click, you've got the foundation.
Step 1: Learn what "normal" looks like for this stock
Volume is meaningless in isolation. A bar showing 500,000 shares is huge for a small, sleepy company and tiny for a giant like Apple that trades tens of millions of shares a day. So the first thing you ever do with volume is establish a baseline: what's a normal volume bar for this particular stock?
The easy way: look at the last 20 to 50 volume bars and eyeball the average height. Most charting tools will even draw a moving average line across the volume bars — a wavy line that shows the average volume over, say, the last 20 periods. That line is your "normal." Bars poking well above it are above-average. Bars sitting below it are below-average.

You're not measuring against some universal number. You're always asking: high or low compared to this stock's own recent history?
Step 2: Compare volume to price direction
Now you pair two things: which way did price move, and how much volume came with it? There are four basic combinations, and they're the heart of reading volume:
- Price up + high volume → a strong, believable up-move. Lots of buyers were willing to step up and pay higher prices. Real demand.
- Price up + low volume → a weak, suspicious up-move. Price rose but almost nobody participated. Be skeptical.
- Price down + high volume → a strong, believable down-move. Lots of sellers dumping. Real supply/fear.
- Price down + low volume → a weak down-move. Price slipped but there was no real selling pressure behind it. Often just a pause.

Memorize that four-box grid. It's the single most useful thing in this entire guide. Almost everything else is a variation on it.
Step 3: Use volume to CONFIRM moves
This is the primary job volume does for a beginner: confirmation.
When price does something important — breaks above a level it's been stuck under, or falls below a floor it kept bouncing on — you check volume to see if the move is trustworthy. A term you'll hear constantly is breakout, which just means price pushing through a level it couldn't get past before, like a runner finally busting through a wall.
A breakout on high volume is confirmed. The crowd showed up. It's more likely to hold and keep going.
A breakout on low volume is suspect — traders call it a "false breakout" or "fakeout." Price poked through the level, but with no volume behind it, there was no real force. These often snap right back, trapping the beginners who chased them.
Rule of thumb you can use immediately: a breakout worth trusting usually comes with volume clearly above that stock's average — often one and a half to two times normal or more. No volume surge, no confirmation, no trade. That's discipline, and it will save you from a huge percentage of beginner losses.
Step 4: Use volume to spot EXHAUSTION
This one is more advanced but incredibly valuable, so read it twice.
Sometimes you'll see a truly enormous volume bar — far bigger than anything around it — appear after a stock has already been moving hard in one direction for a while. Counterintuitively, this monster bar often signals the move is about to end, not continue. This is called exhaustion or a climax (a "buying climax" at the top, a "selling climax" at the bottom).
Why? Think about the fuel tank. When you see a gigantic burst of volume at the end of a long run-up, it usually means everyone who was going to buy has now bought. The last, most emotional, most fear-of-missing-out buyers piled in all at once. And once everyone's already in... who's left to buy? Nobody. The fuel is spent. The tank isn't just low — it just got emptied in one giant gulp. The move stalls and often reverses.

The same works in reverse at bottoms. After a long, scary decline, a massive volume spike often marks the moment the last panicked sellers finally give up and dump everything. That's a selling climax — the point of maximum fear, and frequently a bottom, because once the sellers are exhausted, there's nobody left to push price lower.
How do you tell a confirming volume surge from an exhaustion volume surge? Two clues:
- Location. A big volume bar early in a move (right at a breakout) tends to confirm. A big volume bar late in a move (after a long run) tends to warn of exhaustion.
- What price does next. If a huge volume bar appears and price fails to make further progress — it spikes up but closes weak, or barely moves despite the enormous activity — that's the tell. All that trading, no ground gained. The move is out of gas.

A Fully Worked Beginner Example
Let's walk through a realistic scenario, start to finish, with made-up-but-believable numbers so you can see how a disciplined beginner actually uses volume in real time.
Meet a fictional stock, Riverstone Tools (ticker: RVST). You've been watching it. Here's what you know:
Over the last month, RVST has traded an average of about 2,000,000 shares per day. That's your "normal." You've drawn a horizontal line on your chart at $50, because price has bumped its head against $50 four separate times over the past few weeks and gotten rejected every time. That $50 line is called resistance — a price level where sellers keep showing up and pushing price back down, like a ceiling.
Monday. RVST closes at $49.20 on 1,800,000 shares — slightly below its average volume. Nothing interesting. Quiet day. You do nothing.
Tuesday. Price rises to $49.80, closing green, but volume is only 1,500,000 shares — below average. Beginner-you might get excited: "It's climbing toward the breakout!" Disciplined-you looks at the four-box grid and says: price up, but on low volume. Box #2. Weak. No real buyers behind this. I wait. Good. You do nothing.
Wednesday. This is the day. RVST pushes right up to $50 and then bursts through it to close at $51.40 — clearly above the $50 ceiling. And the volume bar? 5,600,000 shares. That's nearly three times its normal 2,000,000.

Let's read it. Price broke a resistance level that had held four times — an important move. And it did it on massive above-average volume. That's box #1: price up, high volume. That's a confirmed breakout. The crowd showed up. Institutions were almost certainly involved to create volume like that. The fuel tank is full.
This is a setup worth acting on. And here's where Hollow Point discipline turns a signal into an actual plan. You never enter a trade without knowing three numbers first: where you get in, where you're wrong, and where you're targeting.
- Entry: You buy near the close at $51.40.
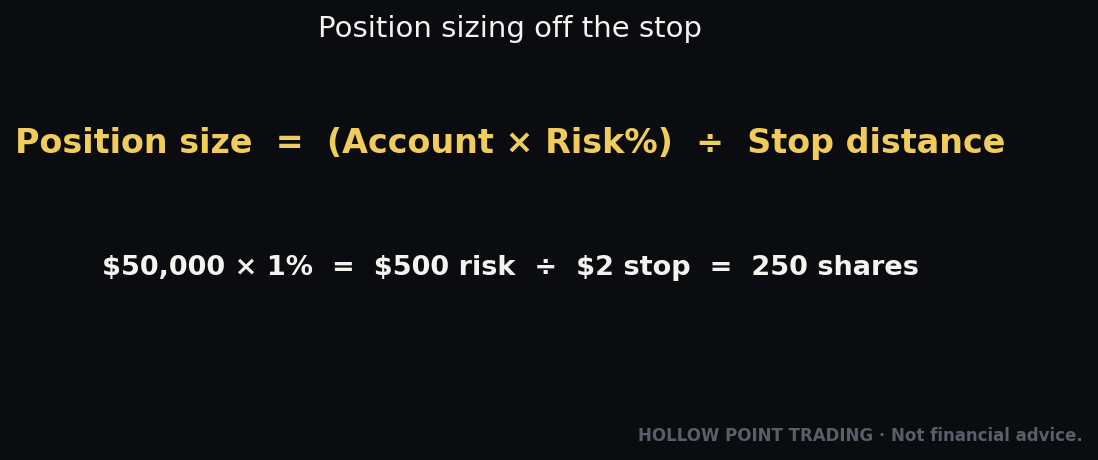
- Stop-loss (the price where you admit you're wrong and get out to protect your money — we'll always protect capital first): just back below the broken level, say $49.60. If price falls back under the ceiling it just broke, the breakout failed, and you leave. Your risk is $51.40 − $49.60 = $1.80 per share.
- Target: HPT trades a minimum 1:3 reward-to-risk ratio — meaning you only take trades where the potential reward is at least three times what you're risking. Risk is $1.80, so your reward target is 3 × $1.80 = $5.40. Target price: $51.40 + $5.40 = $56.80.
You risk $1.80 to make $5.40. Even if you're only right half the time, math like that keeps you profitable. That's the power of pairing a volume-confirmed signal with a rules-based plan.
Thursday and Friday. Price grinds higher to $54 on healthy, above-average volume. The move has fuel; you hold. Good so far.
The following Wednesday. RVST gaps up and spikes to $56.50 intraday on an absolutely gigantic 11,000,000-share bar — more than five times normal, the biggest bar you've seen in months. But by the close, price has faded all the way back to $54.80, closing red, well off its high.
Read it. That enormous bar came late in the move, after a multi-day run. And despite record volume, price couldn't hold its gains — it closed weak. That's box territory for exhaustion: massive activity, no ground kept. The last euphoric buyers just piled in and got absorbed by sellers taking profits. The fuel just got dumped. This is your warning. You're near your $56.80 target anyway, so a disciplined trader takes profits into that climax — selling to the euphoric crowd rather than joining it.
You exit around $55, banking most of a clean, planned, volume-confirmed trade. You didn't predict anything. You read the fuel gauge at every step and let the evidence lead. That's the whole game.
The Beginner Mistakes to Avoid
Now the mistakes. I want you to fail forward — learn these from my words instead of from your own account balance.
Mistake 1: Trusting a price move with no volume behind it. This is the big one. Price went up, you got excited, you jumped in — and you never once glanced at the volume bar showing that almost nobody participated. Always check the fuel gauge before you trust the car. If the move happened on below-average volume, treat it as a maybe, not a yes.
Mistake 2: Chasing false breakouts. Price pokes above resistance, you FOMO in ("fear of missing out" — the panicky feeling that a train is leaving without you), and then price snaps right back below the level because the breakout had no volume. The fix is simple and mechanical: no volume surge, no breakout trade. Make it a rule.
Mistake 3: Thinking green volume means "all buyers." We covered this, but beginners forget it constantly. Every trade has a buyer and a seller. A green bar just tells you price closed higher; it doesn't mean buyers outnumbered sellers, because they're always exactly equal. What high volume tells you is participation and conviction, not a lopsided count of buyers.
Mistake 4: Ignoring the "normal" baseline. Reacting to a "big" volume bar without checking whether it's actually big for that stock. Half a million shares is a tidal wave for one company and a puddle for another. Always compare to that stock's own recent average.
Mistake 5: Confusing confirmation volume with exhaustion volume. A volume surge at the start of a move (a breakout) is fuel. A volume surge at the end of a long move (a climax) is often the tank being emptied. Same big bar, opposite meanings — location and what price does next tell you which.
Mistake 6: Using volume all by itself. Volume is a supporting actor, not the star. It confirms what price and levels are already telling you. On its own, a big volume bar means little. Paired with a breakout of a real level, it means a lot. Never trade off volume in a vacuum.
Mistake 7: Forgetting that some low-volume periods are normal and don't count. Holidays, the days around major holidays, and the sleepy lunch hour in the middle of the trading day naturally have thin volume. A "low volume" reading during a holiday week isn't a warning sign — it's just an empty market. Context always.
Your Simple Volume Cheat-Sheet
Print this. Tape it near your screen. Read it before every trade until it's automatic.
The Four Boxes (memorize):
- Price UP + volume HIGH = strong up-move. Believe it.
- Price UP + volume LOW = weak up-move. Doubt it.
- Price DOWN + volume HIGH = strong down-move. Believe it.
- Price DOWN + volume LOW = weak down-move. Doubt it.
Before trusting any breakout, ask:
- Is volume clearly above this stock's average (aim for 1.5–2× normal or more)? If no → don't trust it.
Watch for exhaustion when:
- A giant volume bar appears late in a long move, AND price fails to keep going (spikes but closes weak). → The move may be ending. Protect profits.
Always establish "normal" first:
- Glance at the last 20–50 bars or the volume average line. Judge every bar against this stock's own history, never a universal number.
The mental model:
- Price = the car. Volume = the fuel. No fuel, no lasting move.
The discipline overlay (never skip):
- Every trade needs an entry, a stop-loss (protect capital first), and a target at a minimum 1:3 reward-to-risk. Volume confirms the signal; the rules govern the trade.
How Volume Fits the Bigger Hollow Point Picture
Volume isn't a standalone trick. It's one gear in a complete machine, and understanding where it sits will make you a far better trader than someone who only memorized the four boxes.
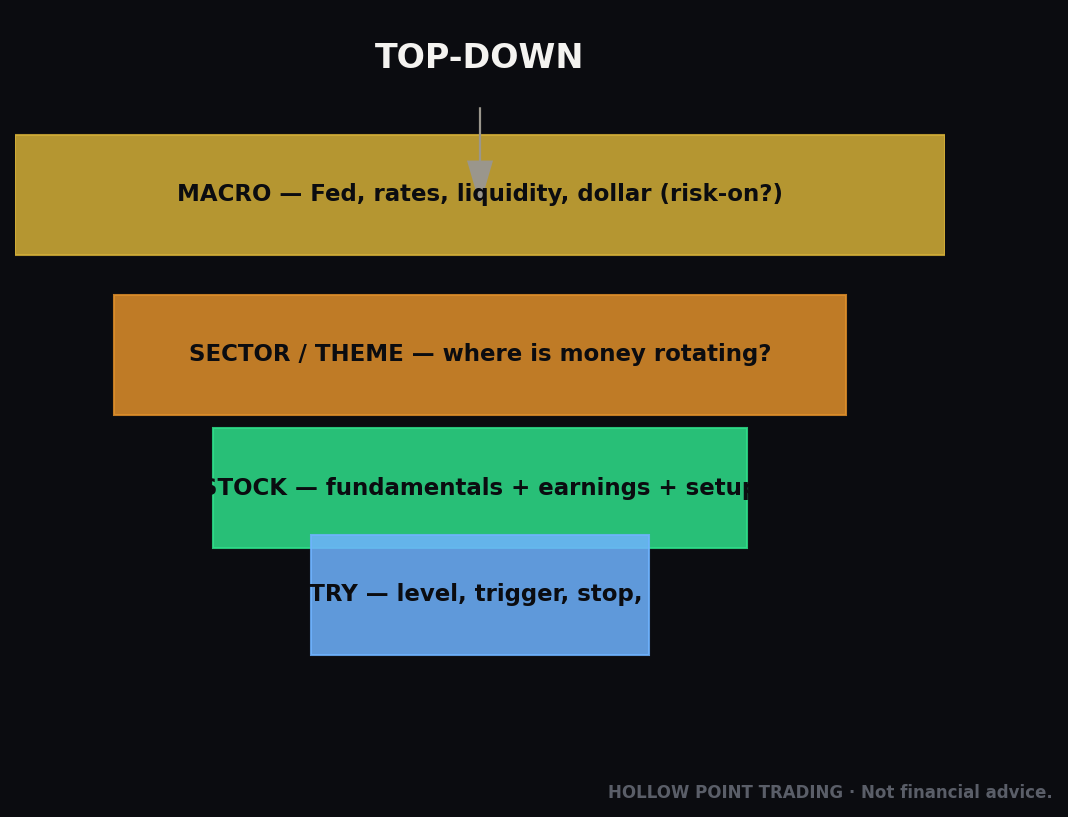
Hollow Point trades from the top down: macro → sector → stock. That means you start with the big picture — the overall market and economy (macro) — then narrow to which groups of stocks (sectors) are strong or weak, and only then pick the individual stock. Volume plays a role at every level. Is money flowing into the whole market on rising volume, or leaking out? Is a hot sector attracting heavy volume while a dead one goes quiet? Then, at the individual stock level, volume confirms whether this specific name has the crowd behind its move. Strong macro, strong sector, and a volume-confirmed breakout in the stock — that's three layers of agreement, and stacking evidence like that is what HPT calls confluence. The more independent things that agree, the better the trade.
Volume also serves the deepest HPT value: protect capital first, discipline over prediction. Notice that everything volume teaches you is defensive. It stops you from chasing hollow moves. It flags fakeouts before they trap you. It warns you when a run is out of gas. Volume rarely tells you to be a hero — it mostly tells you when not to trust what your greedy eyes are seeing. That's exactly the temperament that survives in markets. The traders who blow up are the ones who predict and hope. The traders who last are the ones who wait for evidence and manage risk. Volume is a machine for demanding evidence.
And it pairs with the 1:3 reward-to-risk rule to turn a good read into a good business. A volume-confirmed setup gives you a reason to enter. The 1:3 math makes sure that when you're right, you win big, and when you're wrong, you lose small. You can be wrong more often than you're right and still come out ahead — as long as your winners are three times the size of your losers, and you only pull the trigger when volume says the fuel is really there.
So here's how it all comes together for you, starting Monday. You'll open a chart. You'll find a real level — a ceiling or a floor price has respected before. You'll wait, patiently, doing nothing, until price challenges that level. Then, and only then, you'll look down at the volume bars and ask one question: did the crowd show up? If the answer is a clear yes — a fat bar well above normal — you'll build a plan with an entry, a protective stop, and a 1:3 target, and you'll take the trade. If the answer is no, you'll close the chart and keep your money. Both outcomes are wins, because both are disciplined.
That's volume. Not a crystal ball. A fuel gauge. Learn to read it, and you'll spend the rest of your trading life on the right side of the crowd instead of getting run over by it.
Bound by rules, feared by trade.