
You have probably heard traders throw around the phrase "IV is high right now" the same way people say "it's humid out." They say it like everyone already knows what it means. Then they move on, and you are left nodding along, quietly hoping nobody asks you to explain it.
This guide fixes that. By the end, you will understand implied volatility better than most people who have been trading options for a year. We are going to assume you have never placed a single trade. Every term gets defined the first time it shows up. Every idea gets an example with real-ish numbers. And we build it slowly, one brick at a time, so that by Monday you can actually look at a screen and know whether the "weather" is calm or stormy.
Let's start at the very beginning.
First, What Is an Option? (The 60-Second Version)
Before we can talk about implied volatility, we need one piece of foundation, because implied volatility lives inside the price of an option. If you already know options cold, skim this. If not, read slowly.
An option is a contract that gives you the right — but not the obligation — to buy or sell a stock at a specific price, before a specific date. You pay money for that right. The money you pay is called the premium. Think of it like putting a deposit down to lock in a price.
There are two flavors:
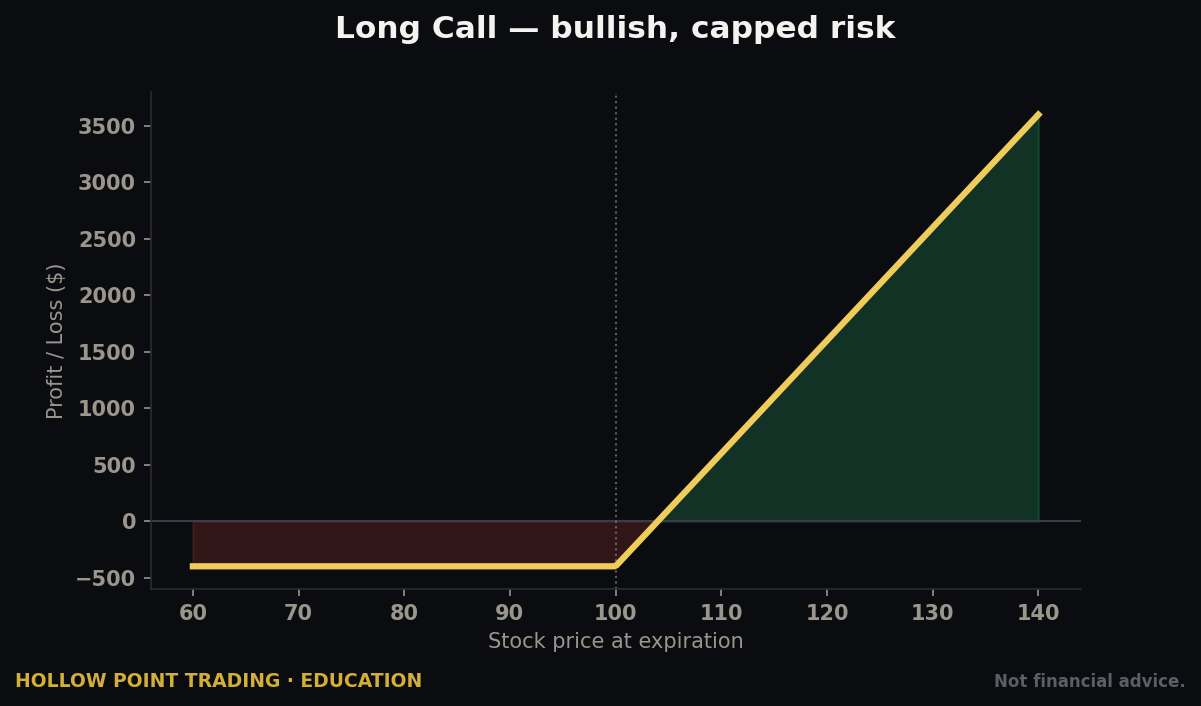
- A call option gives you the right to buy a stock at a set price. You buy calls when you think the price is going up.
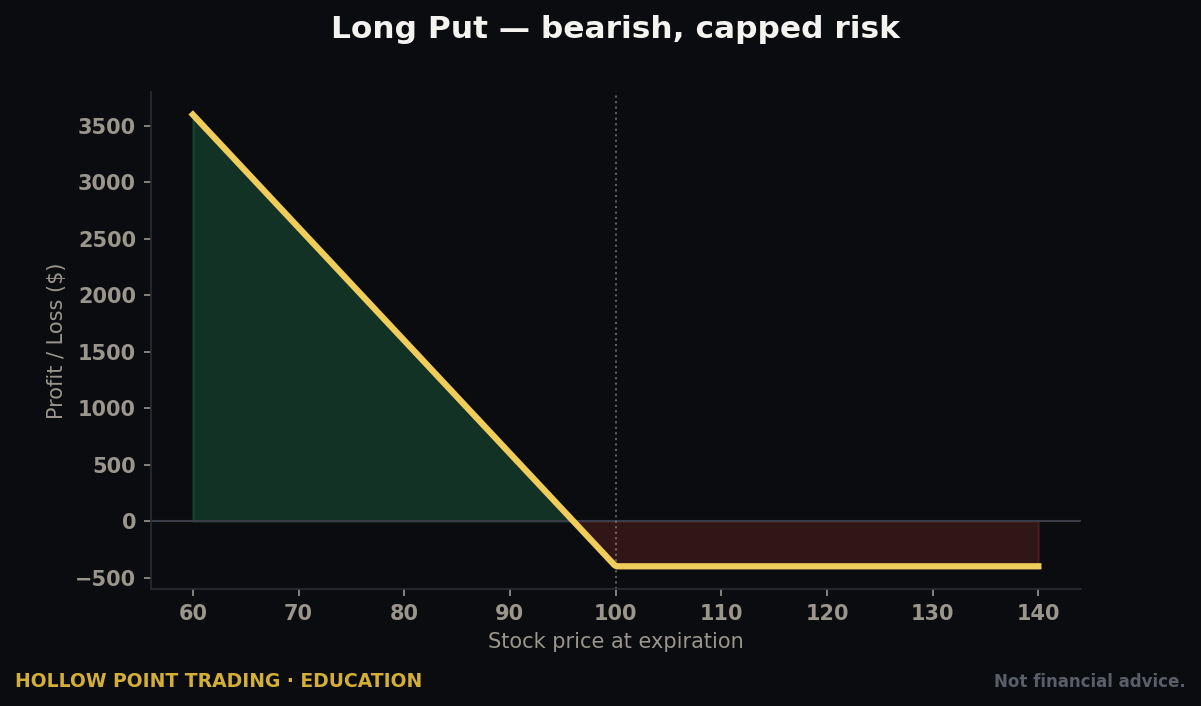
- A put option gives you the right to sell a stock at a set price. You buy puts when you think the price is going down.
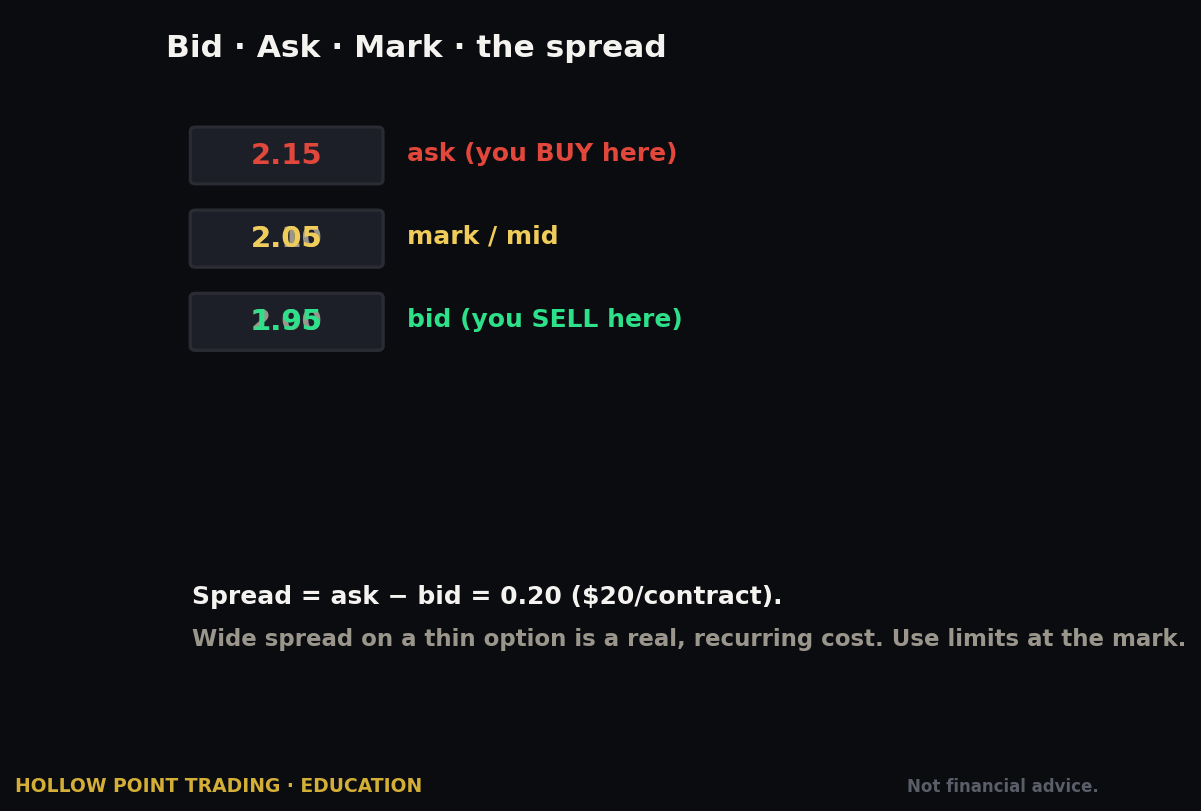
The set price you lock in is called the strike price. The deadline is the expiration date. And the premium — that deposit — is the price of the option, and it goes up and down every second the market is open.
Here is the whole reason this guide exists: that premium is not random. It is calculated. And one of the biggest ingredients in the calculation is how much the market thinks the stock is about to move. That single ingredient is implied volatility. Everything else is detail.
What Implied Volatility Actually Is (In Plain English)
Let's define the two words separately first.
Volatility just means how much something moves around. A stock that swings 5% in a day is highly volatile. A stock that barely budges 0.2% a day is calm, or "low volatility." Volatility is not direction — it does not care whether the stock goes up or down. It only measures the size of the swings. A wild ride is a wild ride whether the roller coaster is climbing or dropping.
Implied means suggested by, or baked into. When something is implied, it is not stated outright — it is hidden inside something else and you have to pull it out.
Put them together. Implied volatility (IV) is the amount of movement the market is expecting in a stock over the near future — and that expectation is baked into the price of the stock's options right now.
Here is the key mental flip that makes IV click. Most numbers in trading look backward. They tell you what already happened — yesterday's high, last week's volume, the price an hour ago. Implied volatility is different. It is a forecast. It is the market's collective guess about the future, expressed as a number you can read off a screen.
Where does that forecast come from? From what people are willing to pay for options.
Think about umbrellas. If a huge storm is coming, everybody wants an umbrella, so umbrella prices spike. A smart observer could walk past a store, see umbrellas selling for triple the normal price, and conclude: "People must be expecting rain." You did not see the weather forecast. You inferred it from the price of protection.
That is exactly what implied volatility is. Options are protection and speculation rolled into one. When the crowd expects a big move — a "storm" — they bid up the price of options, and IV goes up. When the crowd expects things to stay calm, option prices sag, and IV goes down. IV is the storm forecast, read backward out of the price of umbrellas.
Why a Beginner Should Care More Than They Think
Most beginners obsess over one question: "Is the stock going up or down?" They pick a direction, buy a call or a put, and then feel confused and betrayed when the stock moves their way and they still lose money.
That gut-punch — right direction, still losing — is almost always implied volatility doing its quiet work. Here is why you cannot ignore it.
Reason one: IV is a huge part of what you pay. Remember the premium — the price of the option? When IV is high, options are expensive. When IV is low, options are cheap. Two stocks trading at the exact same price, with the exact same strike and the exact same expiration date, can have wildly different option prices purely because one has high IV and the other has low IV. If you do not check IV, you genuinely do not know whether you are buying an umbrella on a sunny day at a fair price or in the middle of a panic at triple markup.
Reason two: IV can crush you even when you're right. This is the big one. Imagine a company is about to report earnings — a scheduled announcement of how much money it made. Everybody knows a big move is possible, so demand for options soars, and IV climbs sky-high in the days before. You buy a call, betting the stock rises. Earnings come out, the stock does rise — you were right! But the uncertainty is now gone. The storm passed. IV collapses. This collapse is so common it has a name: IV crush. And IV crush can vaporize the value of your option faster than the stock's rise can rebuild it. You were right on direction and still lost. Nobody warned you, because you did not know to look at IV.
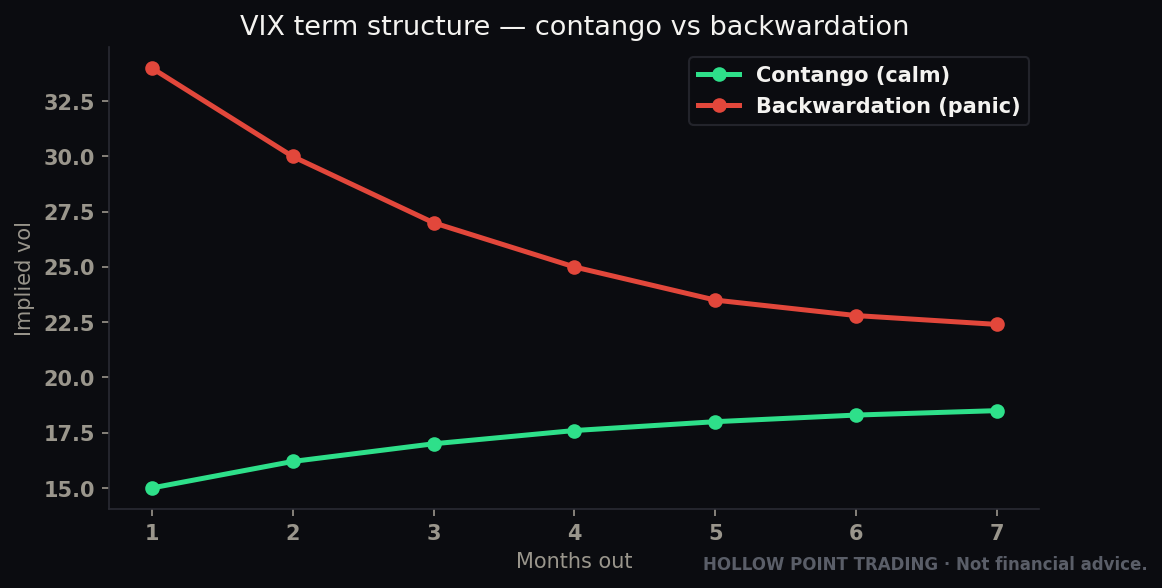
Reason three: IV tells you which strategy even makes sense. Seasoned traders do not just ask "up or down?" They ask "is volatility cheap or expensive right now?" When options are cheap (low IV), it can make sense to buy them. When options are expensive (high IV), buying them means overpaying, and different approaches make more sense. You cannot make that call without reading IV. It is the difference between shopping for umbrellas on a sunny day versus a stormy one.
At Hollow Point Trading, the whole philosophy is protect capital first, and let discipline beat prediction. Reading IV is protection. It stops you from overpaying, it warns you before earnings traps, and it keeps you from taking a "great setup" that is quietly rigged against you by expensive premiums. A beginner who checks IV before every options trade has already dodged the mistake that drains most new accounts.
How Implied Volatility Actually Works, Step by Step
Let's slow down and build the machine one gear at a time.
Step 1: Option prices are calculated by a formula. There is a famous piece of math called an option pricing model — the best-known one is the Black-Scholes model, but you never need to do the math yourself; your broker's software does it instantly. This formula takes several ingredients and spits out a fair price for an option.
Step 2: The formula has known ingredients and one unknown. The ingredients it needs are:
- The current stock price (you know this)
- The strike price (you chose this)
- Time until expiration (you know this)
- Interest rates (published, known)
- How much the stock is expected to move — volatility (this is the mystery ingredient)
Four of those five are known facts. Only one — volatility — is a guess about the future.
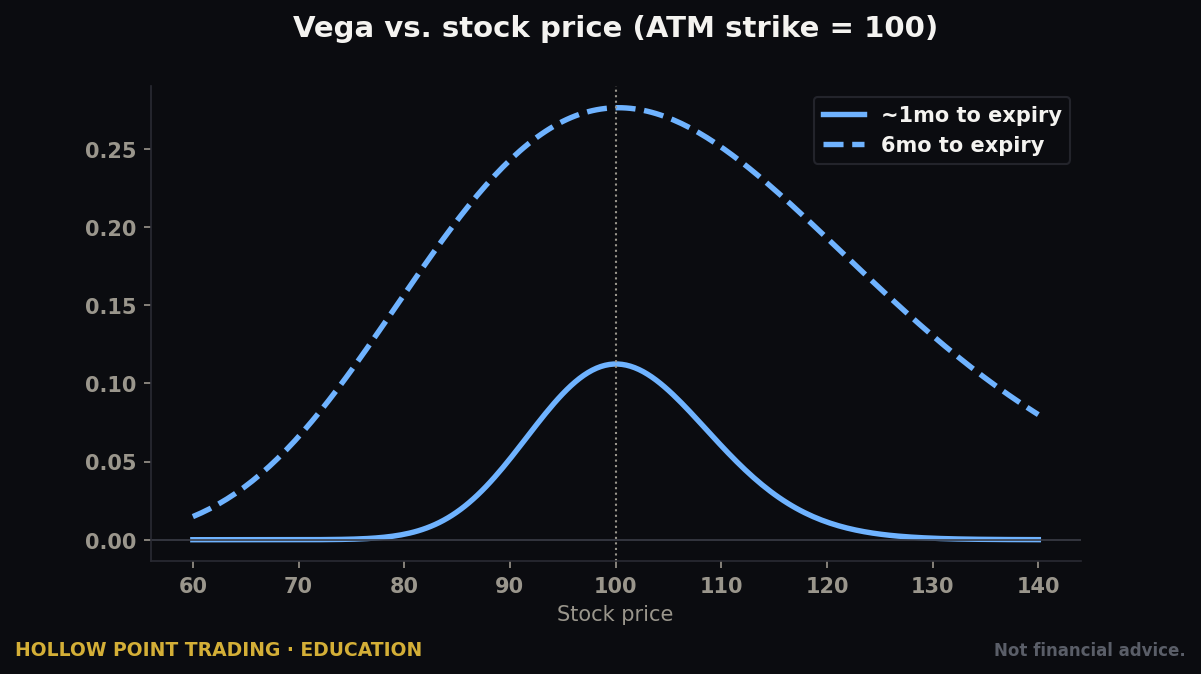
Step 3: The market solves for the missing ingredient backward. Here is the clever part. In the real world, we do not actually need the formula to tell us the option price — the market already tells us the price! Buyers and sellers meet, and an option trades at, say, $4.00. So traders run the formula in reverse. They plug in everything they know — stock price, strike, time, rates — plus the actual market price of the option, and they solve for the one missing piece: volatility.
The volatility number you get by working backward from the option's live price is implied volatility. It is literally the volatility level that the current price implies. That is where the name comes from. The market price implies a certain amount of expected movement, and we reverse-engineer it.

Step 4: IV is quoted as an annual percentage. When your platform says "IV is 40%," it means the market expects the stock to move, up or down, about 40% over the next year, based on standard math. That yearly number can be scaled down to shorter windows, which we will do in the worked example. For now just know: bigger IV percentage = bigger expected swings = more expensive options.
Step 5: IV moves constantly, driven by supply and demand. IV is not fixed. Every time traders pile into options (fear, excitement, earnings coming, big news), demand pushes option prices up, which pushes IV up. Every time the dust settles and people stop buying protection, option prices sag and IV falls. IV breathes in and out with the mood of the crowd.
That is the entire machine. Formula, four known ingredients, one unknown, solved backward from the live price, quoted as a yearly percentage, moving with crowd demand. You never do the math — but now you know what the number means.
A Fully Worked Beginner Example
Let's make this concrete with a made-up stock. Meet Bluepeak Coffee, ticker BREW. (Not a real company — we are inventing clean numbers so the mechanics are crystal clear.)
BREW is trading at $100 per share. You are looking at a call option — remember, that is the right to buy — with a strike price of $100, expiring in about one month. Your broker screen shows this option's IV is 32%.
What does that 32% actually tell you?
That 32% is an annual figure. To turn a yearly expected move into a one-month expected move, there is a simple rule of thumb traders use: divide the annual IV by roughly 3.5 to get the expected move for the next month. (The 3.5 comes from the square root of 12 months — you do not need to memorize why, just the shortcut.)
So: 32% ÷ 3.5 ≈ 9%.
That means the market is expecting BREW to move about 9% up or down over the next month. Nine percent of $100 is $9. So the market's rough expectation is that BREW lands somewhere between $91 and $109 a month from now. Not a guarantee — a forecast baked into the option's price. That single number just told you the crowd's expected trading range. That is powerful, and you got it in ten seconds.
Now let's see IV in action — the earnings trap.
Fast-forward three weeks. BREW is about to report earnings in two days. Suddenly everybody wants options — some to bet on the report, some to protect what they own. Demand explodes. The IV on that same $100 call rockets from 32% up to 70%.
The stock has barely moved — still around $100. But the option has gotten dramatically more expensive, purely because IV more than doubled. Let's say the call that cost $3.00 at 32% IV now costs $6.50 at 70% IV. Same stock price, same strike, and it more than doubled in price. Every penny of that extra cost is expected-movement — storm pricing.
You, an excited beginner, buy that $6.50 call because you are sure BREW will pop on good earnings.
Earnings come out. Good news! BREW jumps from $100 to $106 — a solid 6% gain. You were right.
But here is the gut-punch. The moment earnings are public, the uncertainty is gone. The storm passed. IV collapses from 70% right back down to 33%. That is IV crush. When you recalculate the option's price with the stock at $106 but IV back at 33%, the option is worth only about... $6.20.
You paid $6.50. It is worth $6.20. You were right on direction and you still lost money. The stock rose 6%, but the air came out of the IV balloon faster than the stock could refill it. Nobody at the broker warned you. If you had checked IV first, you would have seen it was jacked up to 70% — a screaming signal that you were about to overpay for an umbrella right before the sky cleared.

That single example is the most valuable thing in this entire guide. Print it on the inside of your eyelids. High IV before a known event is a warning label, not a green light.
Making IV Useful: IV Rank and IV Percentile
Here is a problem. Is 40% IV high or low? You genuinely cannot tell. For a sleepy utility stock, 40% would be enormous. For a wild biotech, 40% might be sleepy. A raw IV number has no meaning without context — it is like being told it is "70 degrees" without knowing if that is 70 in Alaska or 70 in the Sahara.
So traders needed a way to answer one simple question: "Is IV high or low compared to where this particular stock usually is?" Two tools do exactly that: IV Rank and IV Percentile. Both turn the confusing raw IV number into a clean 0-to-100 score, where you can instantly see whether volatility is cheap or expensive for this stock.

IV Rank answers: "Where does today's IV sit between this stock's lowest and highest IV over the past year?"
The formula is simpler than it looks:
IV Rank = (Today's IV − Lowest IV this year) ÷ (Highest IV this year − Lowest IV this year) × 100
Let's do one. Over the past year, BREW's IV bounced between a low of 20% and a high of 60%. Today it is 32%.
IV Rank = (32 − 20) ÷ (60 − 20) × 100 = 12 ÷ 40 × 100 = 30.
An IV Rank of 30 means today's IV is only 30% of the way up from this stock's yearly floor to its yearly ceiling. In plain English: volatility is on the low-to-middle side for BREW. Options are relatively cheap-ish right now. Good time to consider buying them, expensive time to sell them.

IV Percentile answers a slightly different question: "What fraction of the trading days over the past year had a LOWER IV than today?"
Say that on 250 trading days over the past year, BREW's IV was below today's level on 175 of them. Then IV Percentile = 175 ÷ 250 × 100 = 70. That means today's IV is higher than it was on 70% of days this year — so volatility is elevated compared to a typical day.
Which should a beginner use? Honestly, either works — just pick one and stay consistent. Many platforms show IV Rank by default, so start there. The subtle difference: IV Rank can get skewed by one freak spike (a single crazy day sets the "high," stretching the scale), while IV Percentile is more about how often IV has been elevated. If both are available, glancing at both is smart. But do not overthink it. The whole point is the same: turn a meaningless raw number into a 0-100 score so you instantly know if options are cheap or expensive for that stock.

A rough field guide to the 0-100 score, either flavor:
- 0 to 25 — Low. Options are cheap. Volatility is quiet. Favor buying options if you have a directional view.
- 25 to 50 — Below average. Leaning cheap.
- 50 to 75 — Above average. Leaning expensive. Be careful buying.
- 75 to 100 — High. Options are pricey and a storm is priced in. Buying here is overpaying; strategies that sell premium tend to make more sense (a more advanced topic — for now, just know that buying options here is usually a beginner trap).
High IV vs Low IV Regimes: Reading the Market's Mood
A regime just means the general environment or mode the market is in — the prevailing weather pattern. Volatility broadly lives in two regimes, and knowing which one you are in changes everything.
Low IV regime — the calm. Options are cheap. The crowd is relaxed, complacent, expecting slow, steady drift. The market is often grinding gently higher in these periods. In a low-IV regime, buying options can be attractive because you are not overpaying for the umbrella — and if a storm shows up unexpectedly, IV can rise, which actually helps the option you already bought. The risk of a calm regime is complacency: everyone assumes the calm lasts forever, right up until it doesn't.
High IV regime — the storm. Options are expensive. Fear or excitement is running hot — often during market drops, crises, or right before big events. Prices swing violently. In a high-IV regime, buying options means paying storm prices, and you are exposed to IV crush when things calm down. But here is the counterintuitive HPT-flavored truth: high-IV, high-fear moments are frequently where opportunity hides, because panic pushes prices to extremes and premiums are fat. Selling-based strategies shine here — but those are advanced, so as a beginner your main job in a high-IV regime is simple: do not buy overpriced options, and do not panic.
There is one market-wide gauge worth knowing by name: the VIX, often called the "fear index." The VIX is basically the implied volatility of the whole S&P 500 (a big basket of 500 large U.S. companies) rolled into one number. When the VIX is low (say, under 15), the overall market is calm. When the VIX spikes above 30 or 40, fear is everywhere. You do not trade the VIX as a beginner — you read it, the way you glance at the sky before leaving the house. A high VIX says "options everywhere are expensive and nerves are frayed." A low VIX says "calm seas, options are cheap."
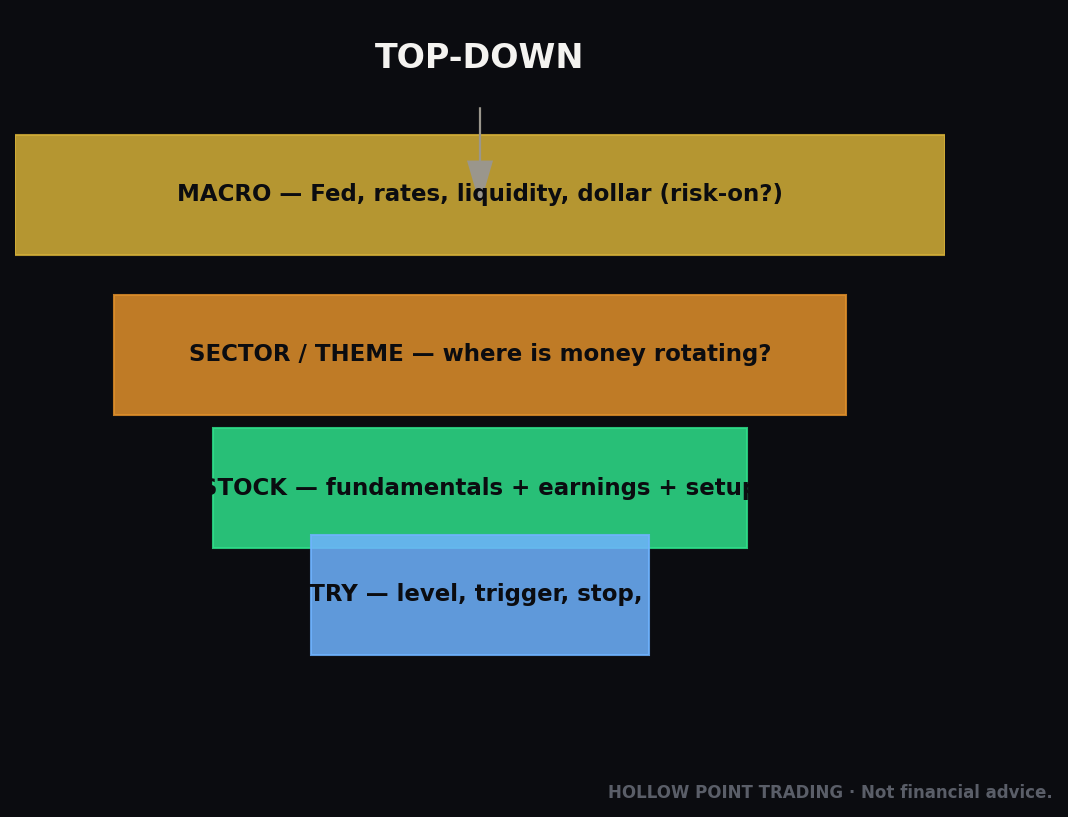
This is where IV connects to the bigger Hollow Point Trading map. The HPT approach reads the market top-down: macro → sector → stock. Macro is the big picture — is the whole market calm or stormy? The VIX and the overall IV regime are your macro read on volatility. From there you narrow to the sector, then to the individual stock, checking that stock's own IV Rank. If the macro storm is raging (high VIX) and your specific stock's IV Rank is at 90, you are staring at expensive options in a nervous market — a moment to protect capital, not to reach for a lottery ticket. Reading IV at both the macro and the single-stock level is simply seeing the weather at every altitude before you fly.
The Beginner Mistakes to Avoid
Let's collect the traps into one place. Every one of these has drained a real beginner's account.
Mistake 1: Ignoring IV completely. Buying an option without checking IV is buying without checking the price tag. You would never do that at a store. Do not do it here.
Mistake 2: Buying options right before earnings. This is the IV-crush trap from our BREW example. IV is jacked up before scheduled events, and it collapses the instant the event passes. Being right on direction does not save you. As a beginner, the default rule is: do not buy options right before earnings. Let the crush happen to someone else.
Mistake 3: Assuming high IV means the stock is going up. IV has nothing to do with direction. High IV means big expected movement, up OR down. A stock can have sky-high IV and then crash. Never read high IV as bullish.
Mistake 4: Confusing the raw IV number with high or low. As we covered, 40% IV is meaningless without context. Always check IV Rank or IV Percentile to know if it is high or low for that specific stock.
Mistake 5: Chasing "cheap" options that are cheap for a reason. Sometimes low IV means genuinely cheap opportunity. Sometimes it means the market rightly expects nothing to happen. Cheap is not automatically good — cheap plus a real reason to expect movement is good.
Mistake 6: Forgetting that IV changes after you're in the trade. You buy at 30% IV. If IV drops to 20% while you hold, your option loses value even if the stock sits still. IV is a live, breathing part of your position the entire time you hold it, not just at the moment you buy.
Mistake 7: Skipping IV because it feels like "advanced stuff." IV feels intimidating, so beginners skip it and focus on direction. That is exactly backward. IV is one of the first things to master because it is one of the biggest reasons beginners lose. You do not need the math — you need the habit of looking.
Your Simple IV Cheat-Sheet
Tape this next to your screen. Run through it before every options trade.
Before you buy any option, ask:
- What is the raw IV on this option? Just read the number off the screen.
- What is the IV Rank (or IV Percentile)? Is it low (0-25), middle (25-75), or high (75-100) for this stock?
- Is anything scheduled soon? Earnings, a product launch, a major economic announcement? If earnings are within about two weeks, assume IV is elevated and a crush is coming.
- What is the overall regime? Glance at the VIX. Calm market (low VIX) or stormy (high VIX)?
- Does buying even make sense here? Buying options is most attractive when IV Rank is low. If IV Rank is high, you are overpaying — step back.
- What is the expected move? Quick math: annual IV ÷ 3.5 = expected one-month move. Does the trade still make sense inside that range?
- How does IV affect my exit? Remember that if IV falls after you enter, you lose value even if you are right. Plan for it.
The one-line summary of everything:
- Low IV Rank = options are cheap = buying is more attractive.
- High IV Rank = options are expensive = buying is usually a trap.
- IV measures the size of the expected move, never the direction.
- Scheduled event coming = IV is inflated = crush is coming.
If you remember nothing else, remember those four lines.
How IV Fits the Bigger Hollow Point Picture
Zoom out. Why does a disciplined trading approach care so much about a forecasting number?
Because Hollow Point Trading is built on protecting capital first and letting rules beat prediction. Implied volatility is a rules-based edge you can check in seconds, and it protects capital in three concrete ways.
First, it stops you from overpaying. Every dollar of premium you overpay because you ignored a high IV Rank is a dollar of risk you took on for free. Checking IV is the cheapest insurance in trading.
Second, it feeds the HPT macro → sector → stock read. Volatility at the macro level (the VIX, the overall regime) tells you what kind of environment you are flying in. Volatility at the stock level (IV Rank) tells you whether this umbrella is fairly priced. Reading both is just seeing the weather at every altitude.
Third, it strengthens reward-to-risk discipline. HPT hunts for trades where the potential reward is at least three times the risk — the 1:3 reward-to-risk rule. But that math is a fantasy if you are overpaying for the trade. High IV inflates your cost, which shrinks your reward and swells your risk, quietly wrecking the 1:3 ratio before you even start. Reading IV keeps your reward-to-risk math honest. A great-looking setup bought at a terrible IV is not a great setup — it is an expensive one wearing a costume.
The through-line of everything HPT teaches is this: do not predict the market — respect it, measure it, and let your rules decide. Implied volatility is one of the purest expressions of that idea. You are not guessing where the stock goes. You are measuring what the crowd expects, pricing your umbrella against it, and refusing to overpay. That is discipline over prediction, in one number.
You started this guide nodding along, hoping nobody would ask you to explain IV. Now you can explain it, calculate a rough expected move, read an IV Rank, spot an earnings trap, and name the regime you are in. That is not beginner knowledge anymore. That is an edge — and you can use it Monday.
Bound by rules, feared by trade.