
You buy SPY and you think you own "the S&P 500." You don't. You own a share of a trust that owns a basket that's designed to track an index that's calculated by a committee. There are four layers between your order and the actual companies — and every one of them costs you something, hides something, or can break in a way that shows up in your P&L.
Most traders never look past the ticker. They treat SPY, QQQ, and IWM like magic tokens that go up and down. That's fine until the day tracking error eats your edge, or a leveraged fund decays 20% while the index goes nowhere, or a "diversified" ETF turns out to be a bet on seven stocks wearing a trenchcoat.
This is the piece that fixes that. By the end you'll know exactly what you're buying, the plumbing that keeps the price honest (and the specific conditions under which it fails), how the same wrapper behaves in a trending tape versus a chop-fest versus a volatility spike, how to stack ETFs into a confluence read with your EMAs and volume profile, and how Hollow Point uses ETFs to express a macro→sector→stock read without ever touching a single-name landmine. Deep, but usable Monday.
The Concept: A Fund That Trades Like a Stock
Start with the two words. A fund is a pool of money from many investors used to buy a basket of assets. An index is just a rulebook — a list of securities and a formula for weighting them. The S&P 500 index isn't tradable; it's a number, a scoreboard. You can't buy a scoreboard.
Historically, if you wanted to own "the market," you bought a mutual fund — a pooled fund that buys the basket for you. But a mutual fund only prices once a day, after the close, at its NAV (Net Asset Value — the total value of everything it holds, divided by shares outstanding). You send your order during the day, you get filled at a price you won't know until 4 p.m. No intraday trading. No stops. No shorting. Useless to a tape reader.
An ETF — Exchange-Traded Fund — solves that. It's a fund whose shares trade on an exchange all day long, like a stock. Same basket-of-assets idea as a mutual fund, but with a live, tradable ticker. You can buy SPY at 9:31, sell it at 9:47, put a limit above and a stop below, and short it if you want.
That single innovation — a pooled basket that trades intraday — is why ETFs went from a curiosity in 1993 (SPY was the first, launched by State Street as the "Standard & Poor's Depositary Receipt," which is where the nickname "spider" comes from) to roughly $10 trillion+ in U.S. assets today. But "trades like a stock" hides a problem the whole rest of this piece is about: if an ETF is just a basket, what stops its price from drifting away from the value of the basket? A stock's price is whatever buyers and sellers say. If ETF shares floated free the same way, SPY could trade at $600 while the stocks inside are worth $580, and you'd be overpaying by $20 for no reason.
The mechanism that prevents that is the most important thing in this entire article, and almost no retail trader understands it.
Why "trades like a stock" is a half-truth
A stock and an ETF share look identical on your screen — same bid/ask, same order ticket, same candle. But underneath, they are opposite kinds of objects. A stock represents a finite claim on one company's future cash flows; its share count changes only through rare corporate actions (buybacks, splits, secondary offerings). An ETF share represents a fungible, elastic claim on a basket, and its share count can expand or contract by tens of millions of shares in a single session without anyone at the exchange blinking. That elasticity is the whole trick. A stock can't print more of itself to satisfy demand. An ETF effectively can — through the mechanism below — and that is precisely why its price stays tethered to something real while a hot stock can detach into a bubble.
Hold that distinction. When you're reading SPY's tape, you're reading a price that has a gravitational anchor bolted to it. When you're reading a single stock's tape, you're reading a price that can float wherever sentiment drags it. That difference changes how you treat gaps, how you treat blow-off moves, and how much you trust a level.
The Mechanism: Creation, Redemption, and the Authorized Participant
Here's the machine that keeps ETF price glued to the value of what's inside. It runs on a special class of players called Authorized Participants (APs) — large institutional firms (think big banks and market makers like Bank of America, Goldman, Jane Street, Citadel Securities) that have a contract with the ETF issuer allowing them to create and destroy ETF shares.
You and I can only buy and sell existing ETF shares on the exchange — the secondary market. APs get access to the primary market: they can manufacture new shares or retire old ones, in bulk. That's the pressure valve.
Creation. Suppose demand for SPY is hot. Buyers are lifting offers, and SPY's market price gets pushed above the value of the basket it represents — call that value the iNAV (intraday NAV, the real-time worth of the underlying holdings). Now SPY is trading at a premium. An AP sees free money. It goes into the open market and buys all 500 underlying stocks in the exact index weights — a bundle called the creation basket — then delivers that basket of real stocks to the ETF issuer. In exchange, the issuer hands the AP a big block of brand-new SPY shares (a creation unit, typically 25,000–50,000 shares). The AP now sells those new shares on the exchange into the hungry demand, pocketing the difference between what the basket cost and what the shares fetch.
Two things just happened: the supply of SPY shares went up (new shares created), which pushes the price back down toward fair value, and the AP's buying of the underlying stocks pushes the basket value up. The gap closes. Arbitrage did its job.
Let's put numbers on it so it's concrete. Say SPY's fair basket value (iNAV) is $600.00, but a wave of buying pushes SPY's market price to $600.40 — a 40-cent premium. An AP buys one creation unit's worth of the 500 underlying stocks for $600.00 per equivalent share (times 50,000 shares = $30,000,000), delivers them to the issuer, and receives 50,000 new SPY shares. It sells those 50,000 shares at $600.40 into the market for $30,020,000. That's a $20,000 gross arbitrage profit on the block, minus transaction costs — and the act of selling 50,000 fresh shares pushes the premium back toward zero. Multiply that by a dozen APs all racing each other, and the premium is gone in seconds. The "free money" competes itself away, and what's left is a price pinned to the basket.
Redemption. Now the opposite. Everyone's dumping SPY, price gets pushed below iNAV — a discount. The AP buys the cheap SPY shares on the exchange, hands a creation unit's worth back to the issuer, and receives the basket of underlying stocks in return. It sells those stocks (worth more than the SPY shares it paid for) and books the spread. Supply of SPY shares just went down (shares redeemed / destroyed), pushing the price back up to fair value. Gap closes again.
Run the same math in reverse: iNAV $600.00, panic selling drops SPY to $599.55 — a 45-cent discount. The AP buys 50,000 SPY shares at $599.55 ($29,977,500), redeems them for the underlying basket worth $600.00/share ($30,000,000), sells the basket, and pockets ~$22,500 minus costs. The buying of cheap SPY shares lifts the price back toward NAV. The discount evaporates.

This create/redeem loop runs continuously, invisibly, all day. It's why SPY trades within a penny or two of its true basket value even during a fast tape. The ETF price doesn't stay honest because of goodwill — it stays honest because any deviation is a cash arbitrage that a dozen APs are racing to capture.
Three consequences you need to file away
1. The in-kind swap is a tax feature, not an accident. Notice the AP trades stocks for shares — an "in-kind" exchange, not cash. When the issuer wants to remove a low-cost-basis stock, it can hand that exact lot to a redeeming AP instead of selling it. No sale, no realized capital gain inside the fund. This is the structural reason ETFs are dramatically more tax-efficient than mutual funds — mutual funds have to sell holdings for cash to meet redemptions, triggering taxable gains passed on to every shareholder. It's also why you almost never get a surprise capital-gains distribution from an equity ETF. (Not the focus for a trader, but it's the reason ETFs won the asset-gathering war, and it's why even active managers now launch ETF share classes.)
2. The mechanism can break. The arbitrage only works if APs can freely trade the underlying. In a normal equity ETF, fine. But in illiquid corners — high-yield bonds, emerging-market debt, thinly-traded municipals — when the underlying market freezes (March 2020 is the canonical example), APs can't price or trade the basket, they step back, and the ETF price can dislocate hard from NAV. HYG and LQD (bond ETFs) traded at multi-percent discounts to NAV for days in the 2020 liquidity crunch. The wrapper is only as liquid as what's inside it. An ETF can look liquid on-screen and be built on quicksand. For SPY/QQQ this never matters. For exotic ETFs it can matter enormously.
3. The premium/discount is a stress gauge you can actually read. Because the arbitrage is normally instant, a persistent premium or discount is a signal, not noise. When a bond ETF like HYG trades at a 3% discount to its stated NAV and stays there, the ETF's live price is often telling you the truth — the underlying bonds haven't traded and their marks are stale, so the ETF is doing real-time price discovery the cash market can't. In the 2020 crunch, the ETF discount was arguably the more accurate price. So don't reflexively read "discount = the ETF is broken." Sometimes it means "the ETF is the only honest quote in the room." Check which is stale before you decide who's wrong.

Cap-Weighting and the Concentration Trap
Now, what's in the basket and how much of each? This is where "diversified index fund" quietly becomes "concentrated bet," and it trips up nearly everyone.
Most major index ETFs are market-cap-weighted. A company's market capitalization = share price × shares outstanding — the total dollar value of the company. In a cap-weighted index, each stock's weight is its market cap as a fraction of the total. Apple is worth ~$3.5 trillion; a $50 billion mid-cap is worth 1/70th as much; so Apple gets ~70x the weight. The index automatically holds more of what's already big.
That sounds reasonable — bigger companies are a bigger share of the economy. But it has a brutal side effect: the index becomes top-heavy, and gets more top-heavy the longer a bull market in megacaps runs. As of 2024–2025, the top 10 holdings of the S&P 500 grew to roughly 35–38% of the entire index — the most concentrated it has been in over 50 years. The "Magnificent Seven" (Apple, Microsoft, Nvidia, Amazon, Alphabet, Meta, Tesla) alone have at times been ~30% of SPY.
So when you buy SPY thinking you own 500 companies equally, you actually own a portfolio where the bottom ~400 names barely move the needle and the top handful drive almost everything. If Nvidia sneezes, "the market" catches a cold — not because of 500 companies, but because of one 7%+ weight.
This is concentration risk hiding inside a "diversified" product, and it's a double-edged sword you must respect:
- On the way up, cap-weighting is a momentum machine — winners get bigger, so their rising weight pulls the whole index higher. It's why SPY outran most active managers during the 2023–2024 megacap run.
- On the way down, that same concentration is the risk. A rotation out of megacap tech can drag SPY and especially QQQ down even while the median stock is flat or up. "The index is red but my breadth scan is green" is a cap-weighting artifact.
Worked example: how much of "the market" is really moving
Say Nvidia is 7% of SPY and it drops 10% on an earnings miss. That single name, by itself, drags SPY down 0.7% before any other stock moves. Now add Apple (7%) down 2% and Microsoft (6%) down 2% in sympathy — that's another 0.26%. Three stocks just took SPY down nearly a full percent. If the other 497 names are collectively flat, SPY prints -0.96% and the financial media says "stocks fell broadly." They didn't. Three stocks fell and 497 stood still. If you were trading SPY off that print thinking the whole tape had turned, you were trading a headline that three tickers wrote.
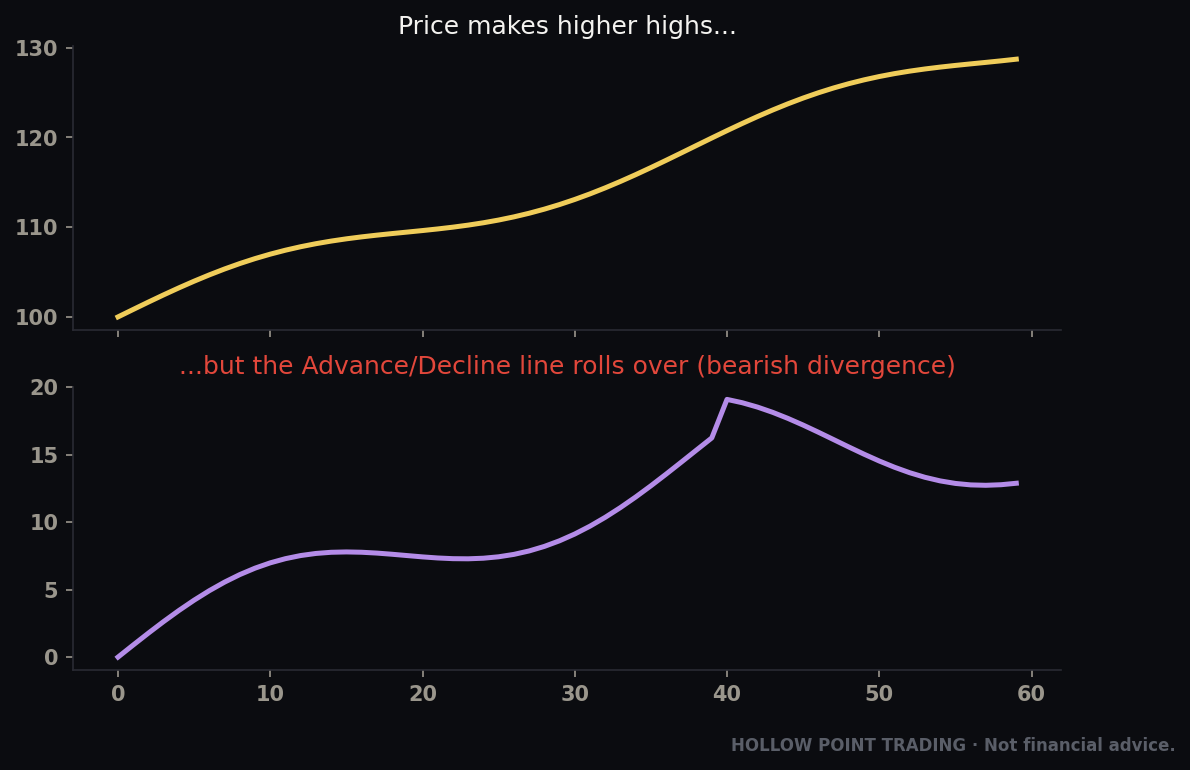
This is why the pros never read the index in isolation. They read it against breadth — the number of advancers vs decliners, the equal-weight version, the percentage of names above their 50-day. The index is a weighted average that a handful of giants can hijack.
Equal-weight: the market's honest twin
The alternative is equal-weight (ticker RSP for the S&P 500) — every one of the 500 names gets 0.2%, rebalanced quarterly. RSP tells you what the average stock is doing; SPY tells you what the biggest stocks are doing. When SPY and RSP diverge sharply, that's a breadth signal: narrow leadership (SPY >> RSP) is late-cycle and fragile; broadening participation (RSP catching up) is healthy. Watching the SPY/RSP ratio is one of the cleanest breadth reads you can build, and it costs you nothing.
Here's how to use it in practice. Pull up a ratio chart of SPY divided by RSP (in TradingView, symbol SPY/RSP). When that line is rising, the megacaps are outrunning the average stock — leadership is narrowing, the rally is getting top-heavy, and you should trust upside breakouts less. When the line is falling, the average stock is catching up or leading — breadth is broadening, participation is healthy, and pullbacks are more likely to be bought. A market that grinds to new highs on SPY while SPY/RSP makes lower highs is flashing a classic late-cycle divergence: fewer and fewer names carrying more and more of the load. That doesn't mean "short it tomorrow," but it means "tighten your invalidation and stop trusting the breakout as much."

The Big Four Index ETFs — Read Them Like Instruments
Four tickers carry the vast majority of U.S. index-trading volume. Each one is a specific slice of the market, and knowing which is which is the difference between reading the tape and guessing.
SPY — S&P 500. ~500 large-cap U.S. companies, cap-weighted. This is "the market," the broad risk barometer, the most liquid security on earth. Expense ratio 0.0945%. Sector mix is tech-heavy (~30%+) but spans the whole economy — financials, healthcare, industrials, energy, consumer. When someone says "risk-on/risk-off," they mean SPY (or its futures, ES). Note: the true institutional benchmark is ES futures and the SPX index; SPY is the retail-accessible proxy that tracks them closely. IVV (iShares) and VOO (Vanguard) are cheaper S&P 500 ETFs (~0.03%) preferred by long-term holders — but SPY has the deepest options and the tightest intraday liquidity, which is why traders live in it.
One nuance most people miss: SPY holds a small cash drag from dividends it collects but pays out quarterly, and it's structured as a unit investment trust, which means it can't reinvest dividends or lend out its holdings. That's a hair of tracking drag versus VOO/IVV, which are open-end funds that can reinvest and lend. For a day trader it's meaningless. For understanding why SPY very slightly lags its cheaper cousins over years, that's the reason.
QQQ — Nasdaq-100. The 100 largest non-financial stocks on the Nasdaq. In practice: big tech, concentrated. Massively overweight Apple, Microsoft, Nvidia, Amazon, Meta, Alphabet, Broadcom, Tesla. This is your growth / long-duration / risk-appetite gauge. QQQ leads SPY when rates are falling and animal spirits are high; it lags hard when rates spike or tech rolls over. Expense ratio 0.20%. If you want to know how much juice is in the risk trade, watch QQQ vs SPY — QQQ outperforming = offense on the field. (QQQM is the cheaper cousin for holders; QQQ is the trader's vehicle for the options depth.)
Why does QQQ live and die on interest rates? Because tech and growth names are long-duration assets — most of their value is in earnings expected years out. When the discount rate (rates) rises, those far-off earnings are worth less today, mathematically, so growth gets repriced down harder than value. That's the mechanical reason QQQ is a rate-sensitivity gauge, not just a "tech is exciting" gauge. When you see the 10-year yield (TNX) spiking, QQQ underperforming SPY is not a mystery — it's arithmetic.

IWM — Russell 2000. ~2,000 small-cap U.S. companies. This is the domestic economy / risk-appetite-broadening gauge. Small caps are more sensitive to the U.S. economic cycle, to credit conditions, and to interest rates (they carry more floating-rate debt). IWM leading is a sign of broadening risk appetite and confidence in the domestic cycle; IWM lagging badly while QQQ rips is the "narrow, defensive, megacap-only" market that precedes trouble. Expense ratio 0.19%. IWM is more volatile than SPY — a feature when it's your directional bet, a hazard when you size it like a large-cap.
Two things separate IWM from the megacap indices. First, roughly 40% of the Russell 2000's companies have negative earnings — these are smaller, more speculative, more credit-dependent businesses. That's why IWM is a credit and cycle gauge: when banks tighten lending or high-yield spreads blow out, small caps feel it first. Second, IWM is heavily domestic — small caps sell mostly to U.S. customers, so IWM leading often signals a bet on the domestic economy specifically, as opposed to a global or dollar-driven trade. When you see IWM ripping while the dollar (UUP) falls, that's frequently a reflation/soft-landing trade: cheaper dollar, easier financial conditions, domestic cyclicals catch a bid.
DIA — Dow Jones Industrial Average. 30 large "blue-chip" names — but here's the quirk that trips people up: the Dow is price-weighted, not cap-weighted. Weight is set by each stock's share price, not its market value. A $500 stock has 10x the influence of a $50 stock even if the $50 company is far larger. It's an archaic methodology, which is why DIA is more a media/sentiment artifact than a serious analytical tool. Lower volume than the other three. Skews toward old-economy value/industrials. Useful mostly as a "defensive value" tell — when DIA holds up while QQQ bleeds, capital is rotating from growth to value/defensives.
To see how broken price-weighting is: imagine a $600 stock in the Dow and a $40 stock. The $600 name drives roughly 15x the index movement of the $40 name, regardless of which company is bigger or more important to the economy. A stock split — which changes nothing about a company's value — instantly slashes that stock's Dow influence. No serious index would be built this way today; the Dow survives on tradition and headline familiarity, not analytical merit. Read it as a vibe, not a measurement.
The relationships between these four are more informative than any one alone. QQQ/IWM, SPY/RSP, DIA vs QQQ — these ratios are your risk-appetite dashboard, and I'll show you how to wire them into the top-down process below.
The Sector SPDRs — Slicing the Market Into Eleven Engines
Below the index level, the market is organized into 11 GICS sectors (Global Industry Classification Standard — the taxonomy that sorts every public company into a sector). State Street's Sector SPDRs carve the S&P 500 into exactly these eleven, and they are the single most useful toolkit for a top-down trader. Memorize the tickers — you'll use them daily:
- XLK — Technology (software, semis, hardware)
- XLC — Communication Services (Alphabet, Meta, Netflix, telecom)
- XLY — Consumer Discretionary (Amazon, Tesla, retail, autos, travel)
- XLP — Consumer Staples (food, beverages, household — defensive)
- XLF — Financials (banks, insurers, payments)
- XLV — Health Care (pharma, devices, insurers — defensive)
- XLE — Energy (oil & gas)
- XLI — Industrials (machinery, transports, defense, airlines)
- XLB — Materials (chemicals, metals, mining)
- XLU — Utilities (electric/gas — defensive, rate-sensitive)
- XLRE — Real Estate (REITs — rate-sensitive)
One structural quirk to know: the Sector SPDRs are themselves cap-weighted within the sector, so the same concentration trap applies one level down. XLK is dominated by Apple, Microsoft, Nvidia and Broadcom — buying XLK is largely a bet on a handful of megacap semis and software names, not "technology broadly." XLE is dominated by ExxonMobil and Chevron. If you want the equal-weight version of a sector to strip out that top-heaviness, funds like RSPT (equal-weight tech) exist, and the SPDR-vs-equal-weight-sector spread is a sector-level breadth read exactly analogous to SPY/RSP. Same tool, smaller frame.
Three ways to use these that most traders miss
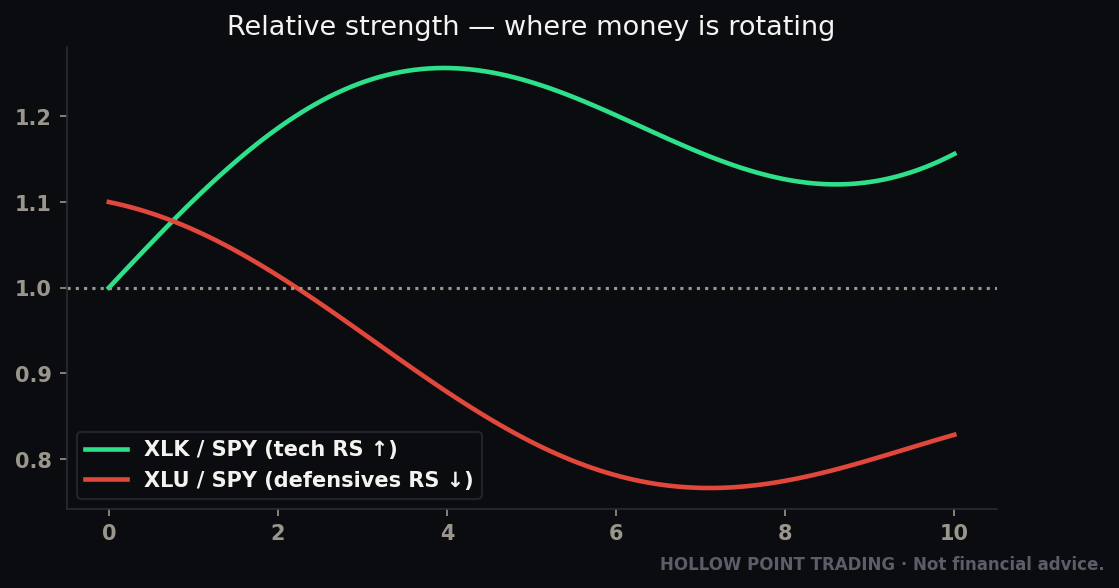
Offense vs. defense. Sectors split into cyclicals (XLK, XLY, XLF, XLI, XLB, XLE — do well when growth is strong) and defensives (XLP, XLV, XLU — held when investors get scared, because people buy toothpaste and take medicine in any economy). The single cleanest risk-appetite read on the market is the XLY/XLP ratio — discretionary (want-to-buy) over staples (have-to-buy). Rising ratio = offense, confident consumer, risk-on. Falling ratio = capital hiding in defensives, risk-off — often before the index itself rolls over. It's a leading tell that lives one click away.
Relative strength ranking. Pull up all 11 SPDRs on a relative-strength basis (each divided by SPY, or just ranked by 1-month/3-month return) and you get an instant rotation map — where money is flowing into and out of. This is the backbone of sector rotation trading: you don't fight the tape, you find the sector the tape is already rewarding and trade its leaders. When XLE and XLF top the ranking and XLU/XLP bottom it, that's a reflationary, risk-on regime. Flip it and you've got a defensive, risk-off regime. The SPDRs turn a vague macro feeling into a ranked, tradable list.
The rotation clock. Sectors don't lead randomly — they tend to rotate in a cycle-linked order. Early-cycle (recovery off a bottom): financials (XLF) and discretionary (XLY) lead as rates are low and credit reopens. Mid-cycle (expansion): tech (XLK) and industrials (XLI) lead as capex and growth run hot. Late-cycle (overheating): energy (XLE) and materials (XLB) lead as inflation and commodities peak. Recession (contraction): staples (XLP), utilities (XLU), and health care (XLV) lead as capital hides. It's not a clock you can set your watch to, but when you see energy and materials topping the RS board while staples and utilities firm up underneath, that combination whispers "late cycle," and it should change how aggressively you chase growth.

Leveraged and Inverse ETFs — The Daily-Reset Decay Trap
Now the part that costs uneducated traders the most money. Leveraged ETFs promise a multiple of an index's daily return; inverse ETFs promise the opposite of it.
- SSO = 2x S&P 500. SPXL / UPRO = 3x S&P 500.
- TQQQ = 3x Nasdaq-100. SQQQ = -3x Nasdaq-100 (inverse).
- SH = -1x S&P 500. SPXS / SPXU = -3x S&P 500.
- TNA = 3x small-cap, SOXL = 3x semiconductors, and so on.
They achieve the multiple with total-return swaps and futures, and — this is the critical word — they reset the leverage every single day. The prospectus promises the multiple of the daily return, not the return over a week, a month, or a year. That one word, daily, is where the trap lives.
Here's the mechanism, worked out with numbers so it's undeniable. Say an index is at 100.
- Day 1: index rises 10% → 110. A 3x fund rises 30% → from $100 to $130.
- Day 2: index falls ~9.09% back to 100 (100 is 9.09% below 110). The 3x fund falls 3 × 9.09% = 27.3% → from $130 to $94.51.
The index is exactly flat over the two days — back to 100. The 3x fund is down 5.5%, sitting at $94.51. It didn't track 3x of zero. It lost money on a round trip that cost the index nothing. Run that over a choppy, sideways month and the leveraged fund bleeds relentlessly. This is volatility decay (or "beta slippage"), and it's not a bug — it's the mathematically guaranteed result of compounding a daily-reset multiple through volatility.

The other side of the coin — when leverage helps
Now run a trending tape, because this is the half nobody tells you. Index at 100, up 5% three days in a row:
- Day 1: index 100 → 105 (+5%). 3x fund: $100 → $115 (+15%).
- Day 2: index 105 → 110.25 (+5%). 3x fund: $115 → $132.25 (+15%).
- Day 3: index 110.25 → 115.76 (+5%). 3x fund: $132.25 → $152.09 (+15%).
The index gained 15.76% over three days. Three times that is 47.3%. But the fund gained 52.1% — more than 3x the index's cumulative move. In a clean, low-volatility trend, daily compounding works for you, and leveraged funds beat their static multiple. This is the seductive part: in the 2023–2024 straight-up megacap trend, TQQQ crushed 3x-of-the-actual-QQQ-move, and holders felt like geniuses. Then the first sharp two-way chop came and gave a chunk of it back overnight.
The rule that falls out of comparing the two examples: leveraged ETFs reward trend and punish chop, and they do both at three times the speed. The intuition: to maintain constant leverage, the fund must buy more exposure after it goes up and sell exposure after it goes down — buy high, sell low, every day, mechanically. In a one-way trend that's "buy strength," which helps. In a whipsaw that's "buy the top, sell the bottom," which bleeds. The higher the volatility and the more sideways the chop, the worse the decay. Add the higher expense ratios (TQQQ ~0.84%, vs QQQ 0.20%) and the daily swap financing costs, and the drag compounds.
The volatility-regime rule
This is why leveraged ETFs must be read through the lens of the volatility regime, not just direction:
- Low-vol uptrend (VIX low, price above rising EMAs): leverage compounds in your favor. This is the only environment where a multi-day hold is even defensible — and only with a hard invalidation.
- High-vol chop (VIX elevated, price knifing both directions around a flat mean): leverage is a wood chipper. Even if you're eventually right on direction, the path destroys you. Avoid the hold entirely; if you must, it's an intraday in-and-out only.
- High-vol trend (crash or vertical squeeze): the multiple can deliver spectacular moves, but overnight gap risk is 3x and slippage on your stop is real. This is expert-only territory, sized tiny.
The rule that falls out of the math: leveraged and inverse ETFs are day-to-few-day instruments, period. They are for expressing a short, high-conviction directional view on a clean trend — not for holding, not for "long-term leverage," not for a hedge you set and forget. Every "why is my SQQQ down 40% when the Nasdaq is only up 15%?" question traces to holding a daily-reset product through time. If you hold one overnight, know exactly why, know your invalidation, and treat the decay as a cost you're paying for the leverage. Discipline over prediction — a 3x fund punishes indiscipline three times as fast.
Expense Ratios and Tracking Error — The Two Quiet Costs
Expense ratio is the annual fee the fund charges, expressed as a percentage of assets, skimmed daily out of NAV. SPY's 0.0945% means $9.45/year on $10,000. You never see a bill — it's already inside the price. For a trader in and out in hours, expense ratio is almost irrelevant. For a holder, it compounds: 0.20% (QQQ) vs 0.03% (VOO) is a rounding error for a week and a real drag over a decade. This is why holders pick the cheap share class (VOO, IVV, QQQM) and traders pick the liquid one (SPY, QQQ). Match the tool to the holding period.
Put a number on the long-horizon drag: $100,000 held for 20 years at 7% annual growth ends around $373,000 with a 0.20% fee versus about $383,000 with a 0.03% fee — roughly $10,000 handed to the fund company for nothing. Over a week of trading, that same fee difference is about four cents. Same two funds, and the "which is cheaper" question only matters at one end of the horizon. That's the whole point: the fee is a holding-period question, not a quality question.
Tracking error is the more subtle one: how far the ETF's actual return drifts from the index it's supposed to track. Perfect replication is impossible — the fund pays fees, holds tiny cash balances, times dividends imperfectly, pays trading costs when the index rebalances, and (for some funds) samples rather than holds every name. The gap between fund and index is tracking error. For SPY/QQQ it's tiny and boring. For an ETF holding illiquid or hard-to-access assets (emerging markets, small-cap international, commodities), it can be material, and it's a direct, silent tax on your return.
Where tracking error bites hardest is in funds that can't hold the real thing. A commodity ETF like USO doesn't own barrels of oil in a warehouse — it holds oil futures, and it must "roll" expiring contracts into later ones. When the futures curve is in contango (later months more expensive than nearer ones), every roll sells low and buys high, and USO bleeds versus spot oil relentlessly. Over years, USO has massively underperformed the actual price of crude for exactly this reason. Same story for VIX products (VXX) — the roll cost is so severe they're effectively guaranteed to decay. The lesson: for anything that holds futures instead of the underlying, "tracks the price of X" is a marketing claim, not a mechanical fact. Read the structure.
Don't confuse tracking error (fund vs. its index, a slow structural drift) with the premium/discount (fund price vs. its own NAV, an intraday supply/demand gap that the AP arbitrage normally erases in seconds). Different problems, different causes. For the big liquid ETFs both are negligible. For anything exotic, check both before you trust the ticker.

How ETFs Behave in Different Market Regimes
The same four tickers give you completely different information depending on the regime, and reading them without adjusting for the regime is how people get chopped up. Three regimes, three playbooks.
Trending market
In a clean trend, the index ratios line up and stay lined up — QQQ leads SPY leads a rising RSP, or in a downtrend defensives quietly outperform for weeks. The tell of a healthy trend is persistence in the leadership: the same sectors top the RS board day after day, and the SPY daily 55-EMA is respected on every pullback. This is the environment where you press: buy dips to rising EMAs in the leading index, size up in the leading sector, and even a multi-day leveraged hold is defensible with a stop. The ratios confirm rather than whipsaw.
Chop / range
In a range, the ratios go schizophrenic — QQQ leads for two days, IWM for two days, nothing holds leadership, and the RS board reshuffles daily. That reshuffling is the signal: no dominant flow, mean-reversion rules, breakouts fail. The play flips entirely — fade the edges of the range instead of chasing breakouts, cut size, and never hold a leveraged product overnight because chop is exactly where daily-reset decay does its worst work. When you can't tell who's leading, that's the market telling you it doesn't know either. Trade smaller or stand aside.
High-volatility / crisis
When VIX spikes, correlations go to 1 — everything sells together, the sector map temporarily stops discriminating (in a real panic even defensives get sold for liquidity), and the only thing that matters is risk-off vs risk-on at the index level. This is also when the plumbing gets stressed: premium/discount gaps widen on anything illiquid, bid/ask spreads blow out even on SPY for brief windows, and leveraged funds gap 3x overnight. The read simplifies but the execution gets dangerous. In a crisis, ETFs are for expressing one thing — "risk-off, get defensive or flat" — not for nuanced sector rotation. Wait for VIX to come off the boil before the sector map means anything again.

Multi-Timeframe Treatment
A ratio chart or a sector read means different things on different timeframes, and the higher timeframe governs — same rule as any Hollow Point markup.
Higher timeframes (daily/weekly) set the regime. The weekly SPY/RSP trend, the daily sector RS ranking, the weekly XLY/XLP — these define what kind of market you're in and change slowly. This is your bias. You don't re-decide the regime every fifteen minutes; you decide it on the daily and weekly and let it stand until it structurally breaks.
Lower timeframes (hourly/5-min) time the entry. Once the daily says "risk-on, XLF leading," you drop to the hourly to find the actual level — the pullback to the rising 22-EMA, the VWAP reclaim, the volume-profile POC that lines up. The lower timeframe never overrides the daily bias; it just tells you when to act on it.
The danger is timeframe conflict masquerading as a signal. A 5-minute chart of QQQ/SPY spiking up while the daily ratio is in a clean downtrend is noise — a countertrend bounce inside a larger rotation out of tech. Beginners see the 5-minute spike and think "tech is leading again"; the pro checks the daily, sees the bounce is against the dominant flow, and either fades it or stands aside. Weight the timeframes — higher governs lower — and a lot of false rotation signals disappear.
Building Confluence — ETFs Plus Two or Three Other Tools
An ETF read is strongest when it stops being a standalone opinion and becomes one leg of a confluence stack. Here's how the ETF layer fuses with the rest of the toolkit.
ETF ratios + the EMA framework
Confirm every regime call with the 12/22/55 EMA stack. The daily 55-EMA on SPY is the bias tell — above it, dips are buyable; below it, rips are sellable. Now stack the ratio on top: if SPY is above its rising daily 55-EMA and QQQ/SPY is rising and XLY/XLP is rising, that's three independent confirmations of the same risk-on read — trend, growth leadership, and consumer appetite all pointing the same way. That's high-conviction, size-up confluence. If SPY is above its 55-EMA but the ratios are rolling over underneath, you've got a trend running on narrowing participation — reduce conviction, tighten the invalidation.
ETF ratios + volume profile + VWAP
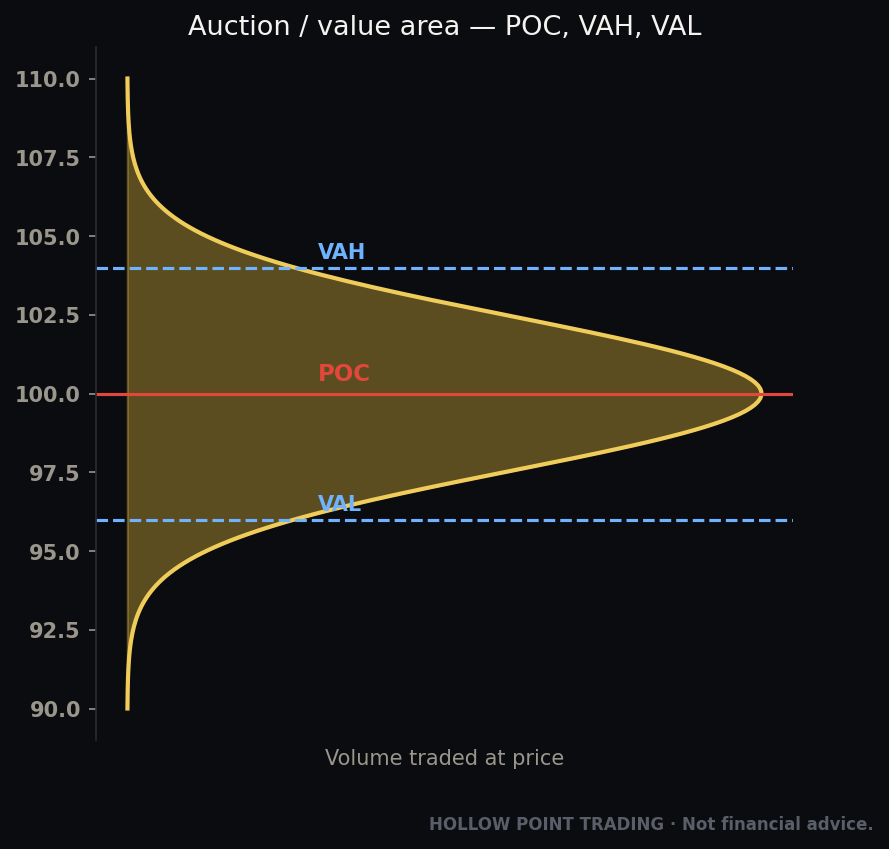
The ratios tell you what to trade; the profile and VWAP tell you where. Say the sector board says XLF is the leader. Pull up XLF and mark the anchored volume profile POC and VAH/VAL. If price is holding above value on rising volume with a reclaimed VWAP, the "buy the leader" thesis has a clean, defensible entry and a clear invalidation (loss of VAL / the VWAP). The macro read and the microstructure read agree — that's the trade. If XLF is the RS leader but price is stalling at the VAH on fading volume, the theme is real but the location is wrong; wait for a better level rather than chasing.
ETF ratios + intermarket confirmation
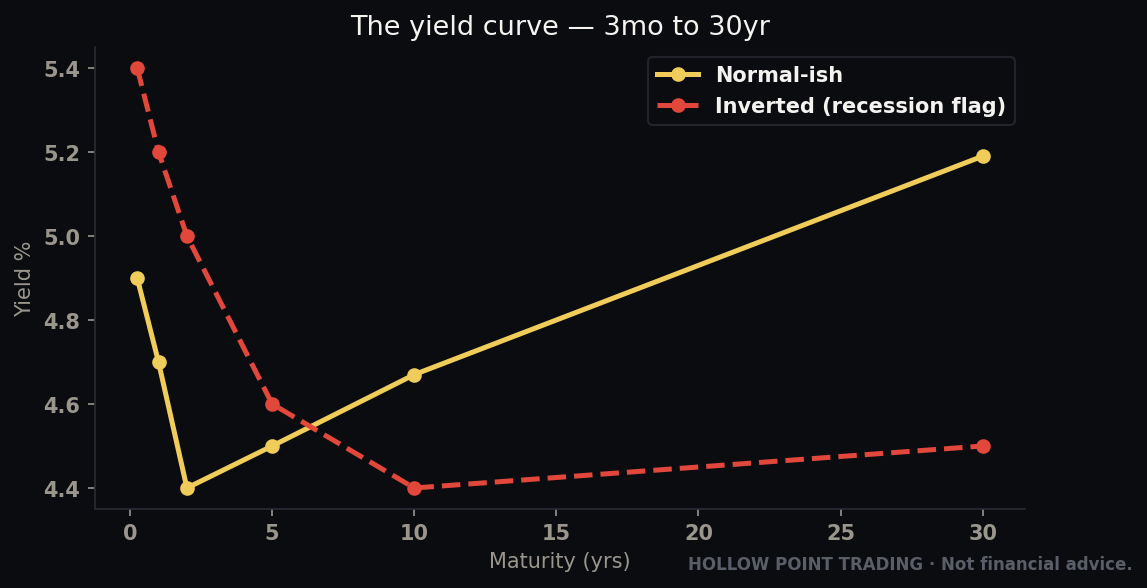
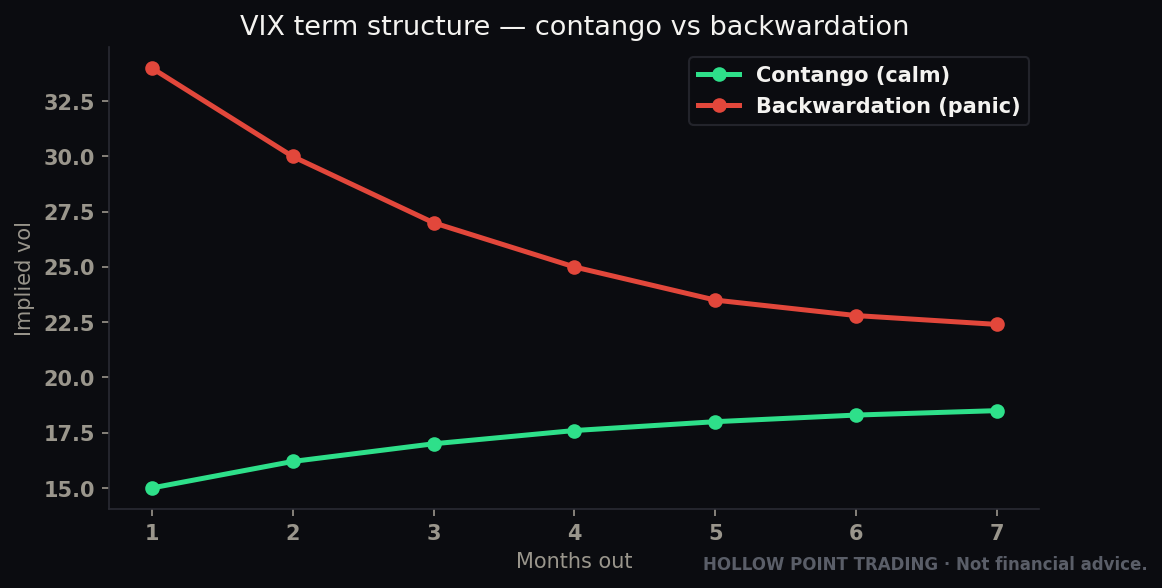
Cross-check the equity read against the bond, credit, and dollar tape. A risk-on equity read (QQQ leading, cyclicals topping the board) is confirmed when HYG (high-yield credit) is firm, TLT is stable-to-down, and the dollar (UUP) isn't spiking. If equities say risk-on but high-yield credit is quietly rolling over and the VIX term structure is flattening, that's a divergence to respect — credit usually leads equities at turns. Three tools, one question: is the risk-on read real, or is it the last leg standing? When they all agree, press. When credit disagrees with stocks, believe credit.
How ETFs Fit the Top-Down Method
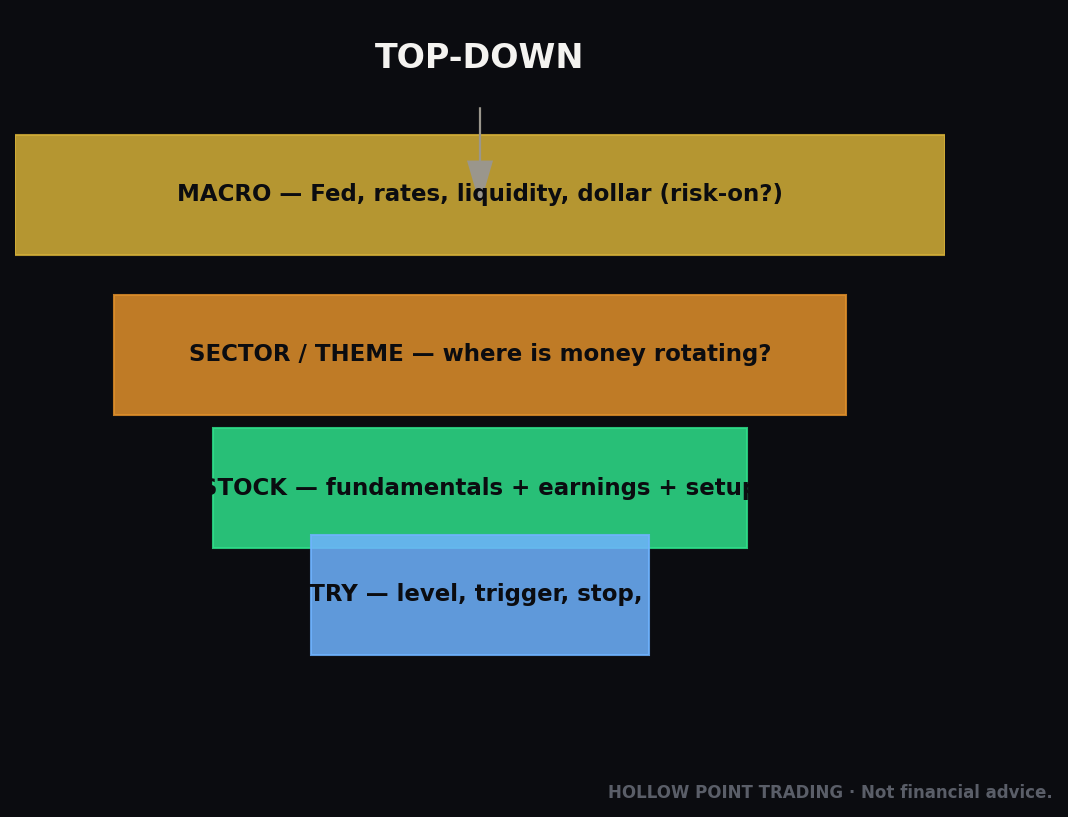
This is where it all comes together into how Hollow Point actually works — macro → sector → stock, top-down. ETFs are the instrument that lets you express each layer of that read cleanly, and to trade the layer you have conviction in without importing risk from the layers you don't.
Layer 1 — Macro / regime. Start with the index ratios. QQQ vs SPY tells you offense vs. base. IWM vs SPY tells you whether risk appetite is broadening or narrowing. SPY vs RSP tells you breadth — is this a real rally or five stocks? XLY/XLP tells you if the consumer trade is on. Layer in the intermarket tickers — TLT (long bonds), HYG (high-yield credit), UUP (dollar), USO/XLE (energy), GLD (gold) — and you've built a full risk-on/risk-off dashboard out of ETFs alone, no exotic data feed required. This defines the regime, and regime sets which direction you're even allowed to lean. Confirm it with your EMA framework: SPY's daily 55-EMA is the bias tell — above it, dips are buyable; below it, rips are sellable. The 12/22/55 stack on SPY and QQQ is your trend confirmation for the whole market.
Layer 2 — Sector. Once the regime is set, rank the 11 SPDRs by relative strength vs. SPY. The regime tells you which kind of sector should lead (risk-on → cyclicals XLK/XLY/XLF; risk-off → defensives XLP/XLV/XLU) and the ranking tells you whether the tape agrees. When macro and the sector ranking line up — reflationary regime AND XLE/XLF topping the RS board — that's aligned confluence, and it points you at the right neighborhood. When they disagree, you've learned something too: a divergence to respect, not a trade to force.
Layer 3 — Stock (or the ETF itself). Now you drop into the leading sector and find the strongest single names — trade the leaders of the leading group, the highest-probability expression. OR, if you don't want single-stock risk (earnings gaps, headline landmines, one CEO tweet), you trade the sector SPDR itself. That's the beauty of the top-down/ETF marriage: you can express a sector view with XLF instead of picking between JPM and GS, or express a pure macro view with SPY/QQQ and skip stock selection entirely. The ETF lets you take exactly the amount of specificity your conviction supports — no more, no less.
A full worked walk-through
Put it together on one hypothetical morning. Macro: SPY is above its rising daily 55-EMA; QQQ/SPY is grinding up; SPY/RSP is flat (leadership broad, not narrowing); HYG firm; dollar soft. Read: healthy risk-on, broad participation. Bias = long, and you're allowed to press because breadth confirms. Sector: you rank the SPDRs — XLF and XLI top the board on 1-month RS, XLU and XLP at the bottom. That's cyclical leadership, and it agrees with the risk-on macro. Neighborhood = financials/industrials. Expression: you pull up XLF. Anchored VWAP reclaimed, price holding above the volume-profile POC, volume rising into a breakout of yesterday's high. You have two choices — trade the strongest bank inside XLF (more juice, but earnings/headline risk) or trade XLF itself (the theme, no single-name landmine). Say there's a bank earnings print tomorrow: you take XLF, skip the single-name gap risk. Rules: invalidation is loss of the VWAP / POC shelf, target is the next weekly resistance, and the setup only goes on if it clears 1:3 R/R. That's the entire method — macro to sector to expression, every layer confirmed, risk defined before entry.
And every layer stays inside the rules: define the level that invalidates the read, size for 1:3 R/R minimum, weight the timeframes so the higher ones govern. An ETF trade gets marked up exactly like a single name — structure, EMAs 12/22/55, VWAP, volume, the invalidation price. The wrapper doesn't change the discipline; it just changes what's inside the position.
How the Pros Use ETFs Differently From Beginners
Same tickers, opposite games. The gap between how a desk trader and a retail beginner use SPY and QQQ is almost entirely in what they're reading and how they size.
Beginners trade the index; pros trade the relationships. A beginner watches SPY go up and down and reacts to the candle. A pro barely looks at SPY in isolation — they're watching QQQ/IWM, SPY/RSP, XLY/XLP, the credit tape, and the VIX term structure, because the relationships lead the index. By the time SPY has confirmed a turn, the ratios turned days ago.
Beginners think ETFs are diversification; pros know the top-10 weight cold. A beginner buys QQQ "to be safe" while already long Nvidia and Apple — and has quietly tripled their megacap exposure. A pro knows exactly what percent of their book is really riding on seven stocks, whether it's held directly or wrapped in an index.
Beginners hold leveraged ETFs; pros rent them. A beginner buys TQQQ as "leveraged long-term exposure" and gets ground down by decay. A pro uses a 3x fund for a two-day expression of a high-conviction trend, with a hard stop, and is out before the chop arrives. To the pro, a leveraged ETF is a scalpel, not a mattress.
Beginners chase the strongest candle; pros trade the strongest leader of the leading group.* Random strength is noise. Strength that sits inside a leading sector inside a confirming macro regime is a signal. The pro's edge is the alignment, not the individual move.
Beginners fear single-name risk or ignore it; pros dial it deliberately. The pro decides, per trade, exactly how much specificity their conviction earns — index for a pure macro view, SPDR for a sector theme, single stock for a high-conviction name — and uses the ETF wrapper to hold only* the risk they actually want. That's the whole point of the wrapper: precision of exposure.
Beginners watch one timeframe; pros let the higher timeframe govern. A beginner reacts to a 5-minute rotation spike. A pro checks it against the daily and discards it if it fights the dominant flow.
The Common Mistakes
1. Confusing on-screen liquidity with real liquidity. An ETF's tradability is only as deep as its underlying basket. SPY is bottomless; a niche bond or single-country ETF can gap and dislocate when its underlying market freezes. Check the underlying, not just the ETF's average volume. A tight spread on a quiet day tells you nothing about the spread on a stressed day.
2. Thinking cap-weight = diversified. Buying SPY or QQQ in 2024–25 was a concentrated megacap-tech bet dressed as broad exposure. Know your top-10 weight. If you're already long Nvidia and Apple, adding QQQ is doubling down, not diversifying.
3. Holding leveraged/inverse ETFs through chop. The single most expensive retail mistake in the ETF universe. Daily reset + volatility = guaranteed decay. These are day trades. If it's in your account overnight, you'd better have a reason and an invalidation.
4. Using DIA as a serious market read. Price-weighted, 30 names, a media relic. Fine as a value/defensive tell, useless as "the market."
5. Ignoring the ratio charts. The information isn't in SPY alone — it's in QQQ/IWM, SPY/RSP, XLY/XLP. Traders who watch only the index they're trading are blind to the rotation happening underneath it.
6. Paying trader fees for a holder job (or vice versa). SPY's spread/liquidity is worth its fee to a day trader and wasted on a buy-and-holder who should own VOO. Match vehicle to horizon.
7. Chasing the ETF instead of the leader. When a sector is running, the SPDR is the average of leaders and laggards. If you have the conviction and can handle single-name risk, the leaders outrun the SPDR. The SPDR is the play when you don't want that risk — a deliberate choice, not a default.
8. Buying commodity/VIX ETFs expecting them to track spot. USO doesn't track oil and VXX doesn't track the VIX — both hold futures and bleed on the roll. If the fund holds futures, "tracks the price of X" is marketing, not mechanics.
9. Trading a thin ETF at the open or close. The AP arbitrage needs the underlying market open to work. In the first and last few minutes, or before the underlying (especially international) is trading, premium/discount gaps widen and spreads blow out. Use limit orders on anything but the most liquid names, and be wary of the opening auction on thin funds.
10. Reading a low-timeframe ratio spike as a regime change. A 5-minute QQQ/SPY pop against a daily downtrend is a bounce, not a rotation. Let the higher timeframe govern or you'll flip your bias on noise.
11. Assuming two S&P 500 ETFs are interchangeable in a crisis. SPY, VOO, and IVV track the same index, but in a fast tape SPY's superior liquidity and options depth matter — the cheap holder funds can have wider spreads exactly when you need to move. Right tool for the horizon includes right tool for the stress.
12. Forgetting the ETF still needs a full markup. The wrapper doesn't exempt you from structure, EMAs, VWAP, volume, and an invalidation price. An ETF trade with no defined risk is the same undisciplined trade as a stock trade with no defined risk — just with a basket inside.
FAQ
Are ETFs safer than individual stocks? Usually less volatile, because a basket dilutes single-name blowups — but "less volatile" isn't "safe." A cap-weighted index ETF concentrates risk in its top holdings, and a leveraged or exotic ETF can be more dangerous than a blue-chip stock. Safety depends on what's inside and how it's built, not on the word "ETF."
Can an ETF go to zero or shut down? A broad index ETF going to zero would require the whole index to go to zero — practically, a non-event. But funds close all the time: if an ETF doesn't gather enough assets, the issuer liquidates it, sells the holdings, and returns cash (a taxable event, on their schedule, not yours). It's not catastrophic, but it's an annoyance you avoid by trading funds with real assets and volume.
What actually happens to my money if the ETF issuer goes bankrupt? The fund's assets are held separately from the issuer's own balance sheet — they belong to the fund's shareholders, not the company. An issuer failing is not the same as a bank failing with your deposits. The holdings get transferred or the fund gets liquidated and you're returned the value. Structurally insulated, by design.
Why does my leveraged ETF underperform even when I got the direction right? Daily-reset decay. It delivers the multiple of each day's return, and compounding those daily multiples through any two-way movement drags the cumulative result below the static multiple. You can be right on direction over a week and still lose to the math if the path was choppy. They're day-to-few-day tools.
SPY, VOO, or IVV — which should I buy? Same index. If you're trading intraday, SPY, for the liquidity and options depth. If you're holding for years, VOO or IVV, for the ~0.03% fee versus SPY's ~0.09%. It's purely a holding-period decision.
How do I even see the ratio charts? In most platforms you type the division directly as a symbol — SPY/RSP, QQQ/SPY, XLY/XLP, IWM/SPY. It plots the relationship as its own chart with its own trend, EMAs, and structure. That's your rotation and breadth dashboard, built for free.
Do ETFs pay dividends? Equity ETFs collect the dividends from their holdings and pass them through to you, usually quarterly. Total-return matters for holders; for a day trader, dividends are noise except around the ex-dividend date when the fund price adjusts down by the payout.
Is there a "best" ETF for a beginner to trade? SPY or QQQ, for one reason: liquidity. Tight spreads and deep options mean your entries, exits, and stops behave predictably. Learn the mechanics on the most liquid instruments before you ever touch a thin sector fund or a leveraged product.
The Cheat-Sheet
What you're buying: a share of a trust that holds a basket tracking an index. Four layers: your share → the trust → the basket → the index. Each layer has a cost or a catch.
The plumbing: APs create/redeem shares in-kind to arbitrage price back to NAV. Keeps price honest — unless the underlying market freezes. Wrapper liquidity = underlying liquidity. A persistent premium/discount is a stress signal, and sometimes the ETF is the honest price, not the broken one.
The Big Four:
- SPY = the market / broad risk (S&P 500, cap-weighted)
- QQQ = growth & risk-appetite juice (Nasdaq-100, megacap tech, rate-sensitive)
- IWM = domestic cycle / credit / broadening (Russell 2000 small-caps)
- DIA = value/defensive tell (Dow 30, price-weighted, quirky — a vibe, not a measurement)
The ratios (your dashboard): QQQ/SPY = offense. IWM/SPY = broadening. SPY/RSP = breadth. XLY/XLP = risk appetite. Divergences lead the index. Type them as symbols directly.
The 11 SPDRs: XLK XLC XLY XLP XLF XLV XLE XLI XLB XLU XLRE. Cyclicals lead risk-on; defensives (XLP/XLV/XLU) lead risk-off. Rank them by RS vs SPY for the rotation map. Remember they're cap-weighted within the sector too.
The rotation clock: early = XLF/XLY, mid = XLK/XLI, late = XLE/XLB, recession = XLP/XLU/XLV. Not a precise clock, but a cycle tell.
Leveraged/inverse (SSO, TQQQ, SQQQ, UPRO, SPXS): daily reset = volatility decay in chop, extra juice in a clean trend. Day-to-few-day trades ONLY. Flat/choppy index can leave a 3x fund deep in the red. Never a hedge you forget.
Regime playbook: Trend → press, ratios persist, dips to rising EMAs. Chop → fade edges, cut size, no leveraged holds. Crisis → correlations to 1, read only risk-on/off, execution gets dangerous, wait for VIX to cool before the sector map means anything.
Multi-timeframe: higher timeframe sets the regime/bias; lower timeframe times the entry; never let a 5-minute spike override a daily trend.
The quiet costs: expense ratio (matters to holders, not traders — pick VOO/QQQM to hold, SPY/QQQ to trade). Tracking error (fund vs index, structural; brutal on futures-based funds like USO/VXX). Premium/discount (price vs NAV, intraday, AP-arbitraged away). Big liquid ETFs: negligible. Exotic ETFs: check all three.
Top-down use: Macro regime from the ratios + intermarket (TLT/HYG/UUP/GLD) → rank the 11 SPDRs → trade the leader of the leading sector, OR trade the SPDR itself when you want the theme without single-name risk. SPY daily 55-EMA = bias tell. Confluence: ratio + 12/22/55 EMA stack + volume profile/VWAP + credit confirmation. Every ETF trade still gets the full markup, the invalidation price, and 1:3 R/R.
The ticker is the last thing you should be looking at. Look through it — to the basket, the weights, the plumbing, the regime, and the relationships underneath — and the ETF stops being a magic token and becomes what it actually is: the cleanest instrument ever built for expressing exactly the view you have, at exactly the specificity your conviction earns.
Bound by rules, feared by trade.