
Most traders think the edge is the entry. Find the magic setup, the perfect indicator combo, the signal that prints money, and the rest takes care of itself. It doesn't. The entry is maybe 20% of the job. The other 80% is a written plan that tells you what you're allowed to trade, a definition of your best setup so precise you can score any chart against it in ten seconds, a daily routine that puts you in the seat prepared instead of reactive, and a journal that feeds your own data back to you until you stop repeating the same three mistakes.
This is the least glamorous piece of trading and the single highest-leverage one. A mediocre strategy with an ironclad plan and an honest journal will beat a brilliant strategy run on vibes every single time, because the brilliant strategy run on vibes isn't actually a strategy — it's a mood. The market pays consistency, and consistency is manufactured, not felt. It is built out of documents, checklists, and reviews that most traders find too boring to keep. That boredom is your opportunity: the edge is sitting in plain sight, unclaimed, because it looks like paperwork.
Let's build the thing that survives your worst day.
The Concept: A Plan Is a Contract You Sign When You're Calm
Here's the core problem the plan solves. The version of you that studies charts on Sunday afternoon — patient, rested, no money on the line — is a different person from the one at 9:47 on Tuesday who just watched price rip through a level, feels the fear of missing out crawling up their neck, and has real money at risk. That Tuesday person is not a good decision-maker. Adrenaline narrows your focus, kills your patience, and makes "just this once" feel reasonable. Neuroscience has a name for it — the amygdala hijack — but you don't need the term to recognize the experience. You've felt your own IQ drop thirty points the instant a trade went against you.
A trading plan is a contract that the calm, smart Sunday version of you writes and the panicked Tuesday version is legally bound to follow. That's the whole mechanism. You make the hard decisions in advance, in writing, when you have nothing to lose by being honest — and then in the heat of the session your only job is to check the chart against the contract. Does it qualify or doesn't it? You are no longer deciding. You are checking. Deciding is expensive and error-prone under stress; checking is cheap and reliable. The plan converts every high-stakes, in-the-moment judgment call into a low-stakes yes/no lookup, and that conversion is where most of the psychological edge lives.
This is why the plan has to be written. A plan in your head isn't a plan, it's an intention, and intentions rewrite themselves in real time to justify whatever you already want to do. The moment it lives in a document you can read back, it stops being negotiable. Same reason the journal has to be written: memory is not a record, it's a story your ego edits. You remember the winners as skill and the losers as bad luck. You remember that you "knew" a move was coming, conveniently forgetting the three times that week the same read was wrong. The journal doesn't let you. It is the one witness in the room that can't be bribed.

Why willpower is the wrong tool
New traders try to solve the discipline problem with willpower — "I'll just be more disciplined next time." This fails predictably, because willpower is a finite tank and it's empty by lunch. Every decision you make draws down that tank: what to eat, which chart to pull up, whether to take the marginal setup, whether to move the stop. This is decision fatigue, and by the afternoon session the depleted version of you is making the biggest financial decisions of the day with the least self-control available. A written plan removes decisions from the tank entirely. The setup is either on the checklist or it isn't. You're not spending willpower resisting a bad trade; you're just reading a document that already said no. The whole design philosophy of this guide is to make the disciplined choice the easy choice — the default, the path of least resistance — because relying on heroic self-control is a plan to fail on your worst day, and your worst day is the one that decides your career.
Discipline over prediction
The HPT ethos runs straight through this: discipline over prediction. You will never predict the market well enough to get rich guessing. Nobody can. The people who look like they're predicting are actually executing a repeatable process with positive expectancy over a large sample and letting the math grind out the result. That's the whole game. You build a repeatable edge, you execute it with discipline, and you let the law of large numbers do the work across hundreds of trades. Any single trade is a coin-flip wearing a costume; the edge only shows up in aggregate. The plan and the journal are the machinery that lets you survive the noise of the individual trade long enough for the signal of the process to pay you.
The Mechanism, Part 1: The Written Plan
Your written plan is a single document — one page is fine, two is plenty — that answers a fixed set of questions before you ever take a trade. If you can't answer one of these in a sentence, that's a hole in your process, and holes are where accounts drain out. Length is not the goal; a two-page plan you actually follow beats a fifty-page trading bible you wrote once and never opened. Let's define each field, build it, and then look at what each one looks like when it's done badly versus done well.
Markets — what you actually trade, and why those
Not "stocks" — which stocks, which futures, which pairs, and why those. The reason to narrow is that every instrument has a personality. NQ (Nasdaq futures) moves faster and wider than ES (S&P futures); a large-cap like AAPL grinds where a low-float small-cap whips. You want to know your instrument's normal daily range, its typical behavior at the open, how it respects levels, when it's liquid and when it's a trap, how it reacts to the same news. You learn that by trading the same handful of things repeatedly, not by chasing whatever's gapping on the scanner at 9:31.
Concretely: if you trade NQ, you should know cold that its average daily range runs a few hundred points, that the first fifteen minutes routinely fake one direction before committing to the other, that it respects prior-day high and low like magnets, and that it can move 40 points in the time a slow stock moves a nickel. That knowledge is edge, and it only comes from repetition on a narrow set of names. Pick three to five. Master those. A trader who deeply knows five instruments beats one who shallowly knows fifty, because the deep trader recognizes when their instrument is behaving abnormally — and abnormal behavior is itself a tradeable signal you literally cannot see without a baseline.
Timeframes — bias, setup, trigger
Which charts define your trend, which one you execute on, and which one you use to time the entry. This is the timeframe-weighted confluence idea, and it's central. You use a higher timeframe to read bias (are we in an uptrend or a downtrend on the daily?), a middle timeframe to find your setup (does the 15-minute give me a pullback into support in line with that daily trend?), and a lower timeframe to trigger (does the 2-minute confirm with a reversal candle so I'm not catching a falling knife?).
The rule that resolves every conflict: the higher timeframe wins ties. A beautiful 5-minute long against a daily downtrend is a low-probability trade wearing a nice outfit. The higher timeframe is a bigger pool of money with more conviction and more inertia; you don't want to be the small boat pointing into the wake of a tanker. A useful discipline is the "three-to-one" spacing — your bias, setup, and trigger timeframes should be roughly 3–5x apart so each one actually tells you something different. Daily / 15-minute / 2-minute works. Daily / 4-hour / 1-hour works for a swing trader. But 5-minute / 3-minute / 2-minute is not three timeframes — it's the same timeframe three times, and it'll have you convinced of a trend that the hourly says is just noise inside a range.

Setups — named, specific, countable
The named, specific patterns you're allowed to take. Not "I trade breakouts" — which breakout, from what kind of base, with what confirming context, after what failed attempt. We'll build a full A+ definition in the next section, but your plan lists your two or three setups by name so that if a chart doesn't match one of them, you already know the answer is no. Naming matters more than it looks: a named setup can be scored, journaled, and reviewed as a category; an unnamed "I just liked it" trade can't be aggregated into anything, so you can never learn whether it works. A trader with three well-defined setups and the discipline to wait for them outperforms a trader who "sees opportunity everywhere," because everywhere is nowhere, and an edge you can't name is an edge you can't measure or repeat.
Risk rules — the non-negotiables that keep you in the game
At minimum:
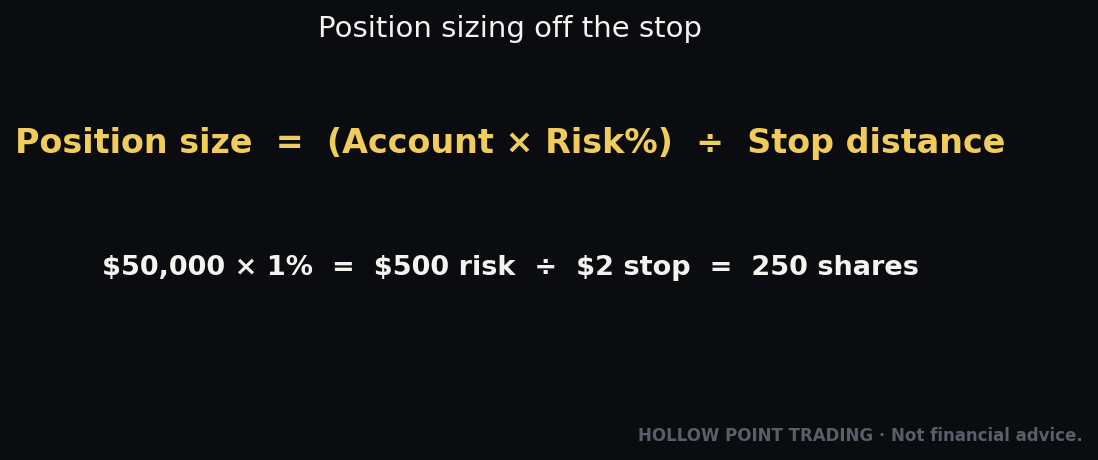
- Risk per trade — a fixed fraction of your account, typically 0.5% to 1%. If your account is $30,000 and you risk 1%, you can lose $300 on a trade. That number, divided by the distance from your entry to your stop, gives you your position size. This is position sizing, and it's the thing that makes a 40%-win-rate strategy profitable and the thing whose absence blows up an 80%-win-rate one. Work an example: $30,000 account, 1% risk = $300 of risk. You're long a stock at $50.00 with a stop at $49.25 — that's $0.75 of risk per share. $300 ÷ $0.75 = 400 shares. The setup dictated the stop; the stop and your risk budget dictated the size. You never do it the other way around — never pick a share count you "feel like" and back into a stop that fits it. That single inversion is responsible for a huge share of blown accounts.
- Reward-to-risk minimum — HPT runs 1:3 R/R. You do not take a trade unless the realistic target is at least three times the distance to your stop. We'll unpack why this number is so powerful in a moment, but for now it's a filter: if the trade can't pay 3-to-1 to a logical, structural target — not a fantasy price — it's not on the menu regardless of how good it looks.
- Daily loss limit — a hard stop for the day. Two losers in a row, or down 3% on the day, and you're done. Closed. Walk away. This exists to stop tilt — the revenge-trading spiral where a loss makes you angry, anger makes you sloppy, sloppy makes you lose more, and you dig a hole in an hour that takes a month to climb out of. The daily loss limit is a circuit breaker on your own psychology, and the reason it's a number and not a feeling is that the moment you need it most is exactly the moment your judgment is least trustworthy.
- Max concurrent risk — how much you'll have on across all open positions at once, so three correlated longs don't secretly become one giant bet. If you're long NQ, long a tech leader, and long a semiconductor name, you don't have three 1% trades — you have one 3% bet on tech that will move together and stop out together on a single index-wide flush. Cap total open risk (2–3% is common) and count correlation toward it.

Session times — when you trade and, louder, when you don't
The market open (the first 30–60 minutes) is high-volatility, high-opportunity, high-chop. Lunchtime (roughly 11:30–1:30 ET) is thin, directionless, and a graveyard for good setups that die in the mud — low volume means levels don't hold, moves don't follow through, and stops get picked off by drift that means nothing. The final hour can trend hard as institutions position into the close. If you know you take your best trades in the first two hours and give it all back trading a boring lunch, then your plan says I trade 9:30–11:30 ET and I close the laptop. Session discipline is some of the cheapest edge available and almost nobody uses it, because "the market's open, I should be trading" is a hard instinct to override. Your journal will eventually prove to you, in R, exactly how much that instinct costs.
Write all of that down. Sign it, metaphorically. That's your contract, and from here forward your job in the seat is not to be brilliant — it's to be faithful to it.
R: The One Piece of Math That Makes the Whole Thing Work
Before we go further, define R, because it's the unit everything in your journal is measured in. R is your risk on a trade — the dollar distance from entry to stop. If you buy at $100 with a stop at $98, your R is $2 per share. A winner that runs to $106 made you $6, or +3R. A loser that hits your stop is −1R. A trade you bail on early for a small loss might be −0.4R. A winner you cut short might be +1.2R even though the target was 3R — and logging it as +1.2R against a planned +3R is how you catch yourself leaving money on the table.
Measuring in R instead of dollars is the professional move because it strips out account size and position size and lets you compare every trade on equal footing. A +3R day on a $5,000 account and a +3R day on a $500,000 account are the same quality of trading. Your journal becomes a stream of R outcomes, and the average of that stream — your expectancy — is the number that tells you whether you have an edge at all. Dollars lie to you emotionally: a $300 loss feels like a catastrophe on a red day and a rounding error on a green one, even when both were the same disciplined −1R. R strips the emotion out and leaves the truth.

Why 1:3 is a cheat code
Here's why 1:3 R/R is such a cheat code. At 3-to-1, you can be wrong more than half the time and still win handily. Watch: take ten trades, risk 1R each. You're right only four times. Four winners at +3R = +12R. Six losers at −1R = −6R. Net: +6R on a 40% win rate. Now run the honest tax on that — spread, slippage, the winners you closed at +2.6R instead of +3R — and you're still comfortably positive. Compare it to the trap most beginners fall into: chasing a 70% win rate at 1:1 R/R. Seven winners at +1R = +7R, three losers at −1R = −3R, net +4R — worse than the 40% shooter, and far more fragile, because a small dip in that lofty win rate flips it negative fast. The 40%/1:3 trader can have a brutal cold streak and survive; the 70%/1:1 trader is one bad week from ruin.
Most new traders obsess over being right. The math says stop obsessing over being right and start insisting on being paid enough when you are. That single reframe — from "how often am I right" to "how much do I make when right versus lose when wrong" — is the difference between a hobby and a business. It also fixes your psychology sideways: once you accept that six of your next ten trades can lose and you'll still be up, a single loss stops feeling like failure. It's just the −1R the math already budgeted for. You stop flinching, and a trader who doesn't flinch executes the plan.
The breakeven table worth memorizing
Every R/R ratio has a breakeven win rate — the win rate at which you neither make nor lose money. At 1:1 you need to win 50% just to tread water. At 1:2 you need 33%. At 1:3 you need only 25% to break even, which means every win above one-in-four is pure profit. At 1:5, breakeven is 17%. Knowing this table changes how a losing streak feels. If your setup wins 45% at 1:3 and breakeven is 25%, then a stretch of four losses in a row isn't evidence your edge is broken — it's ordinary variance well inside what a 45% process throws off routinely. The math tells you when to hold the line and when to actually worry, so you stop abandoning good systems during normal drawdowns, which is the most expensive mistake in trading.
The Mechanism, Part 2: Defining Your A+ Setup
An A+ setup is your highest-conviction, highest-probability trade, defined so precisely that scoring a chart is objective, not a feeling. The purpose is a filter: most of what the market shows you is a B or a C, and B and C trades are where accounts bleed out slowly — not in dramatic blowups, but in a steady drip of marginal trades that each seemed fine. If you only ever take A+ setups, you trade less, wait more, and make more. The hard part is that "wait for the A+" is emotionally brutal — you'll sit through hours where nothing qualifies while price does exciting things you're not in — which is exactly why you need it written down, so the waiting isn't a judgment call you have to win against yourself a hundred times a day.
The confluence stack
A real A+ has a confluence stack — multiple independent factors all pointing the same way. Independence is the key word: five indicators that are all just repackaging price momentum aren't five reasons, they're one reason wearing five hats. Real confluence layers different kinds of evidence — trend, structure, a measured retracement, a volume signature, a lower-timeframe trigger — so that each one that lines up genuinely raises the odds.
The HPT trend engine is EMA 12/22/55 (exponential moving averages of 12, 22, and 55 periods — fast, medium, and slow). When those three are stacked in order (12 above 22 above 55 for an uptrend) and price is on the right side of them, you have a trend, and the fanning of the EMAs — the space widening between them — tells you the trend has momentum rather than rolling over. The daily 55 EMA is the big bias tell: above it, you lean long; below it, you lean short. That's your top-down anchor, and it is deliberately slow. It won't flip on a bad morning, which is exactly what you want from the thing that sets your directional bias for the whole day.

A worked A+ long, the way it reads in your plan
Setup name: Trend Pullback Long. Bias: Daily closes above the 55 EMA and EMAs stacked 12>22>55, fanning up. (higher timeframe agrees) Location: On the 15-minute, price pulls back into a prior support level or the rising 22 EMA — a level, not thin air. (setup timeframe) Confluence: That level lines up with a Fibonacci golden pocket (the 0.618–0.65 retracement of the last up-leg) AND prior-day-high-turned-support. Two-plus reasons the level should hold. Trigger: On the 2-minute, a reversal candle (bullish engulfing, hammer) confirms buyers stepping in. (execution timeframe) Risk: Stop goes below the level/candle low. Entry-to-stop is my 1R. Reward: Nearest logical target (prior swing high) is at least 3R away. If it isn't, no trade.
Now put real numbers on it. Say NQ is in a clean daily uptrend, holding well above its rising 55 EMA. Overnight it ran to a swing high of 20,450, then pulled back through the New York morning. On the 15-minute, price is easing down into 20,300 — which happens to be both the prior-day high (now flipping to support) and the 0.618–0.65 golden pocket of the overnight up-leg, and the rising 15-minute 22 EMA is curling up right into that same zone. That's three independent reasons one price should hold. You drop to the 2-minute and wait — not buying the touch, waiting for proof. A 2-minute bullish engulfing candle prints off 20,298, closing back at 20,330. That's your trigger. Entry 20,332, stop below the candle low at 20,282 — 50 points of risk, your 1R. The next structural target is the overnight high at 20,450, which is 118 points away, or 2.36R. That's the whole trade in one number: 2.36R is below your 1:3 minimum, so despite the gorgeous confluence, this is not an A+ and you don't take it. Or you wait for a deeper pullback that widens the reward, or a tighter trigger that shrinks the risk, until the math clears 3R. The setup looking perfect is not the same as the setup being a trade.
That discipline — killing a beautiful chart on the R/R alone — is the single hardest habit to build and the one that most separates traders who last from traders who don't.
The discipline is subtractive
The mental posture here is subtractive. You're not looking for reasons to take the trade — a caffeinated brain can find five reasons to do anything, and confirmation bias will happily manufacture confluence that isn't there. You're looking for reasons to reject it. You run down the checklist hunting for the one criterion that fails, and any single failed criterion kills the trade, no negotiation. That inversion — defaulting to no, requiring the setup to earn a yes — is what keeps you out of the trades that feel great and lose. Beginners ask "why not take it?" Professionals ask "why take it?" and make the setup answer.
Grading B and C so you can measure them
It helps to formalize the grades. An A+ has the full stack: higher-timeframe trend agreement, a real multi-factor level, a clean lower-timeframe trigger, and R/R ≥ 3. A B is missing one leg — maybe the trend agrees and the level is real but the trigger was sloppy, or the R/R is only 2.2. A C is a single-factor trade: price hit a level, and that's the whole thesis. The point of grading isn't to give yourself permission to take Bs. It's so that when you do slip and take one, you log its grade, and three months later your review can tell you in cold R exactly what your B and C trades cost you. Almost universally, the data shows the same thing: the A+ trades carry the account and the B/C trades quietly bleed it. You can't see that unless you graded and logged them.
How to Use It: The Daily Routine
A plan and an A+ definition are static documents. The routine is what brings them to life every day, in the same order, so preparation happens before the market can rattle you. Structure it into three blocks: pre-market, in-session, and post-market. The order and the sameness are the point — a routine that changes based on how you feel is just mood with extra steps.
Pre-market — build the read before the bell
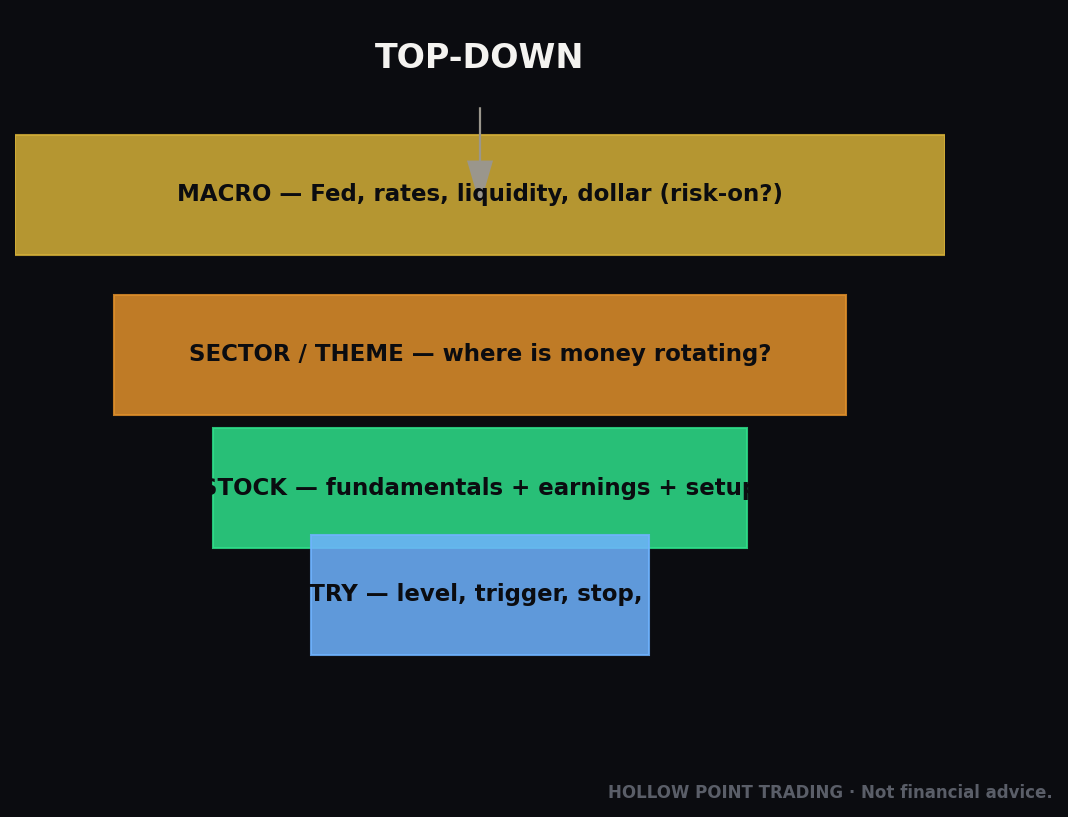
This is the top-down process in action, and the order matters: macro → sector → stock. Start wide. What's the broad market doing — are index futures up or down, is it a risk-on or risk-off morning, is there a major economic print (CPI, jobs report, Fed decision) that will hijack the tape at a specific, known time? A trader who's short into an 8:30 CPI number they didn't know about isn't trading, they're gambling with a blindfold. Mark those event times on your plan and decide in advance whether you stand aside for them.
Then narrow to sectors: which groups are leading, which are lagging, is money rotating out of tech and into energy, is breadth confirming the index or is a handful of names masking a weak tape? Then, and only then, drop to your individual names and mark your levels: prior day high and low, overnight range high and low, the key support and resistance from higher timeframes, the daily and 15-minute EMAs, the golden pockets of the most recent legs. Write your bias for each name in one sentence and the specific price that would flip it — "Long above 20,300, thesis dead below 20,240." Now you have a map. You walk into the open knowing where the fights will happen, so when price gets there you're reading, not reacting. The trader who marked 20,300 last night sees support holding; the trader who didn't sees a random green candle and chases it fifteen points too high.
In-session — execute the checklist, not the emotion
When price arrives at one of your marked levels, you run the A+ checklist. Does the setup qualify? If yes, you size the position off your risk rule, place the entry, place the stop before you're filled or immediately after — never "I'll set it once it goes my way," because it won't, and now you're a deer in headlights holding a naked losing position. Set the target. Then you manage it by the plan you already wrote, not by the P&L ticking on the screen.
The green and red numbers are the single biggest source of bad in-trade decisions. A trade that's up +1.5R and pulling back toward your entry will scream at you to take the small profit before it turns red — and if you obey, you've capped a 3R winner at half of one R, and you'll do it again and again until your average winner is smaller than your average loser and a perfectly good edge is bleeding out through your own exits. The more you can look at the chart and the plan instead of the dollars, the better you execute. Some traders literally hide the P&L display for exactly this reason. And you honor your session times and your daily loss limit without negotiation. Two stops out, you're done — not because today is unwinnable, but because the version of you that just took two losses is not the version that should be sizing the third. The market will be there tomorrow. Your capital and your composure need to be there with it.
Post-market — close the loop
The session isn't over when you flatten. Every trade gets journaled while it's fresh, same day, no exceptions. This is where the compounding actually happens, and it's the step everyone skips because they're tired and the market's closed and it feels optional. It is not optional. The journal is the entire reason you'll be better in six months instead of running the same mistakes on a bigger account. Ten minutes now saves you a recurring monthly loss later. Skip it and you're paying tuition to a school that never mails you the lesson.
The Journal That Actually Improves You
Most trading journals are useless because they log the wrong thing: entry price, exit price, P&L. That's an accounting record, not a journal. It tells you what happened, never why, and why is the only thing you can improve. You can't fix a number. You can fix a decision. A journal that changes your behavior captures the decision, not just the outcome. Here's the full field list for every single trade.
1. The thesis — before the trade, in one or two sentences
Why you're taking it, written before or at entry so it can't be revised after you know how it turned out. "Daily uptrend, 15m pullback into prior-day-high support plus golden pocket, 2m bullish engulfing trigger, target prior swing high at 3.2R." This is the field that lets you separate a good trade from a winning trade — and those are not the same thing. A good trade is one that matched your plan; it can still lose. A winning trade might have been a reckless gamble that happened to pay. Over hundreds of trades, good trades win and bad trades lose, but on any single trade the outcome is noisy. If you only judge yourself by P&L, you'll learn the wrong lessons — punishing good process because it lost, rewarding bad process because it won. The thesis field is how you grade process independent of outcome, which is the only grading that makes you better. Writing it before the outcome is non-negotiable, because a thesis written after you know the result is not a thesis, it's an alibi.

2. The screenshot — mark the chart at entry
A picture of the setup as you took it, with your levels and reasoning drawn on. Do this at entry, not from memory later. Memory lies; the screenshot doesn't. When you review a month of trades, the images let you see patterns your notes miss — you'll notice all your losers cluster at the same time of day, or that your best trades all share the same visual signature (say, the ones where the EMAs were widely fanned before entry, versus the losers where they were tangled and flat). The eye catches what the spreadsheet buries. A folder of a hundred marked screenshots is a pattern-recognition training set you built out of your own money, and flipping through it is one of the highest-value hours you'll spend.
3. R — the outcome in R multiples
+3R, −1R, +0.5R. Not dollars. This is your comparable unit and the raw material for every statistic that matters. Log the planned R alongside the actual R when they differ — planned +3R, actual +1.4R because you bailed early — because the gap between them is a specific, nameable, fixable leak, and it's invisible if you only record what you actually got.
4. The mistake — brutally honest, every trade including winners
Did you follow the plan or not? Entered early before the trigger confirmed? Moved your stop to avoid getting stopped (and then got stopped further away anyway, turning a −1R into a −1.8R)? Took a B setup because you were bored? Sized too big because you were "sure"? Took profit early out of fear and left 2R on the table? Log the mistake even on winners — especially on winners — because a mistake that got rewarded is the most dangerous kind. It teaches your brain that the bad behavior works, and it'll cost you the next time at a worse moment. The oversized YOLO that happened to hit is not a triumph, it's a landmine with the pin half out; label it a mistake in writing while you can still see it clearly, because next time the same behavior will find your account at its most exposed. Naming the mistake is how you stop repeating it. What gets measured gets managed; what gets named gets tamed. If a trade genuinely had no mistake — plan followed to the letter, win or lose — then write "clean," and learn to value that word more than the P&L.
5. The emotion — what you felt, entering and managing
Anxious, greedy, revenge, confident, bored, FOMO, calm. This feels soft and unquantitative and it is one of the most valuable fields in the book. Trading is a performance activity and your emotional state is data. When you can look back and see "every revenge trade I've ever taken lost" or "I only overtrade when I'm bored in the lunch lull" or "my 'confident, calm' entries win at nearly double the rate of my 'FOMO, chasing' entries," you've found an edge that has nothing to do with charts. Most blow-ups are emotional, not analytical — the analysis was fine, the execution was hijacked. This field is your early-warning system, and over time it teaches you to recognize the feeling of a bad trade before you take it, which is the closest thing to a superpower this job offers.

6. The management notes — what you did after entry
Where you took profit, whether you moved the stop, whether you scaled out, whether you followed your exit plan or improvised. The entry gets all the attention and the exit destroys more accounts. Logging your management honestly reveals whether you're a good entry-taker who gives it all back on the exit — an incredibly common and completely fixable problem. Many traders discover, only through this field, that their entries are genuinely excellent and their entire deficit is impatient exits. That's fantastic news, because it means the hard part works and the leak is a single, trainable habit.
Six fields. Thesis, screenshot, R, mistake, emotion, management. Ten minutes per trade. That ten minutes is the highest-paid work you'll do all day, and it pays out later — sometimes months later, when a review surfaces a pattern that fixes a leak you didn't know you had.
Turning Data Into Edge: The Review Cadence
A journal you write and never read is a diary. The edge comes from review — periodically stepping back, aggregating your own data, and letting it tell you what to change. Writing the journal is data collection; the review is where collection becomes edge. Run three cadences, each with a different job.
Daily (10 minutes, same day)
Just log the trades honestly and note one thing you did well and one thing to fix tomorrow. No heavy analysis yet — that's for the weekend, and you don't have enough same-day sample to conclude anything anyway. The daily review's only job is to keep the record clean and fresh and to set a single, concrete intention for tomorrow. One fix. Not ten. Ten fixes is zero fixes.
Weekly (30–45 minutes)
Pull the week's trades together and look for patterns. What was your win rate? Your average win in R versus your average loss in R? Compute your expectancy: (win rate × average win R) − (loss rate × average loss R). Work an example. Say over the week you took 12 trades: 5 winners averaging +3.1R, 7 losers averaging −0.9R (some cut before full stop). Win rate 42%, loss rate 58%. Expectancy = (0.42 × 3.1) − (0.58 × 0.9) = 1.30 − 0.52 = +0.78R per trade. That number is the whole ballgame: a positive expectancy means you have an edge and every trade is, on average, worth +0.78R to you; a negative number means your process is losing money on average and no amount of clever position sizing fixes that — you fix the process or you stop trading it. Position sizing changes how fast a positive edge compounds and how fast a negative one ruins you; it cannot turn a minus into a plus.
Then read your mistake and emotion fields together and find the recurring error this week. Not five different mistakes — the one that keeps showing up. That one is your homework for next week, and it becomes the single "fix" you carry into each daily review.

Monthly and quarterly (deep dive)
This is where journal data becomes real edge, because you finally have enough trades to slice it meaningfully — a handful of trades tells you nothing, but fifty or a hundred starts to speak. Break your results down by variable:
- By setup: Which of your named setups actually makes money and which one feels good but has a negative expectancy? You'll often find one setup carries your whole account and another quietly loses. Cut the loser, run the winner more. Traders resist this because the losing setup is usually the exciting one — the aggressive breakout, the reversal call — and the winner is boring. The data doesn't care what's exciting.
- By time of day: Group R by session. Almost everyone finds a dead zone (usually lunch) where they give back morning gains. The fix writes itself: stop trading that window. This is often the single most profitable discovery in a new trader's first quarter of journaling — not a new setup, just not trading the hours where they demonstrably lose.
- By day of week, by instrument, by emotional state, by grade: Slice every way you can. Maybe you're consistently profitable on three instruments and bleeding on a fourth you took a shine to. Maybe every "confident" trade wins and every "FOMO" trade loses. Maybe your A+ trades run +1.1R expectancy and your B trades run −0.3R, which tells you with numbers exactly what "only take A+" is worth to you in a year.
The move is simple and ruthless: do more of what your data says makes money, and cut what loses. This is why R and honest fields matter so much — you can't optimize what you didn't measure, and you can't fix a mistake you were too proud to write down. Six months of this and you're not guessing about your edge anymore. You know your best setup, your best hours, your worst habit, and your true expectancy. That knowledge — derived from your own trades, not a guru's — is edge nobody can take from you, because it's specific to how you actually trade.
Multi-Timeframe Alignment: Making the Charts Agree
The timeframe field in your plan is worth its own deeper treatment, because misusing it is one of the most common ways a decent trader stays stuck. The principle is nesting: your setup should sit inside your bias like a hand in a glove. The higher timeframe tells you which direction to look, the middle timeframe tells you where the trade sets up, and the lower timeframe tells you when to pull the trigger. Each one answers a different question, and using them out of role is where the trouble starts.
The classic error is letting the lowest timeframe drive the whole decision. A 1-minute chart will show you a "trend" every fifteen minutes, and if you trade off it without the higher-timeframe context you'll get whipsawed to death, buying every 1-minute pop into a 15-minute resistance that was always going to reject you. The fix is a strict top-down sequence: never look at the trigger timeframe until the bias and setup timeframes have already agreed. If the daily says down and the 15-minute hasn't offered a short at a real level, there is nothing on the 2-minute worth looking at. The lower timeframe is a timing tool, not a permission slip.
When the timeframes disagree — stand aside
The most useful thing multi-timeframe analysis does is tell you when not to trade. If your daily is a clean uptrend but your 15-minute has broken structure and is making lower highs, the two are in conflict, and conflict means the odds have degraded to a coin flip. The professional response to a coin flip is no trade. Beginners see the daily uptrend, ignore the 15-minute warning, and get run over by the pullback the middle timeframe was screaming about. Alignment is a gate: all three agree, you have a trade; any disagreement, you wait for them to resolve. Waiting for resolution is not missing out — it's declining to bet on a flip.
Different Regimes: The Same Plan in Trend, Chop, and High-Vol
A plan that only works in one kind of market isn't a plan, it's a bet that this kind of market lasts forever. It won't. The single most important read you make each day is not a level — it's what regime am I in, because the same setup is a gift in one regime and a trap in another.
Trending regime
In a clean trend, pullback setups are king. Price makes a run, retraces into a level and the golden pocket, triggers, and continues — exactly the Trend Pullback Long we built. Your A+ definition is tuned for this regime, and this is when you press: take every qualifying pullback, hold for the full 3R+ because trends give you the room, and trust the higher-timeframe bias to bail out your marginal entries. The mistake here is fading — trying to call the top of a strong trend because it "has to" reverse. It doesn't have to do anything. In a trend, you trade with the tanker, not in front of it.
Choppy, range-bound regime
In chop, the trend engine goes quiet — the EMAs tangle and flatten, price knifes back and forth across them, and every breakout fails. Pullback-continuation setups die here because there's no trend to continue into. The tell is the EMA stack losing its order and its fanning: 12, 22, and 55 braided together and pointing sideways is the chart telling you the trend is on vacation. The correct response is usually to trade less — chop is where good trend-traders donate their profits — or to explicitly switch to a range playbook: fade the edges of a well-defined range back toward the middle, with tight stops just outside the boundary, and take profit at the opposite edge rather than swinging for a runner. And critically, chop compresses your available R: if the whole range is only 2R wide, then a 1:3 trade does not exist inside it, and the honest answer is to stand aside until the range breaks. Many losing weeks are just a trend-trader refusing to recognize they're in a range.
High-volatility regime
When volatility spikes — a Fed day, a war headline, a violent gap — everything widens. Your stops need more room because the noise is bigger, which means the same dollar risk buys you a smaller position (risk budget ÷ wider stop = fewer shares/contracts). Traders who don't adjust get stopped out by noise that means nothing, or worse, keep their normal size on a stop that's now three times its usual width and take a −3R hit on a "1R" trade. The regime demands: size down, widen stops to fit the new noise, target the bigger moves that high-vol offers, and respect that your win rate will drop because the tape is less orderly. Some of the best traders simply refuse to trade the first fifteen minutes after a major scheduled release — not because there's no opportunity, but because the risk is unmeasurable until the dust settles, and an unmeasurable risk can't be sized.
The through-line: the plan doesn't change, but which part of the plan is live changes with the regime. Reading the regime first, before you hunt for a setup, is what keeps you from running the trend playbook into a range and the range playbook into a trend.
Confluence: How the Plan Combines With Other Tools
The A+ definition already stacks confluence, but it's worth showing how the plan absorbs two or three other tools without becoming a cluttered mess of indicators. The rule is that every added tool must answer a different question, or it's not confluence, it's redundancy.
Volume as confirmation
The EMAs and structure tell you the what; volume tells you whether to believe it. A pullback into your golden pocket that arrives on fading volume — sellers running out of ammo — and then triggers with a reversal candle on a volume spike is a far stronger A+ than the same price action on flat, meaningless volume. Volume is independent evidence: it's not derived from price direction, it's a measure of participation. Add one volume read to your checklist — "is the reversal candle backed by a volume spike?" — and you've raised the quality of your triggers without adding a single lagging oscillator.
VWAP for intraday context
The volume-weighted average price is where the average participant is positioned today, which makes it a magnet and a battle line. A Trend Pullback Long that also happens to be reclaiming VWAP after a dip below it is institutions and algos agreeing with your level. As a rule of thumb, longs above a rising VWAP and shorts below a falling one keep you on the right side of the day's real flow. It's a single line that adds a genuinely independent read — where today's money sits — to your structural picture.
RSI divergence for exhaustion
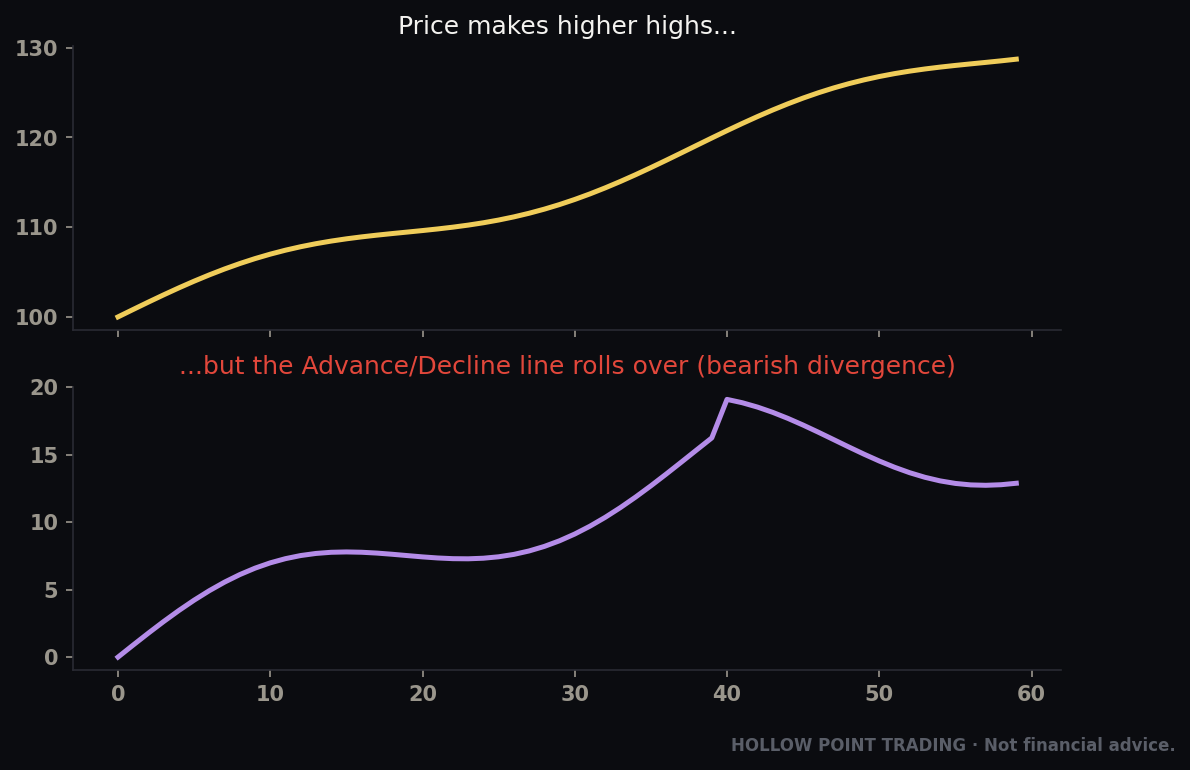
An oscillator like RSI earns its place not as a trigger but as an exhaustion warning. If price is grinding to a new low but RSI is making a higher low, momentum is diverging from price — the move is running out of fuel. That's not a reason to blindly reverse, but it's a strong reason to tighten a trailing stop on a trend trade, or to demand extra confirmation before fading. Used this way, RSI answers "is this move tiring?" — a different question from the EMAs' "which way is the trend?" — and that's what makes it legitimate confluence rather than another momentum echo.
Three tools, three distinct questions: participation (volume), positioning (VWAP), exhaustion (RSI divergence). Layered onto the trend-and-structure core, they sharpen an A+ without burying the chart. Add more than a few and you cross into analysis paralysis, where so many inputs conflict that you can always find one saying yes — which is just an elaborate way of doing whatever you already wanted.
How the Pros Use This Differently From Beginners
The plan, the A+ filter, and the journal are the same tools in a beginner's hands and a professional's. What differs is posture, and the differences are instructive because they show you where you're going.
Beginners look for reasons to enter; pros look for reasons to pass. The beginner scans the chart hunting for a green light and takes the trade the moment they find one plausible argument. The pro assumes no trade as the default and makes the setup clear every hurdle before granting a yes. Most of a professional's screen time produces zero trades, and they're fine with that, because they know their money is made on a small number of A+ setups and lost on the marginal ones they had the discipline to skip.
Beginners fear losses; pros expect them. To a beginner, a −1R is a failure, a personal indictment, a reason to change everything. To a pro, a −1R is a line item the math already budgeted — six of the next ten can lose and the process still pays. That acceptance is what lets a pro take the next A+ setup with a steady hand right after a loss, while the beginner is either paralyzed or on tilt. The emotional flatness looks like talent; it's actually just believing the expectancy math down to the bone.
Beginners obsess over the entry; pros obsess over the exit and the size. The entry is the fun part and the least important. Pros know that position sizing determines survival and exits determine whether a good entry becomes a good trade. They've journaled enough to know their own worst leak is usually an impatient exit, and they've built a specific rule to plug it.
Beginners judge a session by P&L; pros judge it by adherence. Ask a beginner how their day was and they'll tell you a dollar figure. Ask a pro and they'll tell you whether they followed their plan. A pro can have a red day and call it excellent — clean process, disciplined stops, good decisions that happened to lose — and a green day and call it garbage, because they made money doing something reckless that will eventually detonate. Grading adherence over outcome is the mindset the whole journal is built to install.
Beginners collect setups; pros master a few. The beginner is always adding the new pattern, the new indicator, the new guru's system, forever a mile wide and an inch deep. The pro trades two or three setups they know so intimately they can feel when one is high-quality versus marginal. Depth beats breadth, because depth is what lets you recognize the subtle difference between an A+ and a B that looks identical to an untrained eye.
Beginners review when they remember; pros review on a schedule. For a pro the review cadence is a non-negotiable appointment, the same way the pre-market routine is. They know the compounding lives there, and they treat skipping a review the way a pilot treats skipping a pre-flight checklist — not an option, regardless of how experienced they are or how routine it feels.
The Common Mistakes
1. No written plan, just a "system in my head." The in-your-head plan rewrites itself in real time to justify what you already want to do. If it's not written, it's not binding, and if it's not binding it's not a plan — it's a running series of improvisations you'll later mistake for a strategy. The cure is one page of paper and the humility to follow it.
2. Journaling only the outcome. P&L without thesis, mistake, and emotion is accounting, not improvement. You'll learn nothing about why, and why is the only fixable part. An accounting record tells you that you lost; a real journal tells you that you lost because you entered before the trigger while feeling FOMO at 11:40 in the lunch dead zone — and that you can fix.
3. Only journaling losers. Winners with hidden mistakes are the most dangerous trades you take, because the reward cements the bad habit and hides it exactly where you'll never look. Log every trade or the data lies to you by omission, and your worst behavior gets to keep operating under cover of a green P&L.
4. Grading by P&L instead of process. Punishing a good trade because it lost and rewarding a reckless one because it won trains you to trade worse — you're literally reinforcing the wrong behaviors with your own emotional feedback. Grade the decision, not the dice. Over a big sample the dice even out and only the decisions remain.
5. Lowering the A+ bar out of boredom. The trades you take because "nothing's happening and I need action" are B and C setups in an A+ costume, and they're where the slow bleed lives. Boredom is not a signal, it's a state, and the discipline to sit in it is a core trading skill. The market does not owe you entertainment between the setups that actually pay.
6. Skipping the review. Writing the journal and never reading it back is the most common failure of all. The entry is data collection; the review is where the collection becomes edge. No review, no improvement, no point — you've done the boring 90% of the work and abandoned it right before the payoff.
7. Moving stops and abandoning the plan mid-trade. The plan you wrote calm is smarter than the you deciding scared. Widening a stop to avoid getting stopped just converts a disciplined −1R into an undisciplined −2R, and it trains the exact habit that eventually delivers the catastrophic loss. Honor the stop. Honor the target. Honor the daily loss limit. The discipline is the edge.
8. Cutting winners early, letting losers run. The precise inverse of what the math requires. Fear takes the +0.8R before it can become +3R; hope holds the −1R past the stop because "it'll come back." Do this consistently and your average winner shrinks below your average loser until even a high win rate can't save you. The 1:3 math only works if you actually let the winners reach 3R — the number on paper means nothing if your thumb won't let it get there.
9. Position sizing by feeling instead of by formula. Sizing up when you're "sure" and down when you're timid guarantees your biggest bets land on your most emotionally compromised reads — which are systematically your worst ones. Size is output, not input: risk budget divided by stop distance, every time, no override for conviction.
10. Overtrading correlated positions. Three longs in tech feel like diversification and behave like one triple-sized bet that all stops out together on a single index flush. Count correlation toward your max concurrent risk, or discover the hard way that you were 3% on one idea the whole time.
11. Ignoring the regime. Running the trend playbook into a range, or fading a strong trend because it "should" reverse. The setup that's an A+ in a trend is a trap in chop. Read the regime before you hunt the setup, or you'll keep taking technically-correct trades in exactly the conditions that punish them.
12. Revenge trading after a loss. The loss makes you angry, anger makes you want it back now, and the next trade is sized wrong, timed wrong, and taken against the plan — a −1R spiraling into the worst day of the month in twenty minutes. This is precisely what the daily loss limit exists to stop, and it only works if the limit is a hard number you set when calm and obey when furious.
FAQ
How long should my plan be? One page, two at most. The plan you follow beats the plan you admire. If it's long enough that you never reread it, it's failed at its only job. Every field should be answerable in a sentence.
What if I don't have enough trades to compute expectancy yet? Then you don't have a conclusion yet — and acting like you do is its own mistake. Keep the sample honest and small conclusions small. A dozen trades is a story, not a statistic. Somewhere north of thirty to fifty in a given setup you can start to trust the numbers; before that, focus on adherence, not results.
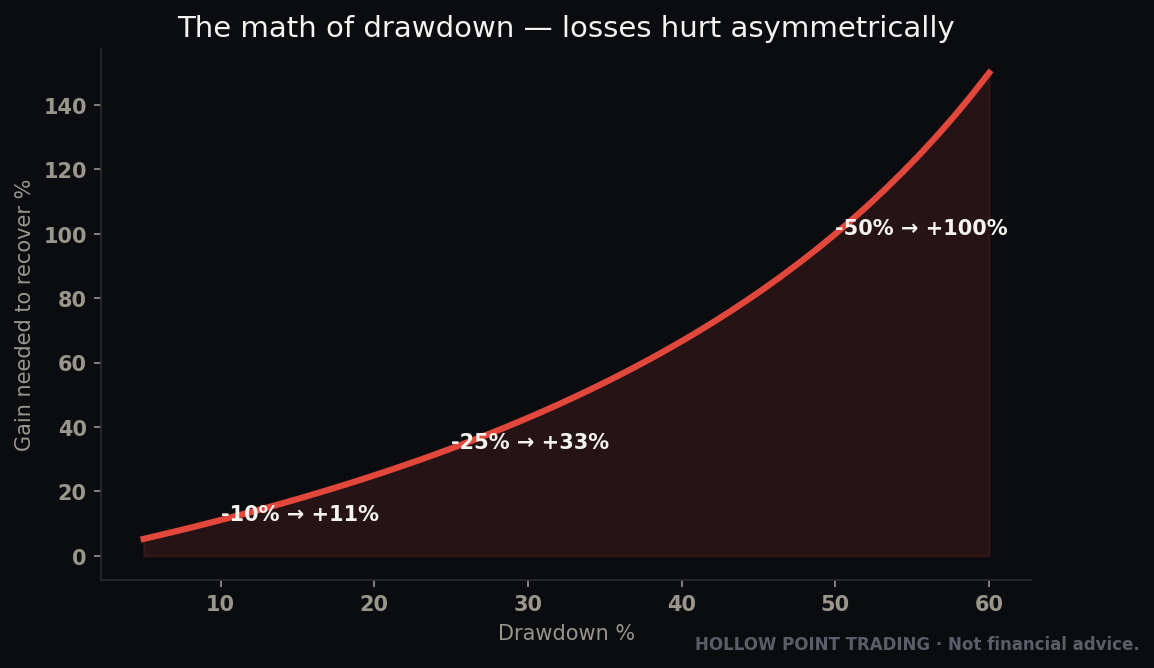
Is 1% risk per trade too conservative? It feels slow. It feels slow precisely because it's designed to keep you in the game long enough for the edge to show up. At 1% risk, a brutal ten-loss streak costs about 10% — survivable, recoverable. At 5% risk that same streak is a 40%+ drawdown you may never climb out of. Slow is the point. The market rewards the trader who's still there.
Do I really have to journal winners? Yes, and they're the more important half. A winner hiding a mistake is a bad habit being paid to stay — the reward silences the alarm that a loss would have triggered. If you only journal losers, your most dangerous patterns are exactly the ones you never record.
What's the difference between a good trade and a winning trade again? A good trade followed your plan; it can still lose. A winning trade made money; it can still have been reckless. Over hundreds of trades the good ones win and the bad ones lose, but any single outcome is noise. Grade the process, not the result, or you'll learn backwards.
My win rate is only 40%. Is my strategy broken? Not if your R/R is 1:3, where breakeven is a 25% win rate — 40% is comfortably profitable. Stop measuring your strategy by win rate alone; measure it by expectancy, which combines win rate and payoff. A 40% shooter at 1:3 crushes a 65% shooter at 1:1.
How do I handle news and economic releases? Mark the scheduled times (CPI, jobs, Fed) on your pre-market plan and decide in advance whether you stand aside. During the first minutes after a major release, volatility makes risk unmeasurable, and unmeasurable risk can't be sized — most pros simply don't trade it. Let the dust settle, then read the new levels the release created.
Can I trade more than three setups? Eventually, maybe — but not while you're building consistency. Depth beats breadth. Master two or three so completely you can feel the difference between an A+ and a B instantly; that recognition is worth more than a wide catalog of patterns you know shallowly.
What if I miss the A+ entry? Let it go. A missed trade costs you zero; a chased trade costs you real R at a worse price with a wider stop that blows your R/R. There is always another setup. FOMO is the tax the market charges the impatient, and the pro simply declines to pay it.
Cheat-Sheet: Print This
The written plan — answer all of these in a sentence each:
- Markets: my 3–5 instruments and why I know them cold
- Timeframes: higher = bias, middle = setup, lower = trigger (spaced 3–5x apart)
- Setups: my 2–3 named plays, defined precisely enough to score in ten seconds
- Risk: ≤1% per trade, 1:3 R/R minimum, daily loss limit, max concurrent (correlation-adjusted) risk
- Sessions: exact hours I trade — and the hours I don't
Define R first: entry-to-stop distance = 1R. Win = +xR, loss = −1R. At 1:3, a 40% win rate is +6R per 10 trades. Breakeven win rates: 1:1 → 50%, 1:2 → 33%, 1:3 → 25%, 1:5 → 17%.
Position size, every time: risk budget ($) ÷ stop distance = size. Size is output, never input. The setup sets the stop; the stop and your risk set the size.
A+ setup filter (all must be true, hunt for the one that fails):
- Higher-timeframe trend agrees (daily vs 55 EMA, stack fanning)
- Price at a real level, not thin air
- Two-plus independent confluence factors stack (EMA / fib golden pocket / prior structure / volume / VWAP)
- Lower-timeframe trigger confirms (reversal candle, ideally on a volume spike)
- Realistic target to a structural level ≥ 3R away
- Any one missing = no trade. Default is no.
Read the regime before hunting the setup:
- Trend → take pullback continuations, hold for full R, don't fade
- Chop → trade less or fade range edges; if the range is <3R wide, stand aside
- High-vol → size down, widen stops to fit the noise, skip the first minutes after major releases
Daily routine:
- Pre-market: macro → sector → stock, mark levels, write one-line bias + the price that flips it
- In-session: run the A+ checklist, size off the risk rule, place the stop immediately, execute the plan not the P&L, honor session times and loss limit
- Post-market: journal every trade, same day, no exceptions
Journal every trade — six fields:
- Thesis (written before/at entry — never after)
- Screenshot (marked, at entry)
- R outcome (not dollars; log planned vs actual)
- Mistake (honest, even on winners; "clean" if none)
- Emotion (entering and managing)
- Management notes (the exit)
Review cadence:
- Daily: log honestly, one win + one fix
- Weekly: win rate, avg win/loss R, expectancy = (win% × avg win R) − (loss% × avg loss R), the one recurring mistake
- Monthly/quarterly: slice R by setup, time of day, instrument, emotion, grade → do more of what pays, cut what loses
The plan is the setup. The journal is the coach. The routine is what puts them to work every day, and the review is what turns a year of trades into a year of learning instead of the same month lived twelve times. None of it predicts the next candle — that's the point. You're not building a crystal ball, you're building a machine that executes a positive-expectancy process with discipline over hundreds of trades and improves itself from its own data. That machine beats the genius guessing every time, because the genius is one bad mood from ruin and the machine just keeps running the edge. Build it this weekend. Trade it Monday.
Bound by rules, feared by trade.