
Most traders lose money in the first thirty minutes of the session. Not because those minutes are cursed, but because they show up to them blind — no plan, no levels, no idea where the overnight action left the ball. They react. The open is the single most information-dense window of the trading day, and reacting to it is like trying to read a book by staring at one word at a time while someone flips the pages.
This guide fixes that. By the end you'll know why the first 15–30 minutes set the tone for the session, how to trade the opening-range breakout without getting shredded by the fake, how to tell a gap that runs from a gap that fills, how to use VWAP as your intraday compass, how the whole read changes in a trending tape versus a choppy one versus a high-volatility one, how to stack the open against two or three other tools for confluence, and how to build a repeatable morning read — the exact HPT 7:45 premarket process we run every single trading day before the market opens.
Read it once. Then run the checklist Monday, and every Monday after that. The edge here is not clever — it's repeatable. That's the whole point.
The Concept: Why the Open Matters More Than Anything Else
The market open is a liquidity event. Overnight, orders pile up. Retail traders leave limit orders that queued while they slept. Institutions model their executions and stage their size. News drops — earnings, economic data, geopolitics, a central-bank speaker — and gets priced into futures and premarket while the regular session is closed and thin. Then at 9:30 a.m. Eastern (8:30 Central, and yes, we run on Central time at HPT), the floodgates open and all of that pent-up intent hits the tape at once.
That collision does something specific: it establishes the day's reference frame. Where price goes in the first half hour tells you who's in control — buyers or sellers — and it prints the levels that the rest of the day will trade around. The high and low of the first 15 or 30 minutes become magnets, walls, and trigger lines. Volume in this window routinely dwarfs midday volume by a factor of three to five. High volume means real conviction and real price discovery. Midday, by contrast, is often low-volume chop where nothing gets decided and where good morning trades go to give their profits back.

The market asks a question; the open answers it
Here's the mental model, and it's the most important paragraph in this guide: the overnight session asks a question — "is this news bullish or bearish, and by how much?" — and the opening range is the market's first real answer, backed by full liquidity. Everything after is the market either confirming that answer or changing its mind. Your entire job in the morning is to (1) know what question was asked overnight, and (2) read the answer cleanly instead of guessing at it.
That framing matters because it reorders your priorities. Beginners obsess over the entry — the exact tick they click buy. Professionals obsess over the question. If you understand what the overnight session was reacting to and how big the reaction was relative to what's normal, the entry becomes almost mechanical. You already know the levels that matter and the directions that make sense; the open just tells you which of your prepared scenarios is playing out.
Why the first half hour has outsized influence
Three structural facts make the open dominant. First, liquidity is highest, so the prices printed are the most "real" — they reflect the largest number of willing buyers and sellers, not a handful of algos ping-ponging a thin book at noon. Second, the range gets set here, and humans anchor to the first prices they see; the opening high and low become psychological reference points that the whole day's participants remember and defend. Third, positioning resets — overnight shorts and longs that were leaning into the news now either get confirmation and add, or get proven wrong and cover, and that covering is fuel. Put together, the open is where the day's story gets written. Miss it, and you spend the rest of the day reading a book you started in the middle.
The Mechanism: The Pieces That Build the Morning
Before we trade anything, you need five moving parts defined. Learn these terms once — we'll use them the rest of the piece, and every play in this guide is built out of some combination of them.
Premarket / overnight session
For stocks, premarket runs roughly 4:00 a.m. to 9:30 a.m. Eastern, though real volume shows up after 8:00. For futures (like NQ, the Nasdaq-100 futures we trade), the market runs nearly 24 hours, so "overnight" means the Globex session from the prior 5:00 p.m. close to the next morning. Either way, this is where price moves before the main event. Premarket is a preview, not the movie — it shows you the plot but with a fraction of the cast. Thin premarket moves get reversed constantly, which is exactly why they matter: they build the levels the real session will test.
The gap
The difference between yesterday's regular-session close and today's open. If a stock closed at $100 and premarket has it trading at $103, it's gapping up three dollars. Gaps happen because new information arrived while the primary market was shut. A gap is a coiled spring — it represents an imbalance that either keeps running or snaps back. There is no such thing as a "neutral" gap; every gap is a statement, and your job is to decide whether the market will stand behind that statement or take it back.
Overnight high and low (ONH / ONL)
The highest and lowest prices traded during the overnight/premarket session. These are not decoration. They are levels where liquidity rests — stop orders, breakout orders, resting size from participants who were active while the main session slept. Price is drawn to them and reacts at them. A break of the overnight high on real volume is one of the cleanest continuation signals you'll get; a sharp rejection at the overnight low is one of the cleanest reversal tells. Mark them every single day, on every name you care about.
The opening range (OR)
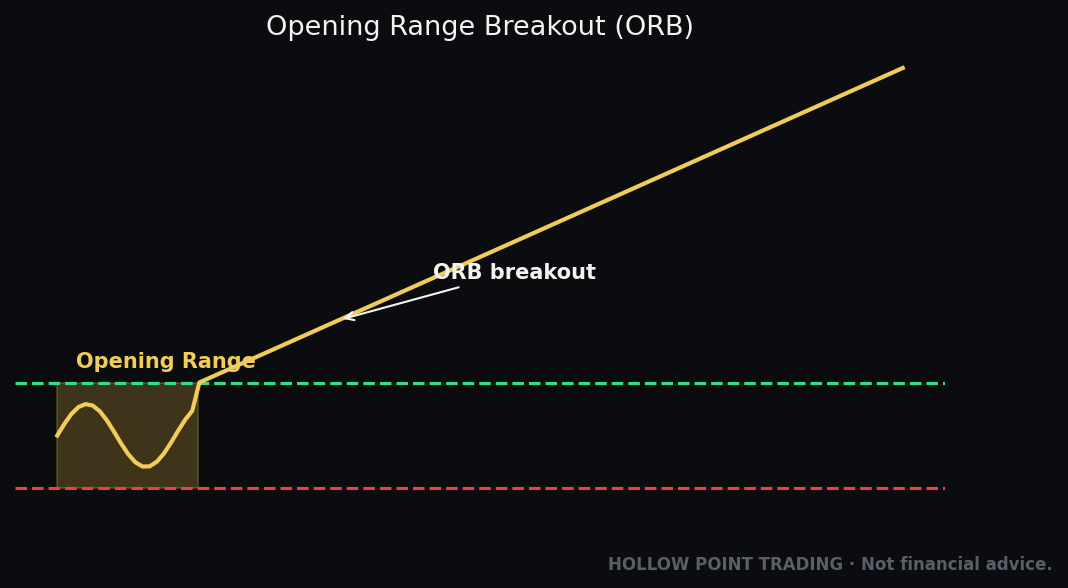
The high and low established during a fixed window after the open — most commonly the first 5, 15, or 30 minutes. The 15-minute range is the workhorse; the 30-minute is more conservative and filters more noise; the 5-minute is fast and fake-prone, for experienced hands only. Draw a horizontal line at the high of that window and one at the low. That box is your opening range, and it's the single most useful structure the morning gives you for free.
VWAP
Volume-Weighted Average Price — the average price of every share (or contract) traded, weighted by volume, reset each session at the open. It's the day's "fair value" line, the level institutions benchmark their fills against. Price above VWAP = buyers in control; price below = sellers in control. It's the single most useful intraday line you can plot, and if you could only keep one indicator for the open, this is it.

Those five pieces — gap, overnight range, opening range, VWAP, and the news that caused it all — are the raw material. Everything below is just different ways of combining them. Now let's turn them into trades.
The Opening-Range Breakout (ORB)
The ORB is the foundational open-session play, and it's beautiful in its simplicity: let the market show you its range for the first 15 (or 30) minutes, then trade the break of that range in the direction it breaks.
The setup
At the open, price whips around as everyone's orders clear. You do nothing but watch and mark. When your window closes — say 9:45 for a 15-minute range — you draw two lines: the OR high and the OR low. Now you have a box. The rule: a decisive break and hold above the OR high is a long trigger; a decisive break and hold below the OR low is a short trigger. The idea is that once price escapes the range on volume, the traders who were leaning the wrong way get squeezed, and momentum feeds itself.
Why it works
The opening range is a battle. When price finally breaks out of it, one side has won the first fight of the day. Everyone who sold at the OR high is now underwater and becomes future buying pressure (they cover). Breakout traders pile in. Stops from the losing side trigger and add fuel in the breakout direction. The path of least resistance opens up because the people who would have resisted are now trapped on the wrong side. This is not magic; it's just order flow. The range defines who's trapped, and the break tells you which way they're trapped.
The problem — the fake
The most expensive mistake in ORB trading is buying the first tick over the high. Markets love to poke a hair above the range, trip the obvious breakout stops, and reverse hard. That's the "opening-range fake-out," and it's how the range hunts liquidity before making its real move. Every experienced trader has been stopped out at the exact high of the day on a breakout that lasted nine seconds. This is why HPT never chases the first candle. We want confirmation, not a poke.
What counts as confirmation
Confirmation is not a feeling; it's a checklist. A real ORB trigger has: (1) a candle close beyond the level, not just a wick — the body of the bar finishes outside the range; (2) volume on the breakout bar that's visibly bigger than the prior several bars; (3) VWAP alignment — price on the correct side of VWAP for the direction of the break; and ideally (4) a hold or retest — price stays out of the range or comes back, tests the broken level from the other side, and holds. Get three of those four and you have a trade. Get one of four and you have a gamble.
Worked example: a clean NQ 15-minute ORB long
Say NQ opens and spends 9:30–9:45 building a range between 20,050 (low) and 20,090 (high) — a 40-point box. Price is holding above session VWAP the whole time, which tells us buyers have the edge underneath.
At 9:52 a 5-minute candle closes at 20,096 — above the high, on volume that's clearly bigger than the prior few bars. That's the trigger: a break on a candle close, not a wick, backed by volume, with price above VWAP. We don't buy the 20,090 touch; we buy the confirmed break and hold around 20,096.
- Entry: 20,096
- Stop: back below the OR high that just broke, giving room for a retest — say 20,082 (below the breakout level and below a logical structure point). Risk: 14 points.
- Target at 1:3 R/R: 14 × 3 = 42 points → 20,138.

Price retests 20,090 (the old high becomes new support — textbook), holds, and grinds to 20,140 by 10:40. That's the trade. Notice what did the work: the range gave structure, VWAP gave bias, the candle close gave confirmation, and the 1:3 math meant we didn't need to be right often to be profitable. One winner paid for three losers, and you can be wrong more than half the time and still print money.
Worked example: an ORB short that respects the mirror
Now the other side, because the rules are symmetric. A stock opens and builds a 9:30–9:45 range of $48.20 (low) to $48.75 (high). Price is below VWAP at $48.55 the whole window — sellers already have the edge. At 9:49 a 5-minute candle closes at $48.11, below the OR low, on the heaviest volume of the morning. Short trigger confirmed: close below the level, volume, below VWAP.
- Entry: $48.11
- Stop: back inside the range above the broken low, say $48.29. Risk: $0.18.
- Target at 1:3: $0.18 × 3 = $0.54 → $47.57.
Price bounces once to retest $48.20 from below, the old support acts as resistance, sellers defend it, and price rolls to $47.55 by 10:15. Same machine, opposite direction. The moment you internalize that longs and shorts are mirror images, you've doubled the number of mornings you can trade.
The retest entry — the disciplined version
Instead of entering on the breakout candle, wait for price to break out, then come back and retest the broken level from the other side. If the OR high held as support on the retest, you enter there with a tighter stop and a cleaner risk profile. You'll miss the trades that never look back — but the ones you catch are far higher quality, and your stop is smaller, which means your 1:3 target is closer and more achievable. At HPT, when the tape is choppy, we default to the retest. Discipline over prediction.

The two ways an ORB entry goes wrong — and how to size for both
There are exactly two failure modes. The fake-out (price pokes out, closes back inside, and reverses) is defended by demanding a candle close and, ideally, a retest — that filters most fakes at the cost of a slightly worse entry price. The breakout-and-fail (price closes out cleanly, you enter correctly, and it still reverses) can't be filtered away; it's the cost of doing business, and it's exactly why the stop lives back inside the range. If you ever find yourself moving your stop farther to avoid being wrong, you've stopped trading the ORB and started hoping. The stop location is not negotiable: it goes beyond the broken level, sized so the loss is one-third of the target, and it does not move against you.
Premarket Levels & Gaps: Gap-and-Go vs. Gap-Fill
A gap tells you the market changed its mind overnight. The whole game is deciding whether that new opinion sticks and runs (gap-and-go) or gets rejected and reverses (gap-fill). Get this read right and you've framed the entire morning. Get it wrong and you'll spend the session fading a freight train or chasing a fade that already happened.
Gap-and-go
The gap is backed by a real catalyst and strong conviction. Price opens gapped, barely pulls back, and continues in the gap's direction. The tell: after the open, price holds above the opening price and above VWAP (for an up gap), the overnight high breaks, and volume stays heavy. The market is saying "the news was real, and this is the new price — get on board or get left." Gap-and-go days are trend days in miniature; they reward pullback buyers and punish anyone trying to pick a top.
Gap-fill
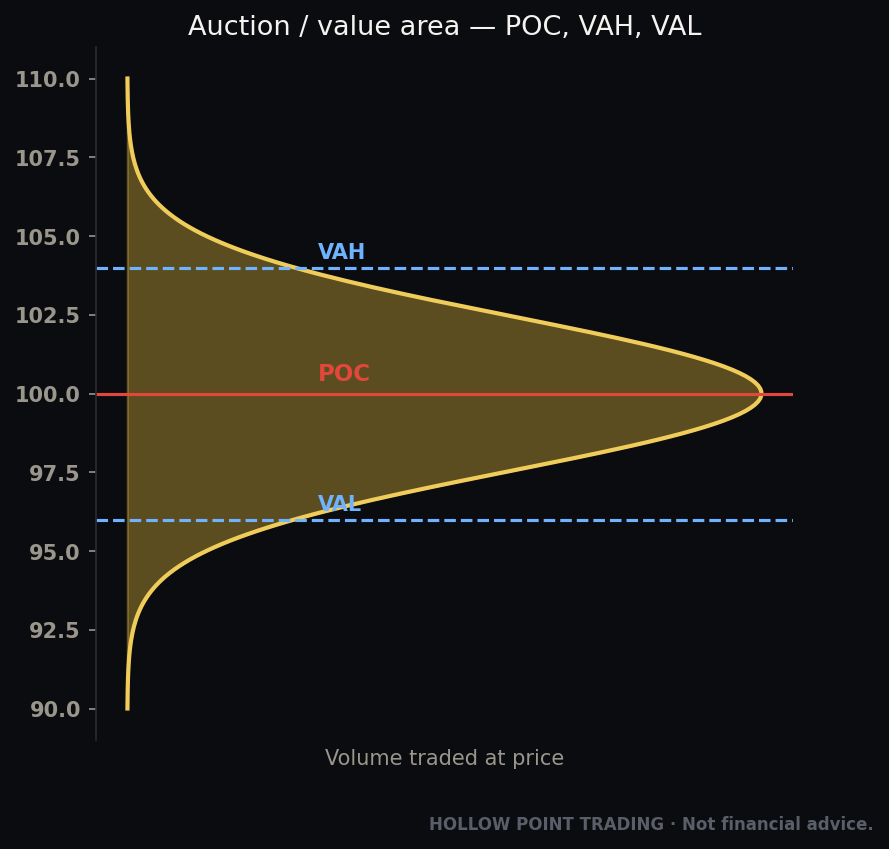
The gap was thin, emotional, or overdone — driven by low overnight volume or a fade-able reaction. Price opens gapped, then drifts back toward the prior day's close to "fill" the empty space on the chart where no trading happened. The tell: price fails to hold above VWAP, rejects at the overnight high, and starts making lower highs. The imbalance is being corrected because there was never enough real demand behind it. The chart abhors a vacuum, and an unearned gap is a vacuum.

How to tell them apart — a practical read
- What caused the gap? A hard catalyst — earnings beat, guidance raise, an analyst upgrade with a number, real macro data — favors gap-and-go. A vague drift with no news, or a sympathy move off some other stock's news, favors gap-fill.
- Volume. Heavy premarket and opening volume supports continuation. Thin volume supports a fill — a gap nobody's trading is a gap nobody believes.
- VWAP behavior in the first 15 minutes. Holding above VWAP after an up gap = go. Losing VWAP and staying under = fill. This is the fastest single tell.
- The overnight high/low. For an up gap, if price breaks and holds the overnight high, that's continuation fuel. If it rejects there, the fade is on.
- Gap size vs. average range. A gap that's already a big chunk of the stock's typical daily range (its ATR) has less room to run and is more prone to fill. A gap that's a small fraction of the ATR has plenty of room and continues more easily.
Worked example: reading a gap on a stock
A stock closed at $148. Earnings beat after the bell; premarket it's trading $156 — an $8 gap up, on heavy volume. Overnight high is $157.20.
At the open it holds above $156, tags $157.20, pulls back to $155.80 (holding above VWAP at $155.20), then breaks $157.20 on volume. That's a gap-and-go: catalyst is real, volume is there, VWAP holds, ONH breaks. You're looking for longs on the pullback-and-go, not fades. Entry on the ONH break at $157.30, stop under VWAP at $155.10 (a wide $2.20, so size the position down), target at 1:3 near $163.90.

Flip it: same $8 gap, but on a fuzzy analyst note and thin volume. At the open price can't reclaim $156 after the first push, rolls back under VWAP by 9:40, and starts printing lower highs. That's a gap-fill setup — the play is short toward the $148 close, with the overnight high as your invalidation. If price reclaims $157.20 and holds, you're wrong; get out.
Notice the same gap produces opposite trades depending on volume, VWAP, and the overnight level. That's the whole point: the gap isn't the signal — the reaction to the gap is. Beginners trade the gap. Professionals trade the reaction.
The partial fill and the "gap-and-snap"
Reality is messier than two clean buckets. The most common real-world pattern is the partial fill: an up gap pulls back to fill half the empty space, finds support at a prior level or VWAP, and then resumes higher. This is why you don't blindly short every gap toward the close — you wait to see where the fill stalls. If the pullback holds VWAP and a prior-day level, the gap-fill thesis is dead and the gap-and-go thesis is reborn. The other trap is the gap-and-snap: price opens, makes a hard run in the gap direction for five minutes, sucks in every breakout trader, and then snaps violently back through the open. The defense is the same as always — demand a candle close and a hold, not a first-minute spike.
Gaps into a prior level are different animals
A gap that opens right into a significant prior level — yesterday's high, a weekly resistance, a round number — behaves differently than a gap into open air. Into a level, expect a reaction: the level either rejects price (fade setup) or breaks and becomes support (continuation setup). Into open air, with no nearby structure, gaps tend to keep running because there's nothing to lean against. Always ask not just "how big is the gap" but "what did the gap open into."
VWAP Off the Open: The Line That Decides Bias
VWAP is your intraday compass. Reset at the open, it tells you the market's volume-weighted fair value in real time, and where price sits relative to it is the cleanest bias tell you have. Everything else on the chart is context; VWAP is the verdict.
The three states
Above VWAP = long bias. Buyers are paying up; the average buyer of the day is in profit. On pullbacks, VWAP acts as support. Below VWAP = short bias. Sellers are in control; the average seller is in profit and VWAP acts as resistance on bounces. Whipping across VWAP repeatedly = no-trade chop. The market hasn't decided; don't force it. The number of accounts blown trying to trade a VWAP-chop morning would fill a stadium. When the line is flat and price is stitching back and forth across it, the highest-skill move is to close the platform and go for a walk.

Stacking VWAP with the range
The highest-probability morning trades line up two or more of our tools in the same direction. An ORB long that also holds above VWAP is far stronger than an ORB long fighting VWAP from below. A gap-and-go that reclaims and holds VWAP is confirmed; one that can't is suspect. This is timeframe-weighted confluence in miniature — stack the reads, and only act when they agree. If the OR high break, the VWAP position, and the gap direction all point the same way, you have three independent witnesses telling the same story. That's an A-setup. One witness is a rumor.
The cleanest VWAP entry
Price is above VWAP (long bias), pulls back to VWAP, prints a rejection candle (a hammer, a bullish engulfing — a bar that shows sellers tried and failed), and resumes up. Your stop goes just below VWAP; your target rides the trend at 1:3. When VWAP breaks and holds against you, the bias flipped — respect it and exit. This "pull back to VWAP and reject" setup is arguably the single most reliable intraday entry that exists, precisely because so much institutional order flow benchmarks to that line. When a fund needs to buy and price dips to VWAP, that's where they buy; you're just front-running a structural bid.

VWAP bands and the extension read
Add the standard-deviation bands to VWAP (most platforms offer a one- and two-sigma band) and you get a second layer of information. Price riding the upper band on a gap-and-go morning tells you the trend is strong — don't fade it, ride it. Price stabbing the second band and rejecting tells you the move is stretched and a mean-reversion pullback toward VWAP is likely — a place to take profits on a runner, not to add. On a chop day, price oscillating between the bands and VWAP gives you the range boundaries. The bands turn VWAP from a single line into a full map of where price is cheap, fair, and expensive relative to the day's real activity.
How the Open Behaves in Different Market Regimes
The same tools give different readings depending on the weather. A trader who runs the identical playbook in a raging trend and a dead chop will get chopped up half the time and wonder why. Regime awareness is what separates a mechanical checklist-follower from an actual analyst.
Trend day
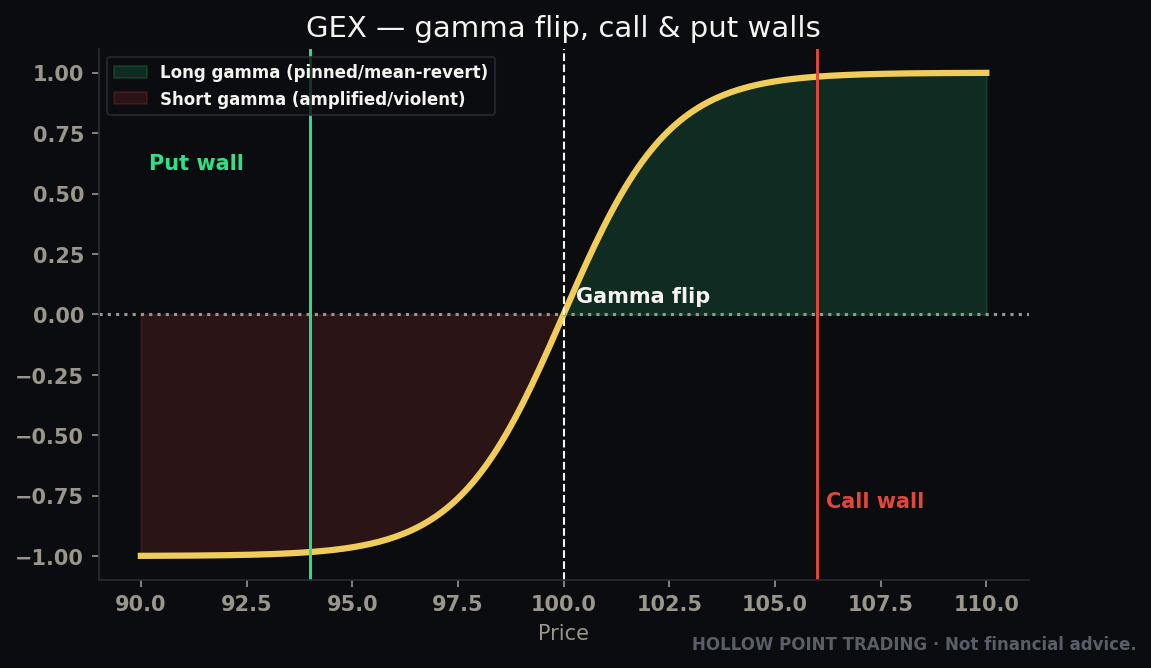
On a trend day, the open sets a direction and price never looks back. The opening range breaks early, VWAP slopes cleanly in the trend direction, and every pullback to VWAP or to the broken OR level gets bought (or sold). Here the ORB and the VWAP-pullback are gold. The mistake to avoid is fading — trying to pick the top or bottom because price "feels extended." On a trend day, extended gets more extended. Ride pullbacks, trail your stop, and let the runner run past the 1:3 target if structure supports it.
Chop / range day
On a chop day, the opening range holds, VWAP is flat, and price rotates between the OR high and OR low all morning. Breakouts fake out repeatedly. Here the ORB is a trap and the correct play flips: you fade the edges of the range — short the OR high rejection, long the OR low bounce — targeting the opposite side or VWAP in the middle. Even better, you simply trade less. Range days have small ranges by definition; the reward is thin and the fake-out risk is high. The single best chop-day skill is recognizing it early (flat VWAP, two failed breakouts) and dropping your size or standing aside.
High-volatility day
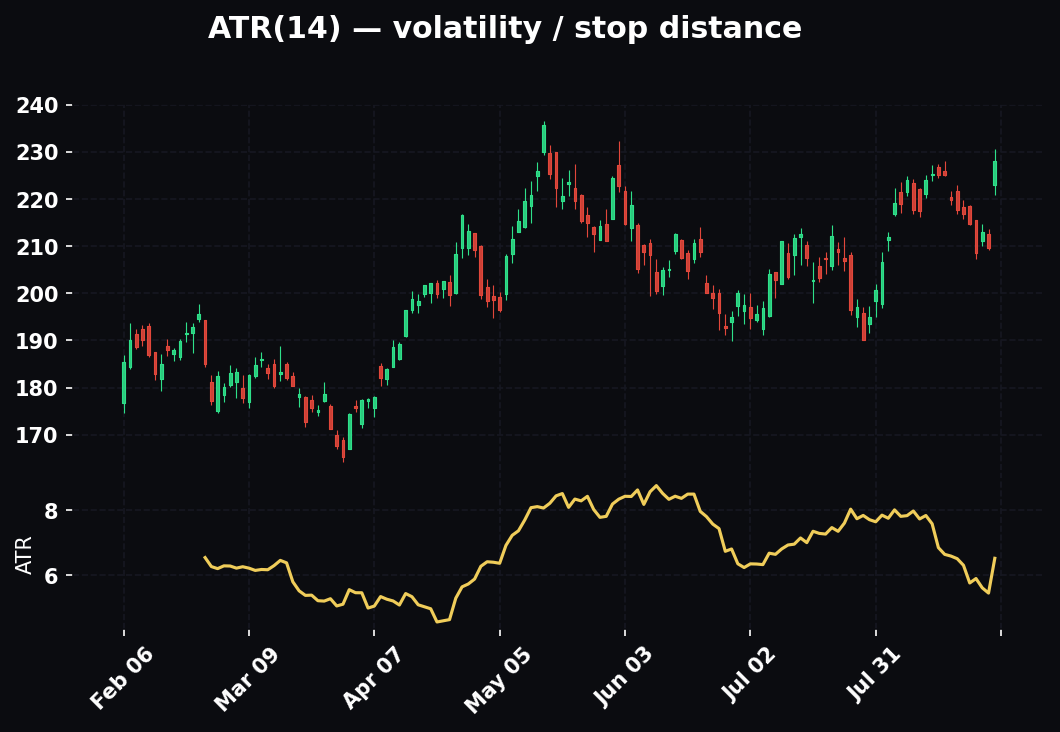
High-vol days — CPI, FOMC, a major earnings-driven index move, a geopolitical shock — blow the normal ranges out. The opening range might be three times its usual width; VWAP whipsaws violently; stops that would be safe on a normal day get run instantly. The adjustments: widen your stops and shrink your size proportionally so the dollar risk stays constant, demand even more confirmation before entering, and respect that the first 15 minutes may be pure noise that needs 30 or even 45 to resolve. On these days, the money is often made not in the first move but in the second — after the initial spike-and-reverse shakes everyone out and the real trend emerges. Patience pays double.
How to tell which regime you're in — fast
Three quick reads by 9:50: Is VWAP sloping or flat? A sloping VWAP means trend; a flat one means chop. Did the opening range break and hold or break and fail? A clean hold means trend; a fail means chop. Is the current bar range wide or narrow versus the prior days? Wide means high-vol; normal means normal. Two of three pointing the same way names your regime, and the regime tells you which playbook to run. Don't decide the regime by 9:31 — give it the first fifteen to twenty minutes to declare itself.
Multi-Timeframe: The Open Doesn't Live Alone
The opening range is an intraday structure, but it exists inside larger timeframes that either bless it or doom it. A 15-minute ORB long that's breaking straight into the daily 55-EMA from below is fighting gravity; the same long breaking away from a reclaimed daily level with room overhead is running downhill. Always zoom out before you commit.
The three-screen morning
Run three timeframes together. The daily gives you the trend backbone and the big levels — prior day high/low/close, the weekly and monthly opens, the daily EMA 12/22/55 stack. The hourly or 15-minute gives you the intraday structure and the swing levels the last day or two carved out. The 5-minute or 1-minute gives you the execution — the opening range, the exact break, the entry candle. You form the thesis on the daily and hourly, and you time the trigger on the 5-minute. Beginners live entirely on the 1-minute and get whipsawed by noise they'd never have entered if they'd glanced up a level.
Higher timeframe levels as targets and walls
The single most useful multi-timeframe habit: mark the higher-timeframe levels on your execution chart. When your ORB long triggers, you want to know that the next daily resistance is 30 points up (plenty of room for your 1:3) versus 6 points up (your target is blocked before you get there). A breakout into a wall is a trap; a breakout into open space is a gift. The higher timeframe draws the map; the open just tells you when to start walking.
When timeframes disagree
If the 5-minute screams long but the daily is in a clean downtrend below a falling 55-EMA, you have a conflict, and conflicts get resolved in favor of the higher timeframe for size and expectations. You can still take the intraday long, but you treat it as a counter-trend scalp — smaller size, tighter target, quicker to take profit, no expectation of a runner. Save your full size and your runners for the mornings where the 5-minute and the daily agree. Timeframe-weighted confluence isn't a slogan; it's literally weighting the daily's vote more heavily than the 5-minute's when they disagree.
How It Fits the Top-Down Process
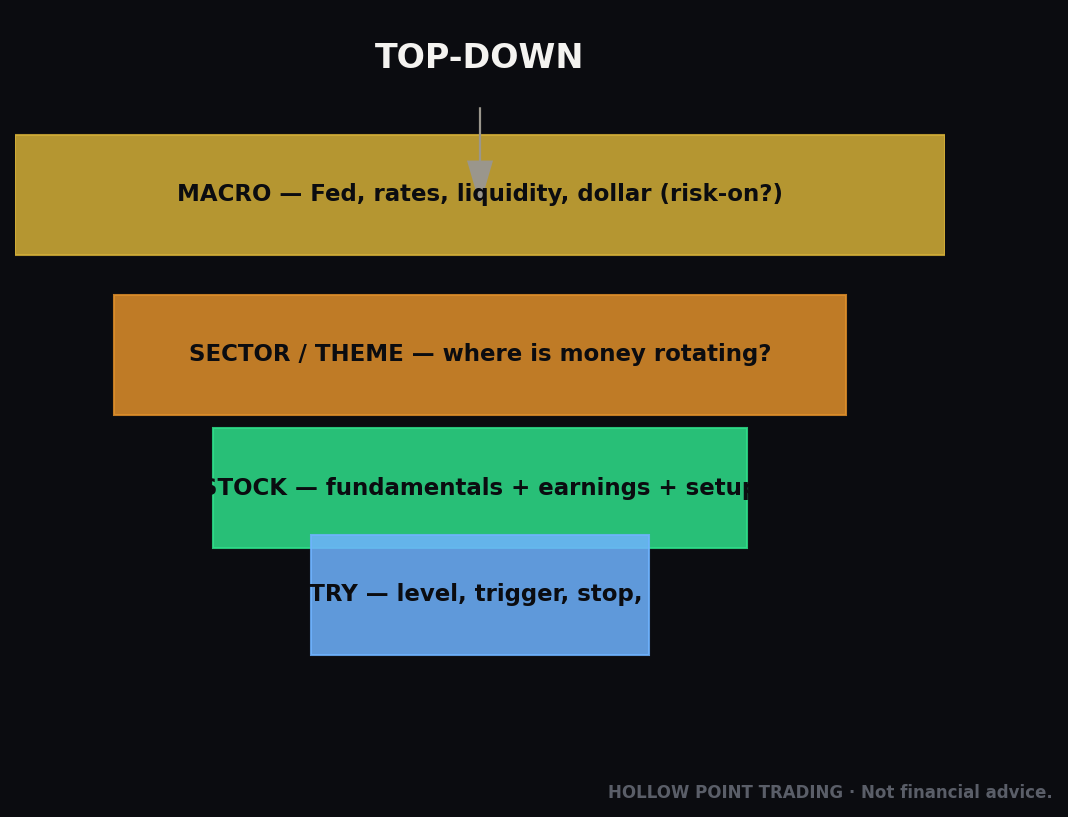
None of these tools live in isolation. At HPT everything runs macro → sector → stock, top-down, and the morning read is where that framework meets the tape.
Macro first
Before you look at a single stock, know the broad tape. Where are index futures — ES, NQ, YM? Is the overall market gapping up or down? What's the economic calendar — is there an 8:30 CPI print or a 2:00 Fed decision that will freeze or detonate the tape? A beautiful ORB long in a stock means little if the entire market is puking on a bad inflation number. The macro sets the permission for your trade. You do not get to be long a stock into a collapsing index and call it a high-probability trade; you're fighting the tide, and the tide wins.
Sector second
Is the stock's sector leading or lagging the market this morning? Relative strength matters: a stock gapping up while its sector and the broad market are green is a different animal than one gapping up alone into a red tape. You want your trade swimming with the current at two levels above it. A semiconductor name breaking its OR high while the whole semi sector is leading a green market is confluence; the same break while semis are the worst sector on the board and the market's red is a setup begging to fail.
Stock last
Now — and only now — you apply the opening range, gap read, overnight levels, and VWAP to the individual name. The technical setup is the trigger, but macro and sector are the thesis. The trend backbone is the EMA 12/22/55 stack; on the daily, the 55 EMA is the bias tell. If your intraday ORB long agrees with a stock that's above its rising daily 55 EMA, in a strong sector, in a green market — that's an A+ setup. If it fights all three, it's a fade you'll regret. The order matters: you don't find a stock you like and then check the market. You check the market, narrow to strong sectors, and then find the best-positioned stock inside them.
Confluence isn't a buzzword. It's literally counting how many independent reads point the same way, weighting the higher timeframes more, and only pulling the trigger when the count is lopsided in your favor. Three green lights — macro, sector, stock — plus a confirmed technical trigger is the whole job.
Confluence in Practice: Stacking the Open With Other Tools
The open is strongest when it's not alone. Here's how it combines with three tools you likely already have on the chart.
Confluence 1 — Opening range plus prior-day levels
Prior-day high, low, and close are the most-watched levels on Earth after round numbers. When your OR high sits right at the prior-day high, a break of both simultaneously is far more powerful than a break of either alone — you're clearing two walls of resting orders in one move. Conversely, when the OR high is a few ticks below the prior-day high, expect the prior-day high to cap the first push; the smart entry waits for that level to break, not the OR high. Always overlay the two. The relationship between the opening range and the prior day's structure tells you where the real battle line is.
Confluence 2 — VWAP plus the golden pocket
When an up-gap pulls back, the highest-quality bounce spot is where two supports overlap: session VWAP and the 0.618–0.65 Fibonacci retracement (the "golden pocket") of the opening drive. Draw the fib from the session low to the first-push high; if the 0.618–0.65 zone lands on or near VWAP, that confluence is a magnet for buyers. A rejection candle there, holding both VWAP and the golden pocket, is one of the cleanest continuation entries the morning offers. Two independent methods agreeing on the same price is worth more than either method's signal alone.
Confluence 3 — Opening range plus RSI divergence
On a chop or reversal day, pair the range edges with momentum. If price pushes to a new OR high but RSI (using the HPT Elite RSI or a standard 14) prints a lower high — bearish divergence — the breakout is unlikely to hold; that's a fade-the-edge signal, not a chase-the-break signal. The reverse at the OR low (price lower low, RSI higher low) flags an exhaustion bounce. Divergence doesn't time entries by itself, but layered onto the opening range it's a powerful filter that keeps you from buying breakouts that momentum isn't backing. The range says where; the divergence says whether.
How the Pros Use the Open Differently From Beginners
The tools are public. The difference is entirely in the execution and the discipline. Here's where the gap actually is.
Beginners trade the first candle; pros trade the first confirmed move.* The novice clicks buy the instant price ticks over the OR high, terrified of missing it. The professional lets the fake-out happen, watches it fail, and enters on the retest with a smaller stop and a clearer picture. The pro's fear is not missing the move; it's taking a bad entry.
Beginners see a gap; pros see a reason. The novice shorts every gap up because "it'll fill." The professional asks what caused it, checks the volume, watches VWAP, and only then decides whether it's a fade or a chase. Same gap, opposite conclusion, because the pro read the why*.
Beginners have one playbook; pros have three. The novice runs the identical breakout strategy on a trend day and a chop day and can't understand the inconsistent results. The professional reads the regime by 9:50 and switches between breakout, fade, and stand-aside accordingly.
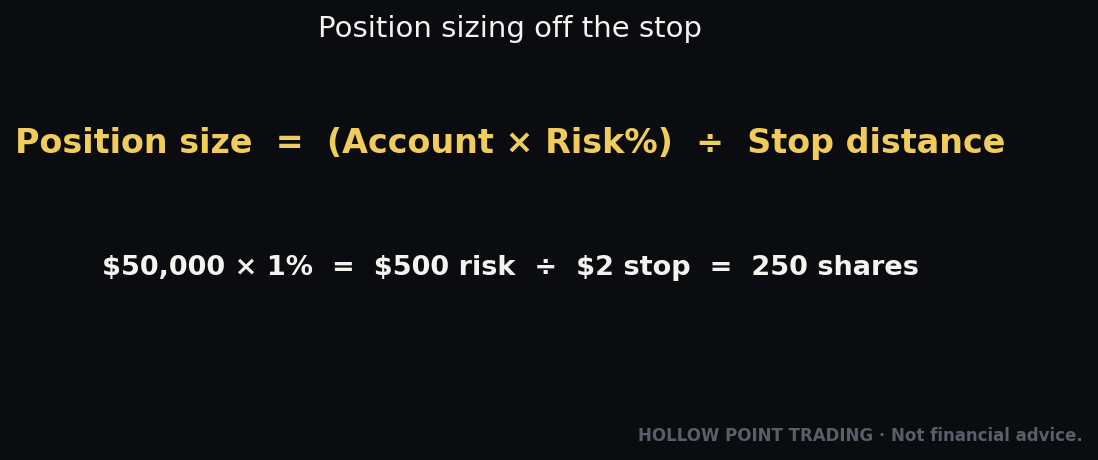
Beginners size by conviction; pros size by risk. The novice bets big when they "feel sure" and small when they don't — exactly backwards, because certainty is a feeling, not an edge. The professional sizes every trade so the dollar loss at the stop is constant, regardless of how good the setup feels. The stop distance sets the size, not the emotion.
Beginners move stops to avoid being wrong; pros accept being wrong cheaply. The novice, watching a trade go against them, slides the stop farther to "give it room," turning a planned small loss into an account-ender. The professional's stop is set before entry and does not move against the position — ever. A small loss taken cleanly is a cost of business; a large loss taken emotionally is how careers end.
Beginners chase the whole move; pros take the piece that's theirs. The novice holds a winner too long trying to catch the exact top, then watches it round-trip. The professional takes the 1:3, maybe trails a runner with a mechanical rule, and is at peace leaving money on the table because the plan said so.
Beginners react to the open; pros have already decided. This is the deepest difference. By the time the bell rings, the professional has written down every level, every trigger, every invalidation. The open is an execution problem for them. For the beginner it's a decision problem, and decisions made in the heat of the open, on adrenaline, are almost always worse than decisions made calmly at 7:45 a.m.
The HPT 7:45 Premarket Process
This is the standing HPT morning routine — the read is built and posted before 7:45 a.m. Central, every trading day, so we walk into the open with a plan instead of a reaction. Run this exact sequence.
1. Macro scan (the tape). Where are the index futures — ES, NQ, YM? Up or down, and by how much? Check the VIX (fear gauge — spiking or bleeding?), DXY (dollar), and yields. Note the day's economic calendar and the exact times of any prints. Flag anything that freezes the morning. This is the "permission" layer — it tells you which direction the day even allows.
2. Mark the overnight levels. On every name you care about, draw the overnight high and overnight low, and yesterday's regular-session high, low, and close. These are your reaction levels. Add prior-day VWAP close and any obvious round numbers. Ten minutes of level-drawing now saves you from a hundred bad reactions later.
3. Read the gaps. For each watchlist name: is it gapping? Why — what's the catalyst? How big is the gap relative to the average daily range? Form a hypothesis: gap-and-go or gap-fill, and what would confirm each. Write the hypothesis down so you can hold yourself to it when the open tries to bait you into the opposite.
4. Build the watchlist with levels and triggers. Longs, shorts, and neutrals. For each, write the specific price that triggers the trade and the price that invalidates it. No vague "watching AAPL" — it's "AAPL long over the overnight high at 232.40, invalid below VWAP." A level without a trigger and an invalidation is just a hope with a chart attached.
5. Set the R/R. Every planned trade gets a 1:3 minimum reward-to-risk. If the clean stop is too far from the realistic target to make 1:3 work, the trade doesn't qualify — skip it. This one rule filters out most bad ideas before they cost you a dime, because most bad trades are bad precisely because the good entry is gone and the risk no longer fits the reward.
6. Wait for the open, then let the opening range build. Do not trade the first few minutes of noise. Mark the 15-minute range. Watch VWAP. Watch which of your premarket hypotheses is confirming. Read the regime — trend, chop, or high-vol. Then execute the plan — only the setups that confirmed, in the direction the macro and sector permit, in the style the regime rewards.
That's it. The magic isn't any single indicator — it's that by 7:45 you already know what you'll do at every important price, so the open becomes an execution problem, not a decision problem. Discipline over prediction. Bound by rules.
The Common Mistakes
Eleven ways to hand your money to someone more patient than you. Read them until they sting.
1. Chasing the first tick. Buying the instant price pokes over the OR high, straight into the fake-out. Wait for a candle close and, ideally, a retest. The market pays patient traders and taxes impatient ones — it is almost a physical law.
2. Trading through the news. Taking a position sixty seconds before an 8:30 CPI print because the chart "looks good." The chart is meaningless the instant that number hits — every level you drew gets vaporized. Know your calendar; stand aside for the print unless reacting to it is the plan.
3. Ignoring VWAP. Going long an ORB break while price is trapped under VWAP, fighting the day's fair-value gravity. Don't fight VWAP. Let it confirm your direction, or don't take the trade.
4. Forcing a gap trade with no catalyst read. Shorting a gap-fill on a name that's actually gapping on a hard earnings beat — you're fading real conviction, and you'll get run over. Always ask why the gap exists before deciding it fills.
5. No invalidation. Entering without a defined price that says "I'm wrong, get out." Every trade needs a stop before you enter, sized so a loss is one-third of the target. Traders who don't pre-define their exit let small losses become account-enders. This is the single most expensive mistake on the list.
6. Over-trading the chop. When price whips across VWAP and stays inside the opening range with no break, the correct trade is no trade. The open isn't an obligation. Some mornings the highest-skill move is sitting on your hands until the range resolves — and some mornings it never does, and you should be grateful you saved your capital.
7. Skipping the top-down. Nailing a stock's technical setup while ignoring that the whole market is red and the sector is the weakest on the board. The individual chart is the last checkbox, not the first. A perfect setup in the wrong direction relative to the tape is a losing trade with good decoration.
8. Using the wrong regime's playbook. Running the breakout strategy on a chop day, or fading the edges on a trend day. Read the regime first — sloping vs. flat VWAP, break-and-hold vs. break-and-fail — then pick the playbook. The tools don't change; the correct application does.
9. Sizing by feeling instead of by stop. Betting big because a setup "feels" certain. Certainty is an emotion, not an edge. Size every trade so the dollar risk at the stop is constant, and let the setup quality express itself through frequency (take more A-setups), not through bet size.
10. Moving the stop against the position. Watching a loser and sliding the stop farther to avoid taking the hit. This converts a disciplined small loss into a catastrophic one. The stop moves only in your favor (to lock profit), never against you. No exceptions, no "just this once."
11. Anchoring to the premarket move. Assuming that because a stock ran hard in thin premarket, it will keep running in the real session. Premarket is a low-volume preview and reverses constantly. Let the open — with real liquidity — confirm or reject the premarket move before you trust it.
12. Revenge-trading the open after a loss. Taking the next setup too big and too fast to "make back" the morning's first loss. The open is fast and forgiving of process, brutal to emotion. One clean loss is nothing; the tilt trade that follows it is what does the real damage. Take the loss, breathe, and only take the next setup if it independently qualifies.
FAQ
Which opening-range window should I use — 5, 15, or 30 minutes? Start with 15; it's the best balance of signal and noise for most names and index futures. Use 30 if you keep getting faked out or you're trading a very volatile name or a high-vol day. Use 5 only once you're experienced and the tape is clean and trending — it's fast and fake-prone. Pick one, be consistent, and don't switch windows mid-trade to justify a position.
Does the opening range work on any ticker? It works best on liquid names with real opening volume — index futures (NQ, ES), major ETFs, and large-cap stocks. On thin, low-volume names the range is noisy and the levels don't hold because there aren't enough participants to make them meaningful. Liquidity is what makes the levels real.
What if there's no gap at all — flat open? A flat open is still tradable; you just lean harder on the opening range and VWAP and drop the gap read. A flat open often precedes a trend day that develops from the opening range break, because there's no gap imbalance to resolve first. Mark the range, watch VWAP's slope, and trade the break.
How do I trade around scheduled news like CPI or FOMC? Stand aside for the actual print unless reacting to it is your explicit plan. After the release, let a fresh 15-minute range build on the new information and trade that — the pre-news levels are stale. Many pros treat a big print as a second, better "open" later in the day and run the whole opening-range playbook on it.
Can I use this on the futures overnight/Globex session? Yes — futures traders often mark an "overnight range" and an "opening range" at the Globex reopen or at specific session opens (Asia, London, New York). The New York open (8:30 CT for equity index futures) is the highest-liquidity event and the one this guide centers on, but the same mechanics apply to the London open for anyone trading that session.
What's the single most important level to mark? VWAP, without contest. If you could keep only one line, keep VWAP — it decides bias, acts as dynamic support and resistance, and is where institutional flow benchmarks. The opening range is second; the overnight high/low third.
How many trades should I take in the first 30 minutes? Fewer than you want to. On most mornings, one or two A-setups is the whole day's opportunity. If you're taking five trades before 10:00, you're almost certainly forcing chop. Quality over quantity — the goal is the best setup, not the most setups.
What if I miss the breakout entirely? Wait for the retest, or wait for the next structure — a pullback to VWAP, a break of the next level up. There is always another bus. The worst trades are the ones taken out of FOMO after the clean entry is gone and the risk no longer fits 1:3. A missed trade costs nothing; a chased one costs real money.
The Cheat-Sheet
Tape this next to your screen.
Before the open (by 7:45 CT):
- Index futures direction + VIX + DXY + yields.
- Economic calendar — mark exact times, plan around them.
- Overnight high/low and prior day high/low/close on every name.
- Gap? Catalyst? Gap-and-go or gap-fill hypothesis — written down.
- Watchlist: longs / shorts / neutral, each with a trigger and an invalidation.
- Every trade pre-checked for 1:3 R/R — no 1:3, no trade.
At the open:
- Do NOT trade the first few minutes of noise.
- Mark the 15-minute (or 30-minute) opening range.
- Plot session VWAP; note which side price holds.
- Name the regime: sloping VWAP = trend; flat VWAP = chop; oversized range = high-vol.
Bias in one glance:
- Above VWAP = long bias. Below VWAP = short bias. Whipping = no trade.
- Gap-and-go = holds open price + holds VWAP + breaks overnight level on volume.
- Gap-fill = loses VWAP + rejects overnight level + lower highs → targets prior close.
ORB rules:
- Long on a candle close above OR high, above VWAP, on volume. Short is the mirror.
- Prefer the retest entry: break, come back, hold, go.
- Stop beyond the broken level; target at 1:3; old level becomes new support/resistance.
Regime playbook:
- Trend day → trade breakouts and VWAP pullbacks; don't fade; let runners run.
- Chop day → fade the range edges toward VWAP, or stand aside; cut size.
- High-vol day → widen stops, shrink size to hold dollar risk constant; wait for the second move.
Confluence stack (more agreement = bigger conviction):
- OR level + prior-day level aligned = double wall.
- VWAP + golden pocket (0.618–0.65) overlap = premium bounce.
- RSI divergence against a range-edge break = fade, don't chase.
Top-down gate (all must agree for A+):
- Macro tape green (for longs) / red (for shorts).
- Sector leading in your direction; stock showing relative strength.
- Stock on the right side of the daily EMA 12/22/55 (55 = bias).
The open rewards preparation and punishes improvisation. Do the 7:45 work, respect the levels, read the regime, wait for confirmation, and size every trade to 1:3. You won't win every morning — nobody does — but you'll walk in with a plan while everyone else is still reacting to the first word on the page. The traders who own the first thirty minutes aren't faster or smarter than everyone else. They just did the work before the bell, and then followed it.
Bound by rules, feared by trade.